

Abstract
T-cell large granular lymphocytic leukemia and chronic lymphoproliferative disorder of natural killer cells are intriguing entities between benign and malignant lymphoproliferation. The molecular pathogenesis has partly been uncovered by the recent discovery of somatic activating STAT3 and STAT5b mutations. Here we show that 43% (75/174) of patients with T-cell large granular lymphocytic leukemia and 18% (7/39) with chronic lymphoproliferative disorder of natural killer cells harbor STAT3 mutations when analyzed by quantitative deep amplicon sequencing. Surprisingly, 17% of the STAT3-mutated patients carried multiple STAT3 mutations, which were located in different lymphocyte clones. The size of the mutated clone correlated well with the degree of clonal expansion of the T-cell repertoire analyzed by T-cell receptor beta chain deep sequencing. The analysis of sequential samples suggested that current immunosuppressive therapy is not able to reduce the level of the mutated clone in most cases, thus warranting the search for novel targeted therapies. Our findings imply that the clonal landscape of large granular lymphocytic leukemia is more complex than considered before, and a substantial number of patients have multiple lymphocyte subclones harboring different STAT3 mutations, thus mimicking the situation in acute leukemia.
Introduction
Large granular lymphocytic (LGL) leukemia is characterized by an increased number of clonal cytotoxic T or natural killer (NK) cells in blood and bone marrow.1 Concurrent neutropenia, anemia, and autoimmune disorders, such as rheumatoid arthritis, further support the diagnosis in unclear cases.2,3 Leukemic T-LGL cells are terminally differentiated effector memory cells (CD3+CD45RA+CD62LnegCD57+) with clonal rearrangement of the T-cell receptor (TCR) genes.4 According to the World Health Organization (WHO) 2008 criteria, chronic lymphoproliferative disease of NK cells (CLPD-NK) is a separate entity and differs from aggressive, chemorefractory NK-LGL leukemia.5
The phenotype of leukemic cells indicates that the expansion originally developed in response to an antigen. However, unlike their normal counterparts, leukemic LGL cells are resistant to subsequent Fas-mediated activation-induced cell death.6 A current hypothesis postulates that following antigen encounter, the dysregulation of several signaling pathways and cytokines such as interleukin-15, platelet-derived growth factor receptor, and signal transducer and activator of transcription 3 (STAT3) sustains a constitutively active clonal cell population.6,7 The importance of these pathways has been emphasized in the light of the recent discovery of somatic mutations in STAT3 and STAT5b genes.8–13 The mutations were located in the Src-like homologue 2 (SH2) domain of STAT3 and STAT5b, caused constitutive phosphorylation of the mutated proteins, and increased the transcriptional activity of STAT3 and STATb5 in vitro.8,9,14 Expression of mutated STAT3 in mouse bone marrow led to the development of myeloproliferative neoplasm, and recently similar STAT3 and STAT5b mutations have also been discovered in other hematologic malignancies.12,15–19
In this project we aimed to analyze the frequency of STAT3 mutations and the clonal architecture of expanded lymphocytes using both STAT3 and TCR beta (TCRB) chain deep sequencing methods in a unique cohort of 213 patients with LGL leukemia. In addition, the effect of immunosuppressive treatment on the mutated clones was studied in follow-up samples obtained during therapy to assess if quantitative STAT3 mutation analysis could be used to monitor therapy response.
Methods
Additional methods of this study are described in the Online Supplementary Appendix.
Study patients
The study was undertaken in compliance with the principles of the Helsinki declaration and was approved by the ethics committees of Helsinki University Central Hospital (Finland), the Cleveland Clinic (Ohio, USA) and the Penn State Hershey Cancer Institute (Pennsylvania, USA). The study population consisted of 213 patients with LGL leukemia as defined by the WHO 2008 criteria: 174 patients had CD8+ T-LGL leukemia and 39 patients had CLPD-NK. Samples were collected in the Penn State Hershey Cancer Institute (n=93), the Cleveland Clinic (n=89), and Finland (n=31). One hundred and twelve patients with T-LGL leukemia and 30 with CLPD-NK included in the current study cohort were also part of two previous study cohorts analyzing STAT3 mutation frequency by capillary sequencing.8,9 All patients gave written informed consent to participation in this study.
Sample collection and DNA extraction
Mononuclear cells were separated from peripheral blood using Ficoll gradient separation (GE Healthcare, Pittsburgh, PA, US, USA) and cryopreserved in fetal bovine serum with 10% dimethylsulfoxide. Peripheral blood mononuclear cells were labeled with antibodies and sorted into CD4+ T-cell, CD8+ T-cell, and NK-cell fractions using antibodies for CD3, CD4, CD8, and CD16/56 (Beckton Dickinson, San Jose, CA, USA). In cases of T-LGL leukemia, the CD8+ T-cell population was further sorted into clonal/non-clonal cells based on the flow cytometry analysis of TCRB variable chain (Vbeta) expression (IOTest® Beta Mark Kit, Beckman Coulter, Brea, CA, US). DNA was extracted using a NucleoSpin Tissue or Tissue XS kit (Macherey-Nagel, Dueren, Germany) and the concentration was measured with Qubit (Life Technologies, Carlsbad, CA, USA).
Deep targeted sequencing and capillary sequencing of STAT3 exon 21
STAT3 exon 21 was sequenced using deep amplicon sequencing and the Illumina Miseq platform as described previously.10 The data were analyzed with a novel in-house bioinformatics pipeline, which is based on calling of variants with certain count/frequency and filtering out false positives using the estimated error rate and quality data of amplicon reads. STAT3 amplicon sequencing and data analysis are described in detail in the Online Supplementary Appendix. STAT3 exon 21 capillary sequencing was performed as previously described.9
High-throughput T-cell receptor sequencing
TCRB complementarity determining regions (CDR3β) were amplified and sequenced by Adaptive Biotechnologies Corp. (Seattle, WA, USA) using ImmunoSEQ assay Survey level analysis, which is capable of detecting one cell in 40,000 T cells.20 The TCRB sequencing method is described in the Online Supplementary Appendix.
Statistical analysis
Categorical variants between groups were compared using the χ2 test. Comparisons of parametric variables between groups were performed with one-way ANOVA and the Bonferroni post hoc test, or unpaired t test, as appropriate. A P value <0.05 was considered statistically significant.
Results
STAT3-amplicon sequencing is a sensitive and reliable method
Deep, targeted sequencing is a relatively new method and we, therefore, first compared the sensitivity of amplicon sequencing with the well-established allele-specific oligonucleotide (ASO) real-time quantitative polymerase chain reaction (qPCR) method. The results of ASO-qPCR for STAT3 mutations Y640F and D661V and amplicon sequencing of STAT3 exon 21 were congruent in seven of the eight cases analyzed (Online Supplementary Table S1). The only discordant case (patient 14, Figure 1) was faintly positive for Y640F by ASO-qPCR, but even the analysis of sorted lymphocyte fractions did not show the Y640F mutation by amplicon sequencing.
Figure 1.
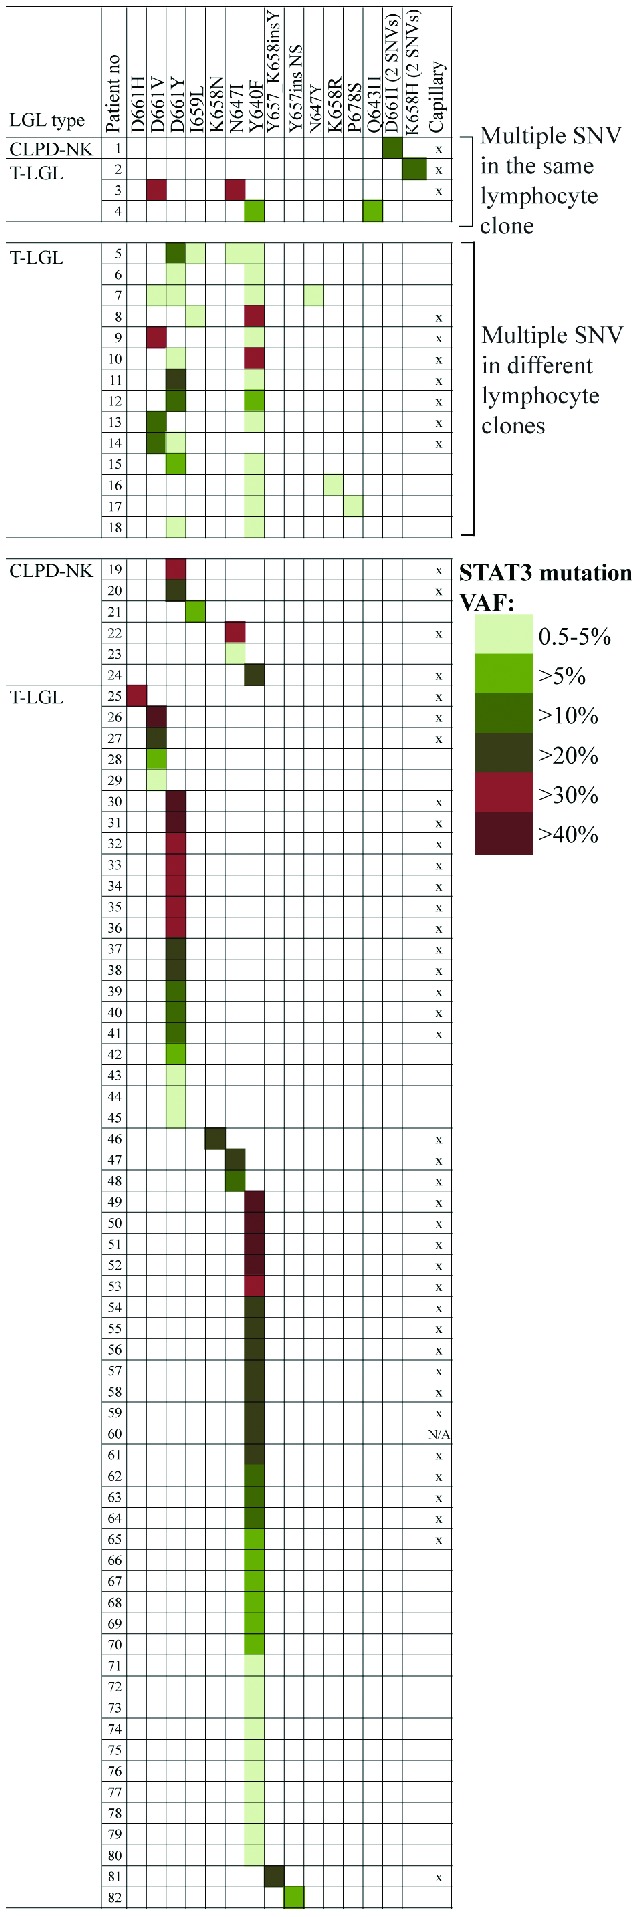
STAT3 mutations and variant allele frequencies detected by amplicon sequencing. The patients are grouped based on the number and allelic location of STAT3 mutations, and the LGL leukemia type. STAT3 mutations detected also by capillary sequencing are marked with “x” in the last column. NS: nonsense; VAF: variant allele frequency. SNV: single nucleotide variants.
As another quality control, we sequenced a dilution series from a CD8+ peripheral blood mononuclear cell sample (patient 9, Figure 1) with known STAT3 D661V [variant allele frequency (VAF) 37%] and Y640F (VAF 1.4%) mutations in the CD8+ fraction: Y640F mutation with low VAF was not seen in the original sequencing of the peripheral blood mononuclear cell sample (Online Supplementary Table S2, Figure 1). The D661V mutation was detected at the 2% dilution level with a VAF of 0.633% (frequency ratio 0.896), whereas with the next dilution of 1% and a VAF of 0.433% the frequency ratio dropped under 0.8, being still on the borderline 0.75–0.80. However, the noise exceeded the number of variant alleles and the mutation could not be reliably verified (Online Supplementary Table S2). The 0.5% cut-off for VAF seemed reasonable and was used in the following analysis.
As a negative control, we sequenced samples from eight patients with chronic myeloid leukemia with clonal LGL lymphocytosis during dasatinib treatment (a proportion of dasatinib-treated patients with chronic myeloid leukemia have drug-induced clonal LGL lymphocytosis).21,22 Sorted monoclonal CD8+ expansions from four patients (CD8+ Vbeta clone size 10–69%) and total CD8+ fractions from four additional cases (CD8+ Vbeta clone size 10–27%) were analyzed by amplicon sequencing. All tested samples were STAT3 mutation-negative.
The frequency and pattern of STAT3 mutations in patients with large granular lymphocytosis leukemia as determined by deep quantitative sequencing
The exon 21 of STAT3 gene was analyzed by both capillary and amplicon sequencing from a cohort of 213 LGL leukemia patients. DNA samples were extracted either from whole blood, peripheral blood mononuclear cells, or CD8+ T cells. The frequency of STAT3 mutations was 23% (50/213) by capillary sequencing and 38% (82/213) by amplicon sequencing, showing the superiority of amplicon sequencing as a screening assay. The mutations were significantly more common in T-LGL leukemia than in CLPD-NK (75/174, 43% versus 7/39, 18%; P=0.0034).8,11 Capillary sequencing did not detect mutations with VAF smaller than 9% (Figure 1, Online Supplementary Table S3). The cohort of patients also included 72 of the 77 T-LGL leukemia patients with a large immunodominant clone (mean clone size 78%; range, 32–99%) described in the original publication of STAT3 mutations in LGL leukemia,9 and the frequency of STAT3 mutations was as high as 63% (45/72) by amplicon sequencing, compared to 43% by capillary sequencing. The mean clone size in the rest of the patients was 39% of CD8+ cells (range, 6–97%).
A substantial proportion of patients with large granular lymphocytic leukemia carry multiple STAT3 mutations
In the amplicon sequencing analysis 22% (18 of 82) of STAT3-mutated patients harbored multiple mutations in the STAT3 gene (Figure 1). In 17/18 of the cases either Y640 or D661 or both were mutated (Figure 1). As an extreme example, two patients harbored four different STAT3 mutations (Figure 1). Patients with multiple STAT3 mutations could be divided into two different groups based on the allelic status derived from the amplicon data: (i) patients harboring two single nucleotide variants in the same STAT3 allele, resulting in one or two amino acid changes (n=4, Figure 1, patients 1–4), and (ii) patients displaying multiple STAT3 mutations in different alleles and lymphocyte clones (n=14, Figure 1, patients 5–18). Thus, 17% of STAT3-mutated cases (14 of 82) had multiple mutated clones in the original screening.
Correlation of STAT3 mutations with clinical parameters
Intrigued by the finding of multiple STAT3 mutations, we studied the correlation between the phenotype of the patients and STAT3 mutation status to assess whether multiple mutations would affect the clinical characteristics of patients (Table 1). Rheumatoid arthritis, which is the most common autoimmune manifestation in LGL leukemia patients,23 was significantly more common in T-LGL patients with one or multiple STAT3 mutations: 43% (6/14) of patients with multiple mutations and 23% (14/61) with one mutation suffered from rheumatoid arthritis compared to 6% (6/99) of patients without mutations (P<0.0001) (Table 1). No statistical difference was seen in the prevalence of rheumatoid arthritis between patients with one or multiple STAT3 mutations (P=0.18). Patients who had multiple STAT3-mutated clones were almost exclusively males (13/14, 93%) (Table 1). The size of the major expansion in TCR Vbeta analysis was greater among patients with one STAT3 mutation than among those without mutations (P<0.0001) (Figure 2A). Neutropenia is often associated with LGL leukemia23, and T-LGL leukemia patients with STAT3 mutations had a tendency toward lower neutrophil counts at diagnosis, but the difference was not statistically significant (Table 1). No significant clinical correlations were detected in the CLPD-NK cohort, possibly due to the lower number of patients (Table 1).
Table 1.
Clinical characteristics of the patients.
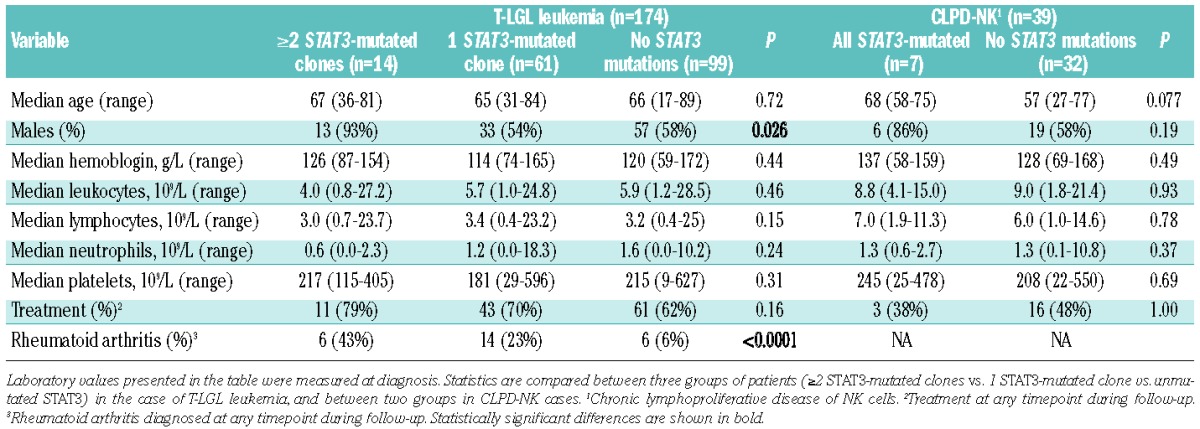
Figure 2.
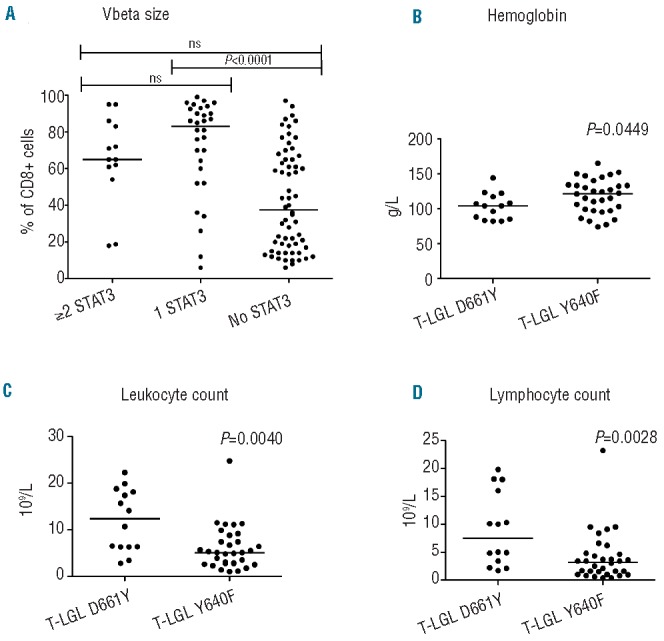
Comparison of different clinical parameters between patients with LGL leukemia patients divided into groups based on STAT3 mutation status. Horizontal lines define medians of measured variables in all figures. (A) The sizes of the largest clones in CD8+ lymphocytes detected in T-LGL leukemia patients by flow cytometry (T-cell receptor beta chain variable region analysis). T-LGL patients were divided into three groups: those with ≥2 STAT3 mutation (data available from 13 patients), 1 mutation (n=30) or no mutations (n=62). Hemoglobin (B), absolute leukocyte count (C) and lymphocyte count (D) of T-LGL leukemia patients with either D661Y or Y640F mutation were compared.
The clinical picture was compared in more detail between patients carrying the two most common mutations, Y640F and D661Y (Figure 1). D661Y-mutated patients had lower hemoglobin values at diagnosis (median 104 versus 122 g/L, P=0.0449), whereas they had higher leukocyte and lymphocyte counts (12.4 versus 5.1 × 10⁶/L, P=0.0440 and 7.5 versus 3.2 × 10⁶/L, P=0.0028, respectively) (Figure 2B–D).
STAT3 sequencing of sorted lymphocyte fractions
Screening for STAT3 mutations was performed on unsorted samples, and the exact location of the mutations and the clonal hierarchy were further analyzed in sorted lymphocyte fractions.
Patients with one STAT3 mutation have a monoclonal pattern in Vbeta analysis
First we sorted and analyzed samples from five T-LGL leukemia patients with a monoclonal pattern in TCR Vbeta analysis (clone size 27–81%) carrying a single STAT3 mutation in the original screening. In four of the five cases the mutation was located in the major CD8+ Vbeta expansion, and no other STAT3 mutations were detected in sorted lymphocyte fractions including CD4+ T cells, Vbeta expansion-negative CD8+ cells, and CD3neg NK cells and B cells (Figure 3A, Online Supplementary Figure S1). In one case (patient 48, Figure 1), in addition to the N647I-mutated major Vb21.3+ expansion, three low VAF mutations were detected in the sorted Vb21.3neg CD8+ fraction, which were not discovered in the original screening (Figure 3B).
Figure 3.
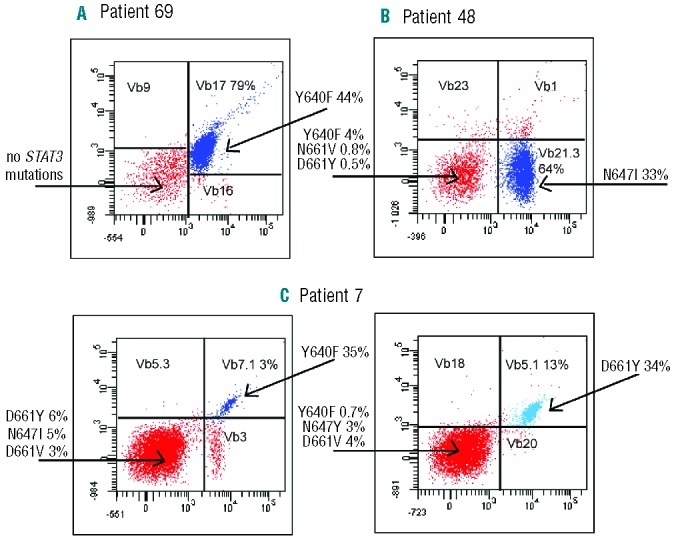
The flow cytometry Vbeta analysis and STAT3-sequencing results of flow cytometry-sorted lymphocyte fractions from three representative T-LGL leukemia patients. The monoclonal Vbeta antibodies were conjugated with either FITC (x-axis), PE (y-axis), or both PE and FITC (double-positive population), and the Vbeta populations analyzed are marked in each dotplot with the percentage of the clone in CD8+ cells. STAT3 mutations and their VAF are indicated with arrows. (A) The results of patient 69 after 1.5 years after cyclosporine treatment. (B) STAT3 results of patient 48 with four different STAT3 mutations. (C) Patient 7 (Figure 1) had two CD8+ expansions at baseline, Vb7.1+ 10% and Vb5.1 11% (data not shown), and 4 years later during methotrexate treatment the expansions were 3% and 13%, respectively, both harboring STAT3 mutations. This patient also had two minor STAT3 mutations in Vbeta-negative CD8+ cells. FITC: fluorescein isothiocyanate; PE: phycoerythrin; VAF: variant allele frequency.
Multiple STAT3 mutations in sorted lymphocytes
A similar analysis was done on cells from two T-LGL leukemia patients who harbored a set of multiple STAT3 mutations already in the original screening (Figure 3C, Online Supplementary Figure S1). The patients carried STAT3 mutations in both detected Vbeta expansions and, in addition, an apparently non-clonal CD8+ population from patient 7 contained two additional mutations, N647Y and D661V (Figure 3C). CD4+ and CD3neg lymphocyte fractions did not harbor STAT3 mutations.
Comparison of clonality analysis by STAT3 and deep T-cell receptor beta chain sequencing
Detailed analysis of TCRB CDR3 region rearrangement and clonality was performed in paired samples from three T-LGL leukemia patients who had multiple STAT3 mutations. The patients were not HLA-matched. We assumed that in the case of a heterozygous STAT3 mutation, the size of the mutated clone determined by deep TCRB sequencing would be approximately twice the STAT3 mutation VAF. The number of TCRB CDR3 reads for each sample is shown in Online Supplementary Table S4.
Deep T-cell receptor beta chain sequencing results are in concordance with the STAT3 mutation analysis
The results of deep TCRB sequencing were in concordance with STAT3 mutation analysis, and they also explained the observed differences between clone size analysis (flow cytometry) and STAT3 amplicon sequencing. Patient 8, who had Y640F-mutated Vb3+ expansion in the Vbeta flow analysis, correspondingly had one major expansion in the sorted Vb3+ fraction (73% of TCRB sequences) (Figure 4A, Online Supplementary Table S5). The Vb3neg fraction was also abnormally skewed and consisted of a single clonal TCRB sequence (74% of reads), which explains the high VAF (25–35% at different timepoints) of STAT3 I659L in the Vb3neg fraction (Figure 4A). The TCRB rearrangement observed in the Vb3neg fraction also appeared in the sorted Vb3+ sample, due to impurity of the sorting (86% of sorted cells were Vb3+) (Figure 4A).
Figure 4.

Flow cytometry Vbeta analysis results and TCRB CDR3 repertoire landscape of two T-LGL leukemia patients. STAT3 mutation VAF are shown in the titles of the analyzed fractions. (A) Patient 8 had one major Vb3+ expansion (93%) in Vbeta analysis, corresponding to the major TCRB rearrangement in the sorted Vb3+ fraction. Vb3neg fraction appeared polyclonal in the Vbeta analysis, but TCRB sequencing revealed a single major TCRB clone. The TCRB rearrangement observed in the Vb3neg fraction was also present in the sorted Vb3+ sample, due to impurity of the sorting (86% of sorted cells were Vb3+). (B) Patient 48 presented with a monoclonal pattern in Vbeta analysis, but TCRB analysis of flow cytometry-sorted Vb21+ cells revealed two TCRB rearrangements with different amino acid sequences, recognized by the same monoclonal antibody, whereas the Vb21neg fraction of the same patient showed only minor TCRB rearrangements. CDR3: complementarity determining region 3; TCRB: T-cell receptor beta chain; VAF: variant allele frequency.
Patient 48 had a large Vb21.3+ clone in Vbeta flow analysis, but the VAF of N647I was only 34% in the sorted Vb21.3+ fraction. The sorted Vb21.3+ population was dominated by a clonal TCRB rearrangement that covered 63% of TCRB sequences, corresponding to the estimated percentage of STAT3-mutated cells from amplicon sequencing (2×VAF of 33%), but in addition, 26% of the sequences came from another rearrangement with the TCRBV20-01 gene (Figure 4B). Interestingly, based on the flow cytometry purity analysis the sorted Vb21.3+ fraction seemed monoclonal and contained only Vb21.3+ cells, so both clones with different amino acid sequences were recognized by the same Vbeta antibody (Table 2). The Vb21.3neg population was less skewed: the largest productive TCRB rearrangements were 4%, 2% and 2% of sequences, and probably contained the STAT3 mutations detected in the Vb21.3neg fraction (Figure 4B, Online Supplementary Table S5).
Patient 14 had two CD8+ expansions (Online Supplementary Figure S1) and the TCRB analysis of the larger one (Vb17+) showed that 83% of TCRB rearrangement sequences were of a single clone, again corresponding well to the VAF (41%) of the D661V mutation (Online Supplementary Figure S1, Online Supplementary Table S5). A smaller D661Y-mutated Vb13.6+ clone accounted for 11% of CD8+ cells in Vbeta analysis, but TCRB sequencing could not be done due to the low amount of Vb13.6+ DNA. A corresponding TCRB sequence was seen in the analysis of the CD3+ fraction (Online Supplementary Figure S1, Online Supplementary Table S5).
STAT3-mutated clones did not share homologous T-cell receptor beta chain sequences
In the comparison of the 20 most frequent TCRB CDR3 amino acid sequences of each patient, all sequences were unique and not present in either of the two other cases (data not shown). A similar analysis of the clones shown in Online Supplementary Table S5 was done between patients and 586 healthy individuals (peripheral blood mononuclear cells sequenced, provided by the Adaptive Biotechnologies), and in each LGL leukemia case at least one of the leukemic clones was seen in the healthy controls (the prevalence of the amino acid sequence varied between 0–20% in the healthy control dataset, Online Supplementary Table S5). However, the frequencies of these amino acid sequences in individual healthy control samples were low (0.0001–0.005%), corresponding to a single cell per sample.
In the case of multiple STAT3-mutated clones within each patient, the sequences were not apparently homologous, although interestingly the flow cytometry Vbeta antibody recognized two rearrangements in the Vb21.3+ fraction of patient 48, suggesting that although the amino acid sequences in the CDR3 region are dissimilar, they may share some homology in the three-dimensional structure of the receptors (Figure 4B, Online Supplementary Table S5).
STAT3 mutation analysis can be used in the follow-up of response to treatment
Sequential samples were available for STAT3 mutation analysis from six patients including patients with one (n=3) or multiple (n=3) STAT3 mutations. Four patients were diagnosed with T-LGL leukemia, one with CLPD-NK, and one patient had both T-and NK cell expansions. Patients were treated with either methotrexate (n=2) or cyclophosphamide (n=3) and one patient was untreated. The median follow-up time was 33 months (range, 24–62).
Patient 4 was untreated, and developed anemia and neutropenia during a follow-up of 28 months: the CD8 percentage increased slightly concomitantly with the development of cytopenias, but the mutated leukemic clone was unchanged and no new STAT3 mutations evolved (Figure 5A).
Figure 5.

STAT3 sequencing results and clinical data of three representative LGL leukemia patients. In each case the first figure shows the size of the LGL clone and VAF of STAT3 mutation at different timepoints, and the second figure presents the hematologic parameters. (A) The results of untreated patient 4, who developed anemia and neutropenia before the initiation of methotrexate (MTX) treatment. (B) Patient 8 was treated with MTX. Leukemic STAT3-mutated clones persisted during MTX therapy, and the patient developed anemia after cessation of the therapy. (C) Patient 44 had an aberrant STAT3-mutated CD3negCD16/56neg NK-LGL population, which was suppressed during remission achieved by cyclophosphamide (CTX) treatment simultaneously with restoration of normal NK cells. In addition, the patient had two CD8+ clones with unmutated STAT3: the Vb20+ clone was suppressed during CTX administration, whereas Vb8+ cells were first seen during complete remission. At the last timepoint the number of NK-LGL cells was too low for DNA extraction and STAT3 mutation analysis. Tx: therapy; VAF: variant allele frequency.
The mutated clone(s) persisted during the course of therapy in two T-LGL leukemia patients treated with methotrexate, although improvement of hemoglobin values was observed in both cases during immunosuppression (Figure 5B, Online Supplementary Figure S2). However, the partial response achieved was lost after the cessation of methotrexate in the case of patient 8 (Figure 5B).
The disappearance of STAT3-mutated clones was associated with complete remission in two patients treated with cyclophosphamide (Figure 5C, Online Supplementary Figure S2). In both cases STAT3 mutation status was the only reliable marker of clonality, as both patients had an aberrant leukemic CD3negCD19negCD16/56neg NK-LGL population carrying a STAT3 mutation (Figure 5C, Online Supplementary Figure S2). In the case of patient 44, D661Y-mutated NK-LGL cells were suppressed and normal NK cells were restored at complete remission (Figure 5C). The third patient treated with cyclophosphamide developed marked cytopenias during treatment, and no change was observed in the immunodominant STAT3-mutated clone (Online Supplementary Figure S2).
Discussion
Next generation sequencing methods have enabled the discovery of the molecular background and clonal hierarchy of many hematologic malignancies. Although LGL leukemia differs from acute leukemia, our results show that clonal diversity also plays a role in the former. To our surprise, 17% of all LGL leukemia patients with STAT3 mutations had multiple mutations in the STAT3 gene residing solely in cytotoxic CD8+ or NK cells. The initial mutation-causing event remains undiscovered, but the combined results from TCRB deep sequencing and STAT3 mutation analysis suggest that a polyclonal immune response may lay the foundation for mutagenesis.
Ultra-deep amplicon sequencing is a novel method for mutation screening, quantitative analysis of the mutated clones, and monitoring of disease burden. Based on our results, the data obtained from amplicon analysis is in good accordance with ASO-qPCR data, and the assay can reliably detect clones down to a VAF threshold of 0.5%, even though higher sensitivities may be reached with ASO-qPCR assays. Compared to ASO-qPCR, the amplicon method can cover a larger part of the gene (one exon, for example, in the case of STAT3) and identify previously unknown mutations in a single run, whereas ASO-qPCR is based on mutation-specific primers. However, ASO-qPCR may provide data on common mutations quickly without the need for next-generation sequencing facilities. With the amplicon method, the STAT3 mutation frequency was 38% in our whole LGL leukemia cohort and significantly higher (over 60%) when only patients with large immunodominant clones were analyzed. Based on these results it is likely that the diagnosis of LGL leukemia made according to WHO criteria may include different disease subtypes and in some cases also reactive LGL proliferations. Similarly, previous studies have shown that the prevalence of STAT3 mutations can be as high as 40–70% in T-LGL leukemia, when patients with monoclonal expansions are studied.9,11 STAT3 mutations are only rarely found in other hematologic malignancies.12,15,17,24,25
The reason for the high incidence of STAT3 mutations in LGL leukemia is unknown. In the detailed analysis of LGL populations, the occurrence of STAT3 mutations was restricted to expanded lymphocyte clones. During CD8 memory cell development, the STAT3 pathway is activated, and it may be exposed to mutagenesis during an initial polyclonal cell proliferation.26,27 As the STAT3 mutations in LGL leukemia are gain-of-function mutations and are able to cause leukemic transformation in multiple settings,8,9,14,15 they may give a survival advantage to affected cells, leading to a narrowing of the TCR repertoire and expansion of certain clones. In most cases, patients with multiple mutations had one immunodominant clone and additional smaller expansions, indicating that the clones may have different proliferation capacity or apoptotic resistance, which could be due to the activation potential or temporal variation in the occurrence of the STAT3 mutation in question. The presence of several STAT3 mutations could also be related to the clonal drift phenomenon, where the immunodominant LGL clone changes.28 In addition, STAT3-mutated clones may carry somatic mutations in other genes, which affect the proliferative capacity of affected lymphocytes. These mutations could also drive the lymphoproliferation in patients without STAT3 mutations.29,30 However, it is interesting to speculate that other factors such as a dysregulated immune system may be needed to sustain the leukemic LGL expansion. In a proportion of cases, these other abnormalities can even lead to the development of LGL leukemia without a somatic driver mutation. This hypothesis is strengthened by a recent study showing that the activated interleukin-6-STAT3 loop had a significant role in the pathogenesis of LGL leukemia independently of STAT3 mutation status.31
The association between rheumatoid arthritis and multiple STAT3 mutations in our cohort of patients points toward the involvement of chronic antigen stimulation in the pathogenesis of T-LGL leukemia. Based on our hypothesis polyclonal T cells with autoreactive TCR may represent the starting point for multiple mutated clonal expansions and for rheumatoid arthritis, but other factors are also likely to contribute. In our patients we were not able to address whether in most cases rheumatoid arthritis preceded the diagnosis of LGL leukemia or vice versa, but in previous studies, symptomatic rheumatoid arthritis was demonstrated to occur either concurrently or prior to LGL leukemia.32,33 Further studies with paired follow-up samples and genetically modified mouse models are warranted to understand the detailed pathomechanism and the relation of STAT3 mutation formation with rheumatoid arthritis.
The deep TCRB sequencing data showed that the results of STAT3 mutation analysis were in good accordance with the sizes of the clonal CDR3 rearrangements. STAT3-mutated clones did not share TCRB CDR3 homology even in the case of multiple STAT3 mutations in the same patient. However, identical amino acid sequences could be found at a low frequency in healthy controls suggesting that they are common TCR sequences. It was established earlier that the major clones in CD8+ T-LGL leukemia patients are rarely identical, but the immunodominant clones are sometimes seen at a low frequency in other patients when the whole TCRB repertoire is analyzed.28,34–36 It should, however, be noted that the specific antigen can be recognized by a large number of different TCR types depending on the peptide presented, and the variation of HLA genes also affects antigen recognition.37,38 The presence of a shared antigen driving the LGL proliferation has not, therefore, been ruled out, although our current understanding suggests more private antigens.
During the past years LGL leukemia patients have primarily been treated with immunosuppressive regimens with unsatisfactory results, and over half of the patients relapse on therapy.3 In clinical studies, the evaluation of response to treatment has included mainly the follow-up of hematologic parameters and TCR PCR testing, both of which are relatively insensitive and unspecific approaches. STAT3 amplicon sequencing provides a new method to analyze treatment response, and it generates quantitative data on the clone sizes. Although the number of patients we analyzed was relatively small, the sizes of the STAT3-mutated clones were in good accordance with clinical results, and the findings may explain why patients relapse. For example, patients treated with methotrexate did not show a marked change in the size of the mutated clone during the observation period. The initial partial responses achieved may be due to the immunosuppressive effect of methotrexate on cytotoxic cell function, but methotrexate therapy is not able to eradicate the mutated clone. Interestingly though, the mutated clones disappeared in two patients who went into complete remission during cyclophosphamide treatment. Concordantly, recent results support the use of cyclophosphamide as a first-line therapy: the overall response rate was 71% (complete response 47%) and relapses were rarely observed.39 Low relapse rates could be related to the ability of cyclophosphamide to eradicate LGL clones, but further studies with larger patient cohorts are needed to confirm the preliminary findings.
To conclude, ultra-deep STAT3 amplicon sequencing is a reliable method, which can be used in diagnostics and treatment response evaluation in LGL leukemia. A significant proportion of LGL leukemia patients have multiple STAT3-mutated lymphocyte clones mimicking the clonal diversity observed in patients with acute leukemia. Sequential analysis of samples suggested that the current immunosuppressive therapy is not able to eradicate the STAT3-mutated clones and novel targeted therapies are, therefore, needed to improve treatment results.
Acknowledgments
This work was supported by the Academy of Finland, the Finnish Cancer Societies, Sigrid Juselius Foundation, State funding for university-level health research in Finland, the National Graduate School of Clinical Investigation, The Finnish Medical Foundation, Blood Disease Foundation, Finnish Association of Haematology, Finnish Funding Agency for Technology and Innovation, Instrumentarium Science Foundation and Gyllenberg Foundation. The work of JPM and MJC was supported in part by the National Institutes of Health (grants 2K24HL077522, R01 CA127264A and R01AI085578). The work of TO was supported by the National Institutes of Health/National Cancer Institute (Institutional Training Grant T32CA009109).
Footnotes
The online version of this article has a Supplementary Appendix.
Authorship and Disclosures
Information on authorship, contributions, and financial & other disclosures was provided by the authors and is available with the online version of this article at www.haematologica.org.
References
- 1.Loughran TP, Jr., Kadin ME, Starkebaum G, Abkowitz JL, Clark EA, Disteche C, et al. Leukemia of large granular lymphocytes: association with clonal chromosomal abnormalities and autoimmune neutropenia, thrombocytopenia, and hemolytic anemia. Ann Intern Med. 1985;102(2):169–75. [DOI] [PubMed] [Google Scholar]
- 2.Burks EJ, Loughran TP., Jr Pathogenesis of neutropenia in large granular lymphocyte leukemia and Felty syndrome. Blood Rev. 2006;20(5):245–66. [DOI] [PubMed] [Google Scholar]
- 3.Bareau B, Rey J, Hamidou M, Donadieu J, Morcet J, Reman O, et al. Analysis of a French cohort of patients with large granular lymphocyte leukemia: a report on 229 cases. Haematologica. 2010;95(9):1534–41. [DOI] [PMC free article] [PubMed] [Google Scholar]
- 4.Yang J, Epling-Burnette PK, Painter JS, Zou J, Bai F, Wei S, et al. Antigen activation and impaired Fas-induced death-inducing signaling complex formation in T-large-granular lymphocyte leukemia. Blood. 2008;111(3): 1610–6. [DOI] [PMC free article] [PubMed] [Google Scholar]
- 5.Hart DN, Baker BW, Inglis MJ, Nimmo JC, Starling GC, Deacon E, et al. Epstein-Barr viral DNA in acute large granular lymphocyte (natural killer) leukemic cells. Blood. 1992;79(8):2116–23. [PubMed] [Google Scholar]
- 6.Epling-Burnette PK, Liu JH, Catlett-Falcone R, Turkson J, Oshiro M, Kothapalli R, et al. Inhibition of STAT3 signaling leads to apoptosis of leukemic large granular lymphocytes and decreased Mcl-1 expression. J Clin Invest. 2001;107(3):351–62. [DOI] [PMC free article] [PubMed] [Google Scholar]
- 7.Zhang R, Shah MV, Yang J, Nyland SB, Liu X, Yun JK, et al. Network model of survival signaling in large granular lymphocyte leukemia. Proc Natl Acad Sci USA. 2008;105(42):16308–13. [DOI] [PMC free article] [PubMed] [Google Scholar]
- 8.Jerez A, Clemente MJ, Makishima H, Koskela H, Leblanc F, Peng Ng K, et al. STAT3 mutations unify the pathogenesis of chronic lymphoproliferative disorders of NK cells and T-cell large granular lymphocyte leukemia. Blood. 2012;120(15):3048–57. [DOI] [PMC free article] [PubMed] [Google Scholar]
- 9.Koskela HL, Eldfors S, Ellonen P, van Adrichem AJ, Kuusanmaki H, Andersson EI, et al. Somatic STAT3 mutations in large granular lymphocytic leukemia. N Engl J Med. 2012;366(20):1905–13. [DOI] [PMC free article] [PubMed] [Google Scholar]
- 10.Rajala HL, Eldfors S, Kuusanmaki H, van Adrichem AJ, Olson T, Lagstrom S, et al. Discovery of somatic STAT5b mutations in large granular lymphocytic leukemia. Blood. 2013;121(22):4541–50. [DOI] [PMC free article] [PubMed] [Google Scholar]
- 11.Fasan A, Kern W, Grossmann V, Haferlach C, Haferlach T, Schnittger S. STAT3 mutations are highly specific for large granular lymphocytic leukemia. Leukemia. 2013;27(7):1598–600. [DOI] [PubMed] [Google Scholar]
- 12.Ohgami RS, Ma L, Merker JD, Martinez B, Zehnder JL, Arber DA. STAT3 mutations are frequent in CD30+ T-cell lymphomas and T-cell large granular lymphocytic leukemia. Leukemia. 2013;27(11):2244–7. [DOI] [PubMed] [Google Scholar]
- 13.Rajala HL, Porkka K, Maciejewski JP, Loughran TP, Jr, Mustjoki S. Uncovering the pathogenesis of large granular lymphocytic leukemia-novel STAT3 and STAT5b mutations. Ann Med. 2014;46(3):114–22. [DOI] [PubMed] [Google Scholar]
- 14.Pilati C, Amessou M, Bihl MP, Balabaud C, Nhieu JT, Paradis V, et al. Somatic mutations activating STAT3 in human inflammatory hepatocellular adenomas. J Exp Med. 2011;208(7):1359–66. [DOI] [PMC free article] [PubMed] [Google Scholar]
- 15.Couronne L, Scourzic L, Pilati C, Valle VD, Duffourd Y, Solary E, et al. STAT3 mutations identified in human hematologic neoplasms induce myeloid malignancies in a mouse bone marrow transplantation model. Haematologica. 2013;98(11):1748–52. [DOI] [PMC free article] [PubMed] [Google Scholar]
- 16.Ohgami RS, Ma L, Monabati A, Zehnder JL, Arber DA. STAT3 mutations are present in aggressive B-cell lymphomas including a subset of diffuse large B-cell lymphomas with CD30 expression. Haematologica. 2014;99(7):e105. [DOI] [PMC free article] [PubMed] [Google Scholar]
- 17.Hu G, Witzig TE, Gupta M. A novel missense (M206K) STAT3 mutation in diffuse large B cell lymphoma deregulates STAT3 signaling. PloS One. 2013;8(7):e67851. [DOI] [PMC free article] [PubMed] [Google Scholar]
- 18.Kontro M, Kuusanmaki H, Eldfors S, Burmeister T, Andersson EI, Bruserud O, et al. Novel activating STAT5B mutations as putative drivers of T-cell acute lymphoblastic leukemia. Leukemia. 2014;28(8):1738–42. [DOI] [PubMed] [Google Scholar]
- 19.Nicolae A, Xi L, Pittaluga S, Abdullaev Z, Pack SD, Chen J, et al. Frequent STAT5B mutations in γδ hepatosplenic T-cell lymphomas. Leukemia. 2014;28(11):2244–8. [DOI] [PMC free article] [PubMed] [Google Scholar]
- 20.Robins H, Desmarais C, Matthis J, Livingston R, Andriesen J, Reijonen H, et al. Ultra-sensitive detection of rare T cell clones. J Immunol Methods. 2012;375(1–2):14–9. [DOI] [PMC free article] [PubMed] [Google Scholar]
- 21.Mustjoki S, Ekblom M, Arstila TP, Dybedal I, Epling-Burnette PK, Guilhot F, et al. Clonal expansion of T/NK-cells during tyrosine kinase inhibitor dasatinib therapy. Leukemia. 2009;23(8):1398–405. [DOI] [PubMed] [Google Scholar]
- 22.Kreutzman A, Juvonen V, Kairisto V, Ekblom M, Stenke L, Seggewiss R, et al. Mono/oligoclonal T and NK cells are common in chronic myeloid leukemia patients at diagnosis and expand during dasatinib therapy. Blood. 2010;116(5):772–82. [DOI] [PubMed] [Google Scholar]
- 23.Loughran TP., Jr Clonal diseases of large granular lymphocytes. Blood. 1993;82(1):1–14. [PubMed] [Google Scholar]
- 24.Kim MS, Lee SH, Yoo NJ, Lee SH. STAT3 exon 21 mutation is rare in common human cancers. Acta Oncol. 2013;52(6):1221–2. [DOI] [PubMed] [Google Scholar]
- 25.Jerez A, Clemente MJ, Makishima H, Rajala H, Gomez-Segui I, Olson T, et al. STAT3-mutations indicate the presence of subclinical T cell clones in a subset of aplastic anemia and myelodysplastic syndrome patients. Blood. 2013;122(14):2453–9. [DOI] [PMC free article] [PubMed] [Google Scholar]
- 26.Siegel AM, Heimall J, Freeman AF, Hsu AP, Brittain E, Brenchley JM, et al. A critical role for STAT3 transcription factor signaling in the development and maintenance of human T cell memory. Immunity. 2011; 35(5):806–18. [DOI] [PMC free article] [PubMed] [Google Scholar]
- 27.Cui W, Liu Y, Weinstein JS, Craft J, Kaech SM. An interleukin-21-interleukin-10-STAT3 pathway is critical for functional maturation of memory CD8+ T cells. Immunity. 2011;35(5):792–805. [DOI] [PMC free article] [PubMed] [Google Scholar]
- 28.Clemente MJ, Wlodarski MW, Makishima H, Viny AD, Bretschneider I, Shaik M, et al. Clonal drift demonstrates unexpected dynamics of the T-cell repertoire in T-large granular lymphocyte leukemia. Blood. 2011;118(16):4384–93. [DOI] [PMC free article] [PubMed] [Google Scholar]
- 29.Andersson EI, Rajala HL, Eldfors S, Ellonen P, Olson T, Jerez A, et al. Novel somatic mutations in large granular lymphocytic leukemia affecting the STAT-pathway and T-cell activation. Blood Cancer J. 2013;3:e168. [DOI] [PMC free article] [PubMed] [Google Scholar]
- 30.Bedoya-Reina OC, Ratan A, Burhans R, Kim HL, Giardine B, Riemer C, et al. Galaxy tools to study genome diversity. Gigascience. 2013;2(1):17. [DOI] [PMC free article] [PubMed] [Google Scholar]
- 31.Teramo A, Gattazzo C, Passeri F, Lico A, Tasca G, Cabrelle A, et al. Intrinsic and extrinsic mechanisms contribute to maintain the JAK/STAT pathway aberrantly activated in T-type large granular lymphocyte leukemia. Blood. 2013;121(19):3843–54. [DOI] [PubMed] [Google Scholar]
- 32.Bockorny B, Dasanu CA. Autoimmune manifestations in large granular lymphocyte leukemia. Clin Lymphoma Myeloma Leuk. 2012;12(6):400–5. [DOI] [PubMed] [Google Scholar]
- 33.Lamy T, Loughran TP. Large granular lymphocyte leukemia. Cancer Control. 1998; 5(1):25–33. [DOI] [PubMed] [Google Scholar]
- 34.Wlodarski MW, O’Keefe C, Howe EC, Risitano AM, Rodriguez A, Warshawsky I, et al. Pathologic clonal cytotoxic T-cell responses: nonrandom nature of the T-cell-receptor restriction in large granular lymphocyte leukemia. Blood. 2005;106(8):2769–80. [DOI] [PubMed] [Google Scholar]
- 35.Sandberg Y, Kallemeijn MJ, Dik WA, Tielemans D, Wolvers-Tettero IL, van Gastel-Mol EJ, et al. Lack of common TCRA and TCRB clonotypes in CD8(+)/TCRalphabeta(+) T-cell large granular lymphocyte leukemia: a review on the role of antigenic selection in the immunopathogenesis of CD8(+) T-LGL. Blood Cancer J. 2014;4:e172. [DOI] [PMC free article] [PubMed] [Google Scholar]
- 36.Clemente MJ, Przychodzen B, Jerez A, Dienes BE, Afable MG, Husseinzadeh H, et al. Deep sequencing of the T-cell receptor repertoire in CD8+ T-large granular lymphocyte leukemia identifies signature landscapes. Blood. 2013;122(25):4077–85. [DOI] [PMC free article] [PubMed] [Google Scholar]
- 37.Bourcier KD, Lim DG, Ding YH, Smith KJ, Wucherpfennig K, Hafler DA. Conserved CDR3 regions in T-cell receptor (TCR) CD8(+) T cells that recognize the Tax11-19/HLA-A*0201 complex in a subject infected with human T-cell leukemia virus type 1: relationship of T-cell fine specificity and major histocompatibility complex/peptide/TCR crystal structure. J Virol. 2001;75(20):9836–43. [DOI] [PMC free article] [PubMed] [Google Scholar]
- 38.Matsumoto I, Tsubota K, Satake Y, Kita Y, Matsumura R, Murata H, et al. Common T cell receptor clonotype in lacrimal glands and labial salivary glands from patients with Sjogren’s syndrome. J Clin Invest. 1996;97(8):1969–77. [DOI] [PMC free article] [PubMed] [Google Scholar]
- 39.Moignet A, Hasanali Z, Zambello R, Pavan L, Bareau B, Tournilhac O, et al. Cyclophosphamide as a first-line therapy in LGL leukemia. Leukemia. 2014;28(5):1134–6. [DOI] [PMC free article] [PubMed] [Google Scholar]