

Abstract
Immune reconstitution after allogeneic stem cell transplantation is a dynamic and complex process depending on the recipient and donor characteristics, on the modalities of transplantation, and on the occurrence of graft-versus-host disease. Multivariate methods widely used for gene expression profiling can simultaneously analyze the patterns of a great number of biological variables on a heterogeneous set of patients. Here we use these methods on flow cytometry assessment of up to 25 lymphocyte populations to analyze the global pattern of long-term immune reconstitution after transplantation. Immune patterns were most distinct from healthy controls at six months, and had not yet fully recovered as long as two years after transplant. The two principal determinants of variability were linked to the balance of B and CD8+ T cells and of natural killer and B cells, respectively. Recipient’s cytomegalovirus serostatus, cytomegalovirus replication, and chronic graft-versus-host disease were the main factors shaping the immune pattern one year after transplant. We identified a complex signature of under- and over-representation of immune populations dictated by recipient’s cytomegalovirus seropositivity. Finally, we identified dimensions of variance in immune patterns as significant predictors of long-term non-relapse mortality, independently of chronic graft-versus-host disease.
Introduction
Restoration of quantitatively and functionally normal immunity is mandatory to limit infectious risks and relapse after allogeneic hematopoietic stem cell transplantation (HSCT).1 The kinetics of reconstitution of innate and adaptive immune populations differ. The prompt recovery of neutrophil, monocyte and natural killer (NK) cells contrasts with delayed recovery of B- and T-cell subsets that can persist beyond the first year after transplantation.2,3
Several studies have pinpointed the role of transplant characteristics, including conditioning regimen intensity, source of stem cells and donor matching,4–7 and that of post-transplant events including acute (aGvHD) and chronic (cGvHD) graft-versus-host disease and infections such as cytomegalovirus (CMV) replication on post-transplant immune reconstitution.8–10
Other studies have focused on the study of a distinct subset of immune cells, e.g. regulatory T cells (Tregs), CD5+ B cells, or NK cells.11–13 However, complex and heterogeneous clinical settings such as cGvHD often simultaneously affect several immune cell populations.3
While molecular biology8 and functional assays14 can be used to study immune reconstitution, flow cytometry uniquely allows the simultaneous assessment of several immune populations.9
Multivariate methods such as clustering algorithms, and principal component analyses are widely used to analyze multidimensional data such as gene expression profiles, but these methods have also been successfully applied to other types of data, such as clinical symptoms and murine hematopoietic reconstitution.15,16
In the present study, we use these tools to analyze simultaneously the impact of several pre- and post-transplant variables on the immune reconstitution of a large number of immune cell populations. Our results confirm that patterns of immune populations remain abnormal even two years after transplant, and uncover the crucial and independent role of CMV serostatus and of CMV replication, and to a lesser extent of cGvHD, in shaping long-term immune reconstitution following allogeneic HSCT.
Methods
Patients
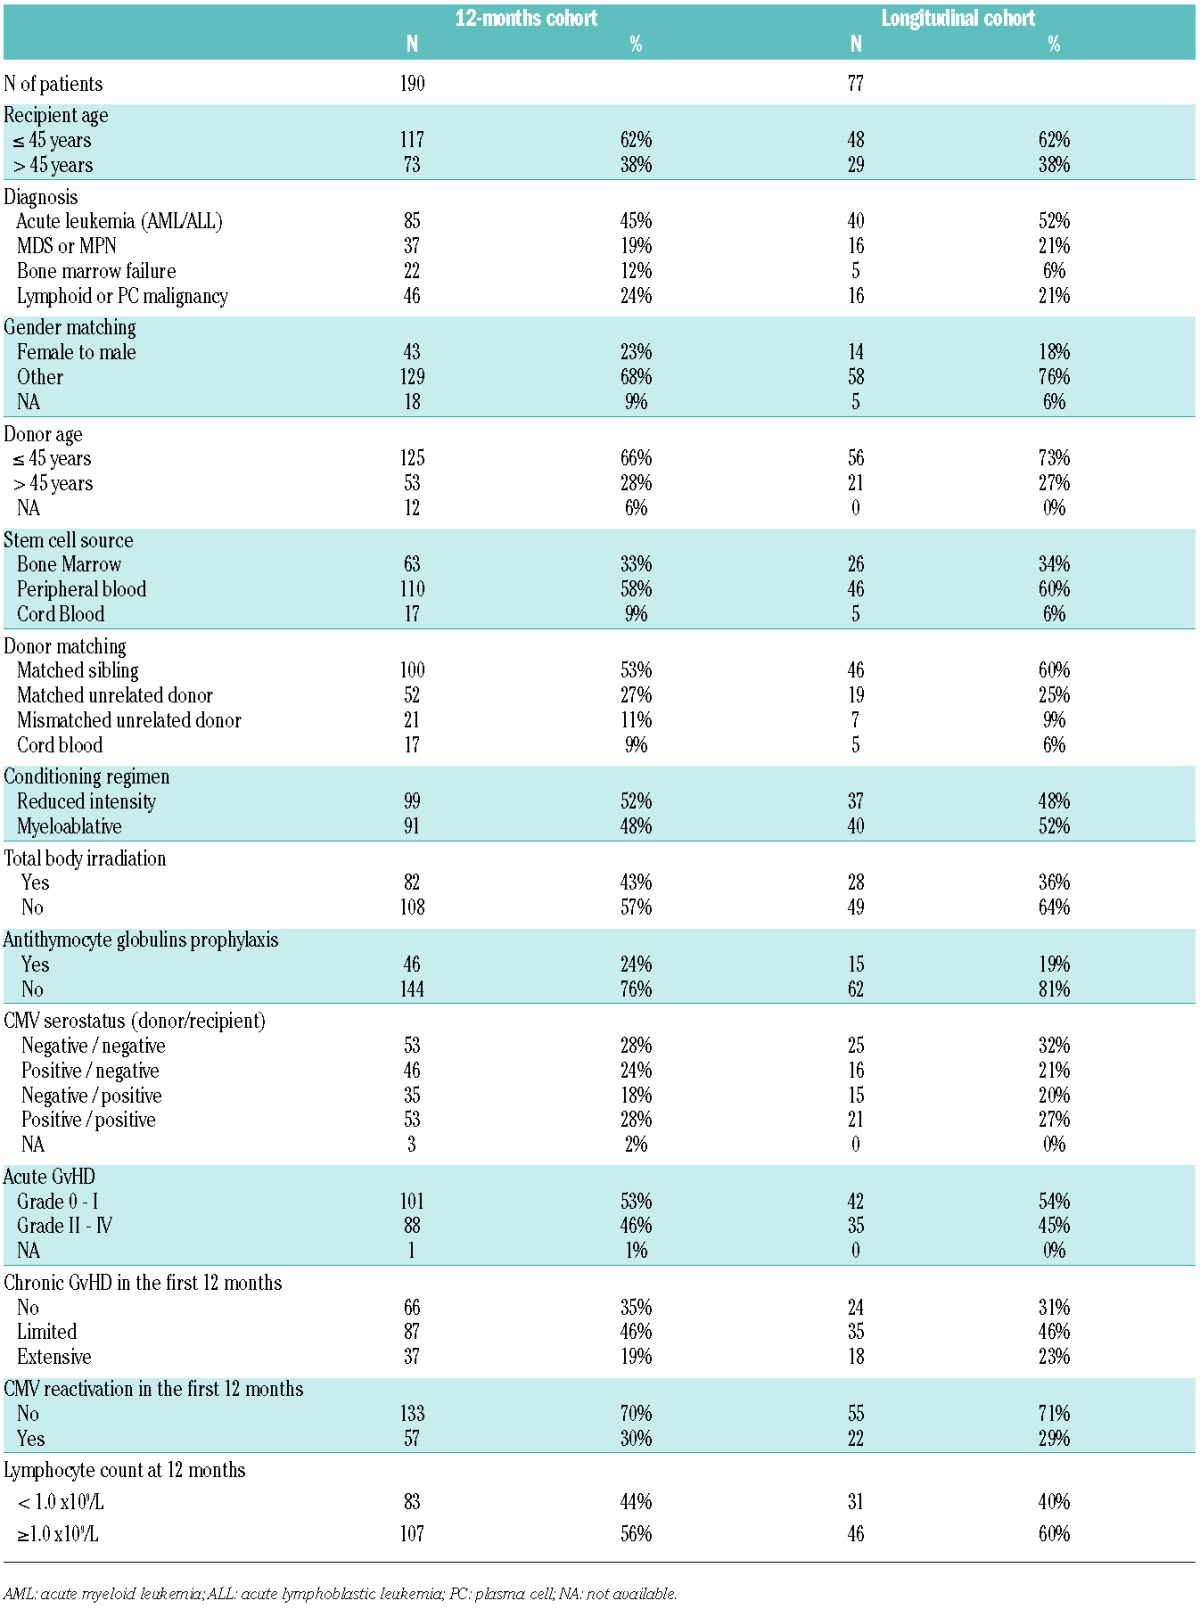
Immune reconstitution was monitored as part of routine follow up in all 410 patients undergoing allogeneic stem cell transplantation at our center between June 2005 and November 2009. Blood samples were collected prior to transplant and at three, six, 12 and 24 months after transplant.3,6,12 All patients provided written informed consent in accordance with the Declaration of Helsinki. The present study focuses on patients with immune reconstitution profiling available at twelve months from transplant, regardless of indication, conditioning regimen, and stem cell source of HSCT; 190 patients met these criteria. Kinetics of reconstitution was studied in a smaller cohort of 77 patients with data at all other study points. Characteristics of both cohorts are shown in Table 1. Definition of clinical variables, including conditioning regimen intensity, GvHD grading and CMV replication, is described in the Online Supplementary Methods.
Table 1.
Patient characteristics.
Controls
Blood samples from 32 healthy donors were collected after informed consent from the local blood donor center (Hôpital Saint-Louis, Paris, France).
Flow cytometry
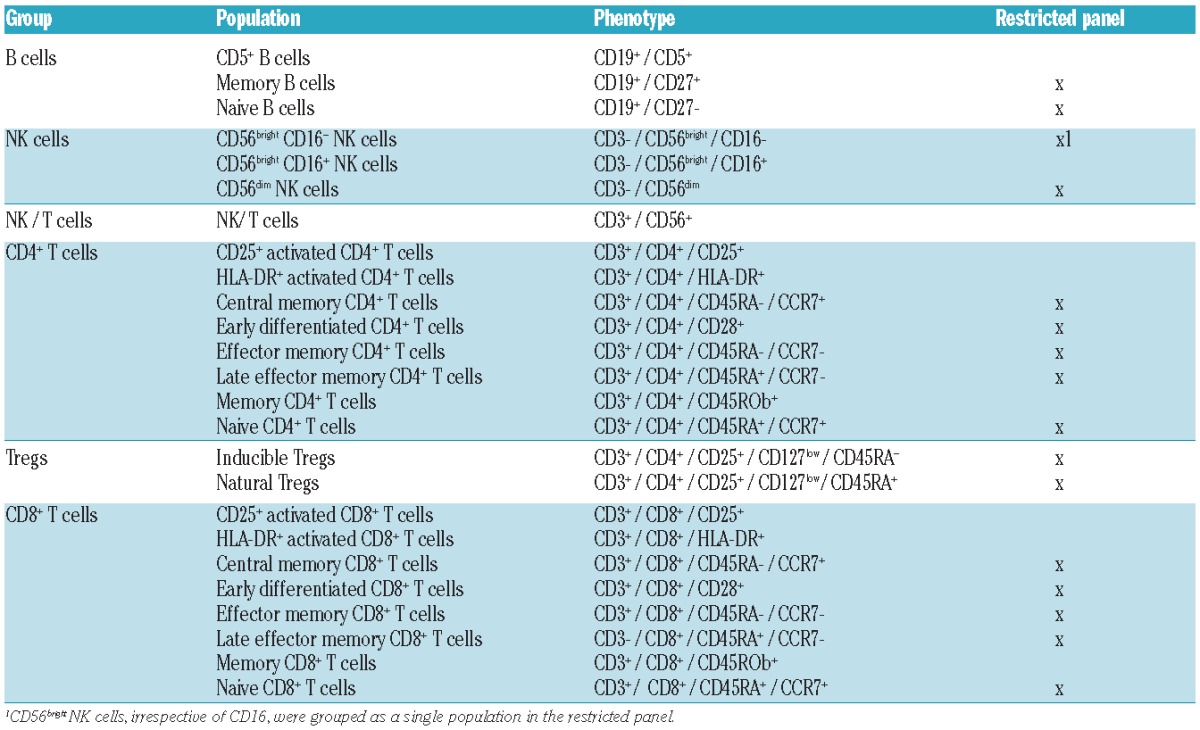
Flow cytometry analysis is detailed in Online Supplementary Methods. Lymphocyte populations are summarized in Table 2. Only the restricted panel was assessed in the control samples, whereas the extended panel was used for patient samples.
Table 2.
Immune subsets.
Statistical analysis
Statistical analyses are detailed in the Online Supplementary Methods. All lymphocyte subsets were studied as proportions of the patient’s total lymphocyte count at the time of sampling.
Multivariate analysis was performed by correspondence analysis (CA), which is conceptually analogous to principal component analysis.17
Similarity between patients’ and controls’ datasets was evaluated with the ‘RV’ coefficient, which measures the relationship of two sets of variables defined for the same individuals.18
One-way analysis of variance according to categorical variables was performed with the Kruskall-Wallis test. When two variables were each significantly impacting a single dimension, two-way analysis of variance (ANOVA) accounting for interaction were performed.
Non-relapse mortality (NRM) and cumulative incidence of relapse (CIR) were defined with a landmark at 12 months considering relapse and death as competing events. Fine & Gray models were established after limited backward selection.19 All analyses were carried with R 3.0.2 (www.cran.r-project.org).
Results
Kinetics of global patterns of immune reconstitution
In order to analyze the kinetics of global immune reconstitution, we first selected a subset of 77 patients (median age 40 years) for whom immune profiling had been performed prior to transplant and at three, six, 12 and 24 months after transplant. (See Table 1 for patients’ characteristics.) There was no significant difference in base-line characteristics between this longitudinal cohort and the global population of 410 patients transplanted at our center over the same period (Online Supplementary Table S1). The proportion of 16 lymphocyte subpopulations (‘restricted panel’, Table 2) at each time point in those 77 patients was compared to that of 32 healthy controls (median age 43 years; P=0.11 vs. patients) through correspondence analysis (CA). The two populations were comparable with respect to CMV seropositivity (47% in both groups; P=1.0). CA is a method analogous to principal component analysis that allows the visualization of multidimensional categorical data (Figure 1A). Briefly, CA generates new variables for each patient, called ‘dimensions’, that combine and summarize the information contained in the many variables assessed (here, lymphocyte subsets). The resulting dimensions are hierarchically organized, with the first dimension carrying the greater amount of information (percentage of variance). These first dimensions thus fairly reflect the heterogeneity of patients with respect to immune populations, with limited loss of information: in the present analysis, the 3-dimensional depiction of the first three dimensions (DIM1, DIM2, and DIM3) captured a significant proportion of the panel’s variability (cumulative proportion of variance 66.5%). Consequently, the distance between 2 patients in the first dimensions of CA reflects the global similarity of their immune profile. Whereas the pattern of immune populations in patients seemed close to that of healthy controls prior to transplant, this pattern became more heterogeneous and distant from controls, especially at six and 12 months from transplant. We next used ‘RV’ coefficients, which range from 0 (complete decorrelation) to 1 (complete correlation) to analyze the similarity between immune profiles of patients and controls.18 Immune profiles of patients were significantly different from controls at all times, including prior to transplant (−log10 (P) >2, i.e. P<0.01 in all instances). However, the similarity was close to 90% (RV coefficient=0.907) prior to transplant then decreased to reach a nadir close to 50% six months after transplant, before beginning to become close to normal. Immune populations were still overall significantly different from controls at two years after transplant (Figure 1B).
Figure 1.
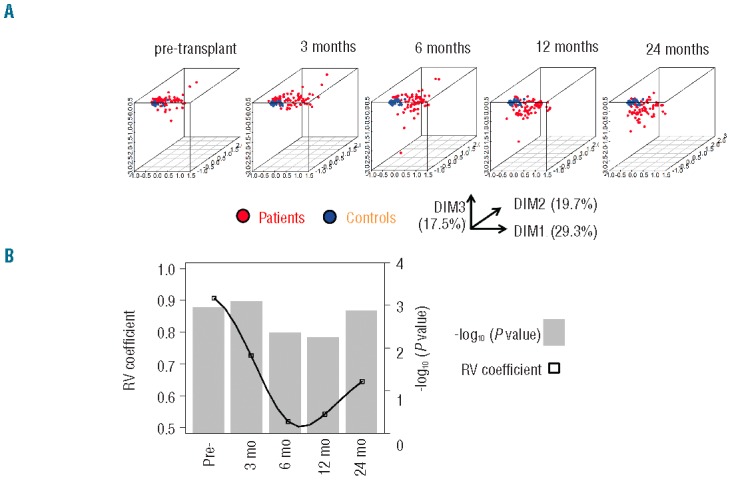
A. Plots of the first 3 dimensions (DIM) from the correspondence analysis (CA)17 of immune pattern, determined on a restricted panel of 16 lymphocyte subsets (see Table 2) in 77 patients with longitudinal follow up prior to transplant, and after three, six, 12 and 24 months from transplant (red dots) compared to the immune pattern of 32 healthy controls (blue dots). Percentages indicate the proportion of variance attributed to each dimension. Briefly, CA, like principal component analysis, allows the graphical representation of multidimensional data by generating ‘dimensions’ that reflect the similarity between rows (patients) and columns (immune populations) without losing information. The resulting dimensions are hierarchically organized, with the first dimension carrying the greater amount of information (percentage of variance). The distance between 2 patients in the first dimensions of CA reflects the global similarity of their immune profile. Conversely, immune populations distant on CA dimensions have opposite representations in the patient population. (B) Similarity estimated through RV coefficients18 between immune patterns of controls and transplant recipients at the same time points. RV coefficients (black squares) closer to 1 denote greater similarity between immune patterns of patients and controls. Log-transformed P values of the test of significance are indicated in gray bars.
Clustering of immune populations
We next focused on the 190 patients alive at twelve months after transplant with available information on 25 lymphocyte subsets, including naïve, activated and memory CD4+ and CD8+ T cells, resting and activated regulatory T cells (Tregs), CD56dim and CD56bright NK cells, and naïve, and memory B cells (‘extended panel’, Table 2). The relative proportion of each immune subset is plotted in Online Supplementary Figure S1. Although this cohort represents a selected patient population having survived the first year after HSCT, there was no additional inclusion criterion, and the resulting cohort is thus heterogeneous in terms of indication for HSCT, source of stem cells, conditioning regimen and donor matching, as summarized in Table 1. Comparison with the global transplant population is provided in Online Supplementary Table S1. There was no significant difference, except for a greater proportion of CMV seronegative recipients in the 12-month study population (P=0.02). We performed CA on this global dataset. The first 5 dimensions accounted for a cumulative 75.5% of the total variance of the dataset [dimension (DIM) 1: 33.2%; DIM2: 15.5%]. Dimensions resulting from CA display the similarity between patients (‘rows’ in our dataset), but can also be used to analyze the similarity between immune populations (‘columns’) across the patient populations. We performed a supervised ‘between-group’ clustering of immune populations, which uncovered the distinct reconstitution of B and NK cell populations, and to a lesser extent of CD4+ and CD8+ T-cell subsets. Expectedly, Tregs were closer to CD4+ T cells (Figure 2). We also performed unsupervised clustering analysis on the resulting dataset. This analysis uncovered 6 statistically significant clusters (P<0.05 by approximately unbiased tests) (Online Supplementary Figure S2): B-cell subpopulations (naïve, memory and CD5+ B cells) formed a cluster, as did NK-cell subpopulations. As further validation, naïve (CD45RA+ / CCR7+) and ‘early differentiated’ (CD28+) CD8+ T cells were found to significantly cluster. Interestingly, within the CD8+ T-cell compartment, HLA-DR+ activated cells clustered with ‘late effector memory’ (CD45RA+ / CCR7−) cells, whereas activated T cells characterized by CD25 expression instead clustered with ‘central memory’ (CD45RA− / CCR7+) cells. Of note, such distinct clustering of CD25+ and HLA-DR+ activated CD8+ T cells was also noted in patients studied at six months after transplant (data not shown).
Figure 2.
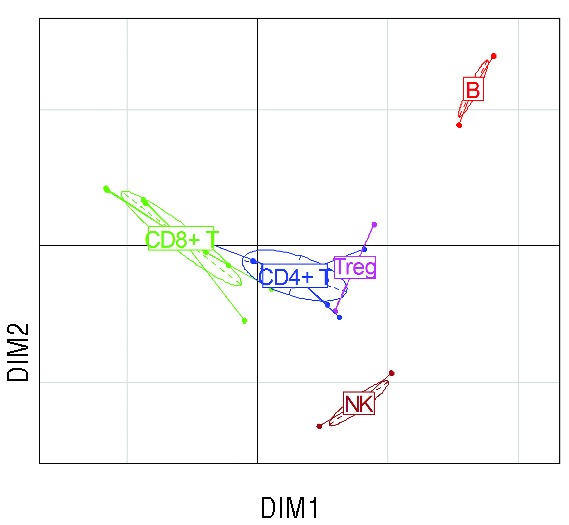
Supervised clustering of the 25 immune populations in 190 patients at 12 months from transplant. Ellipses denote centroids of clusters of immune populations. DIM1 and DIM2 are the first two dimensions of correspondence analysis.
Clinical determinants of immune reconstitution patterns
To determine which are the pre-transplant characteristics and post-transplant clinical events that have the greatest influence on the pattern of immune reconstitution, we performed non-parametric analysis of variance (Kruskall-Wallis) between each clinical variable and each of the first five dimensions of correspondence analysis. The pre-transplant variables included disease category, recipient and donor age, gender matching, donor matching, and source of stem cells, conditioning regimen intensity, total body irradiation (TBI) as part of the conditioning, antithymocyte globulin (ATG) as part of GvHD prophylaxis, and donor/recipient CMV serostatus. We also analyzed the impact of clinical events that occurred in the first 12 months after transplantation, including grade II-IV acute GvHD, chronic GvHD (limited or extensive), and CMV replication. Relapse in the first year of transplant occurred in only 10 (5%) patients and was thus too infrequent to be analyzed. Lymphopenia (<1.0×10⁹/L) at the time of immunophenotyping, a potential confounder, was also included in this analysis. All these parameters were analyzed as ordinal variables, using stratifications from Table 1. CMV serostatus was considered as an ordinal variable in the following order: Donor[D]−/Recipient[R]−, D+/R−, D+/R+, D−/R+. After correcting for multiple testing, few clinical variables were found to significantly affect the principal dimensions of immune patterns’ heterogeneity.
Most notably, both CMV serostatus prior to transplant, and CMV replication after transplant, strongly (both P<10−6) affected the 1st dimension of variance. Lymphopenia, and to a lesser extent chronic GvHD affected the 2nd dimension, whereas the source of stem cells and ATG only had weak influences (adjusted P=0.020 and P=0.014, respectively) on dimension 5, which accounts for only 6.2% of the total variance of immune profiles. In particular, donor or recipient age gender matching conditioning intensity, TBI, donor matching, or antecedent acute GvHD did not affect the global pattern of immune reconstitution (Figure 3). Of note, comparable results were found in an analysis carried on 223 patients analyzed six months after transplant (data not shown), or when analyzing absolute instead of relative lymphocyte population counts (Online Supplementary Figure S3). Importantly, because dimensions in correspondence analysis are orthogonal (i.e. they carry independent information), these results also indicate that CMV status and chronic GvHD independently shape the pattern of immune reconstitution after transplantation. We performed two-way ANOVA to dissect the impact of each variable significantly determining DIM1 and DIM2. We found the impact of cGvHD on DIM2 to remain significant (P=0.004), independently of lymphopenia. A similar analysis showed the predominant role of CMV serostatus (P<10−12) over CMV replication (P<10−4) on the principal dimension of variance DIM1, with significant interaction between both explanatory variables (P=0.04) (Online Supplementary Table S3). Of note, the number of CMV replication episodes was linearly associated with DIM1 (R2=0.27; P<0.0001) (Online Supplementary Figure S4).
Figure 3.
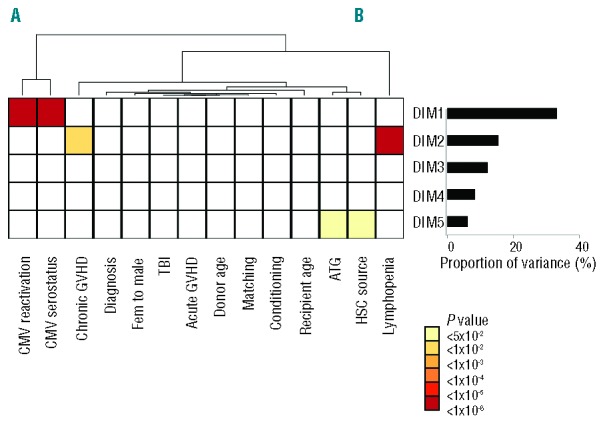
Matrix of log-transformed P values of Kruskall-Wallis tests for one-way analysis of variance between each of the first five dimensions from the correspondence analysis of immune pattern of 190 patients at 12 months from transplant, and the following variables, categorized as shown in Table 1: recipient age, disease category, gender matching, donor age, hematopoietic stem cell (HSC) source, conditioning regimen, CMV serostatus, acute GvHD, chronic GvHD and CMV reactivation in the first 12 months, lymphocyte counts at 12 months from transplant. The variables are ordered according to a dendrogram resulting from unsupervised clustering of explanatory variables. The proportion of variance contributed by each dimension is provided in the adjacent histogram.
Reconstitution pattern in recipients seropositive for CMV
We next focused on the different balance of immune populations according to CMV serostatus because this variable was the strongest determinant of the principal dimension of variance in the previous analysis. We first sought to determine which groups of donor/recipient serostatus are associated to greater variability of immune profiles. To do so, we compared in the principal dimension of variance (DIM1) various ways to dichotomize patients according to Donor/Recipient (D/R) CMV serostatus. The χ2 value was 33.87 for D−/R− versus all other D/R statuses, compared to 8.96 for donor seropositivity and 59.47 for recipient CMV seropositivity. Therefore, recipient seropositivity for CMV seemed the best way to dichotomize patients on the basis of principal dimension of variance of immune reconstitution patterns (Kruskall-Wallis P<10−13). This was also apparent on the correspondence plot (Figure 4A and Online Supplementary Figure S5). We performed two different approaches to uncover the differences of twelve-month reconstitution patterns in recipients seropositive and seronegative for CMV. First, we plotted the heatmap of immune populations according to recipient CMV serostatus (Figure 4B) revealing complex differences in the immune patterns of recipients according to their CMV serostatus. The most apparent changes were increased proportions of HLA-DR+ activated and of late effector memory CD8+ T cells, contrasting with decreased proportions of B-cell subsets in seropositive recipients. We next performed a volcano plot displaying fold changes in mean proportion of immune subsets according to recipient CMV serostatus, and the corresponding Student’s t-test P values (after adjusting for multiple comparison). This revealed that statistically significant changes [adjusted P<0.05, corresponding to −log (adjusted P) >1.23] in 14 of the 25 immune populations studied, with four being over-represented and ten underrepresented at 12 months after transplant. As previously noted, under-represented populations included B-cell subsets (naïve, memory, and CD5+ B cells), whereas over-represented subsets included HLA-DR+ activated CD8+ T cells and memory CD8+ T-cell populations. Of note, most of these statistically significant changes were of moderate magnitude, with fold changes inferior to 1 (in absolute value), corresponding to less than doubling or fewer than halving of the mean proportion of the immune cells in the corresponding compartment (Figure 4C). The dominant role of the balance between B-cell and CD8+ T-cell subsets dictated by CMV serostatus is in keeping with the results of the previous between-group analysis, showing that B cells and CD8+ T cells are on opposite poles on the principal dimension of variance of immune patterns (Figure 2).
Figure 4.
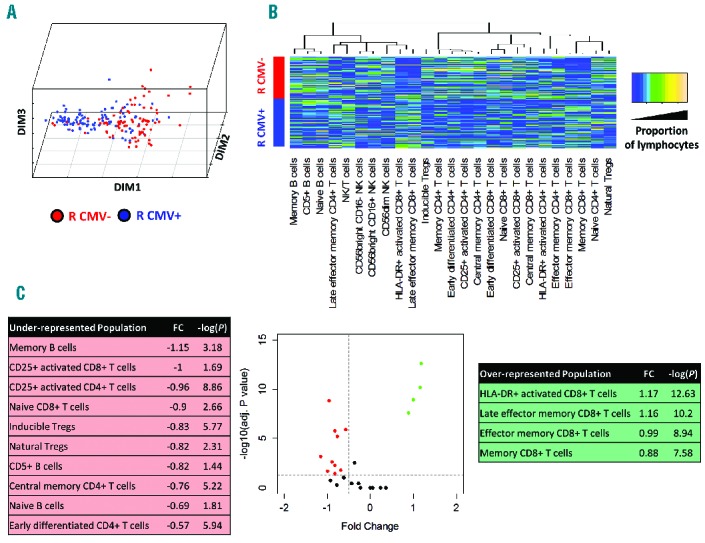
(A) Plots of the first 3 dimensions (DIM1–3) from the correspondence analysis of immune pattern, determined on a panel of 25 lymphocyte subsets (see Table 2) in 190 patients with 12 months after transplant, according to recipient’s CMV serostatus (negative: red dots; positive: blue dots). (B) Heatmap of immune subset proportions (after quantile normalization) according to recipient CMV serostatus (blue: lower proportion; orange: higher proportion; dendrogram: unsupervised clustering of populations). (C) Volcano plot for immune subsets according to recipient CMV serostatus, representing fold changes in the proportion of immune subsets in CMV seropositive recipients compared to seronegative recipients, and the log-transformed P value of corresponding Kruskall-Wallis tests.
Outcome according to immune patterns revealed by correspondence analysis
We finally sought to determine whether the global pattern of immune population, as captured by the principal dimensions resulting from CA, can determine the long-term outcome of patients. We thus studied the prognostic impact of DIM1 and DIM2, the first two dimensions of variance in our previous CA, on non-relapse mortality (NRM) and, with a landmark at twelve months after transplant, (corresponding to the timing of immune reconstitution assessment in our cohort of 190 patients) (Table 1). Median follow up after landmark was 52 months. There were 41 deaths and 33 relapses after landmark. Principal cause of death was relapse in 20 cases, GvHD in 15 cases, infection in one case, and other causes in the 5 remaining cases (including one case of multi-organ failure and one case of respiratory failure, possibly related to undocumented infections, and suicide in the remaining 2 cases). At 24 months from landmark (36 from transplant), NRM was 9.1% (95% Confidence Interval [CI]: 5.0%–13.2%) and CIR was 13.2% (95%CI: 8.4%–18.1%). In univariate analysis, neither DIM1 nor DIM2 (as continuous variable) had significant impact on Cumulative Incidence of Relase (CIR; P=0.66 and P=0.72, respectively). The corresponding CIRs are displayed in Figure 5A and B, with a cut off at median value of DIM1 or DIM2, for the convenience of graphical display. Conversely, higher DIM1 and higher DIM2 values were significantly associated with lower NRM (P=0.003 and P<0.0001, respectively) in univariate analysis (Fine & Gray model) (Table 3 and Figure 5C and D). Among clinical variables, female-to-male sex mismatch (P=0.016), antecedent grade II-IV aGvHD (P=0.005), cGvHD in the first twelve months (P=0.0001), and lymphocyte count less than 1×10⁹/L at twelve months (P=0.006) were also significantly associated to higher rates of NRM in univariate analysis, whereas recipient and donor age, diagnosis, stem cell source, donor matching, conditioning regimen, CMV serostatus or replication had no significant impact. In multivariate analysis, after backward regression, DIM2 and chronic GvHD were found to be the only variables with significant and independent impact on NRM (Table 3).
Figure 5.
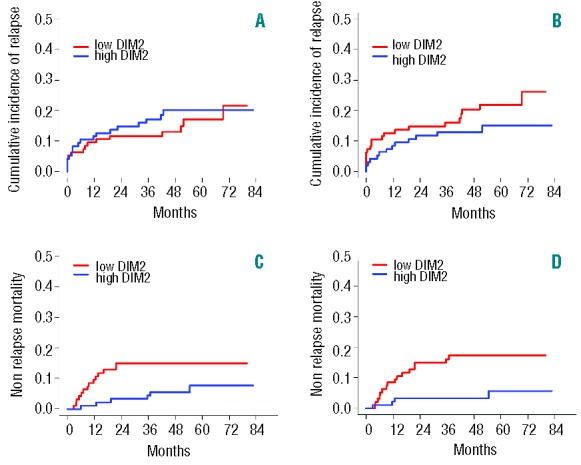
Cumulative incidence of relapse or progression (A and B), and non-relapse mortality (C and D) with a landmark at twelve months after transplant, in the 190 patients dichotomized according to median values of DIM1 (A and C) or DIM2 (B and D). Univariate and multivariate analyses were carried considering DIM1 and DIM2 as continuous variables.
Table 3.
Prognostic factors of non-relapse mortality.
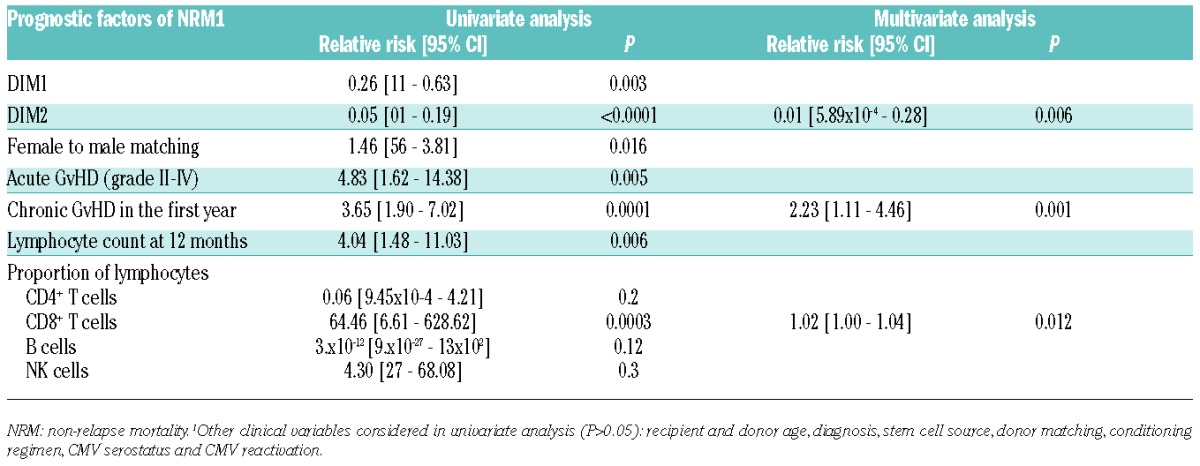
DIM2 integrates information on the proportion of all 25 immune subsets, but particularly reflects the balance of B and NK cells, which are on opposite poles of this axis (Figure 2). Thus, higher DIM2 values, corresponding to higher proportion of NK cells and lower proportion of B cells, have a significant detrimental influence on late NRM. In univariate analysis, a higher proportion of CD8+ T cells was also significantly associated to higher NRM (P=0.0003), whereas neither the proportion of B cells nor that of NK cells had any significant impact. Adding the CD8+ T-cell proportion to the previous multivariate model did not modify the significant role of DIM2 as a prognostic factor for NRM (P=0.006) (Table 3).
Discussion
Immune reconstitution after allogeneic stem cell transplantation is a dynamic and complex process. We3 and others7,20–33 have reported a delayed recovery of the immune system post allogeneic HSCT mostly influenced by age and GvHD. Determination of lymphocyte population numbers through flow cytometry provides robust information on immune reconstitution after transplant. Most studies have focused on the role of a given lymphocyte subpopulation, or of a precise modality of transplantation. Multivariate methods, such as those widely used for gene expression profiling, can simultaneously analyze the patterns of a great number of biological variables on a heterogeneous set of patients. Here we use correspondence analysis to analyze the global pattern of long-term immune reconstitution.
The kinetics of global immune reconstitution was first studied sequentially until two years. The profile of 16 lymphocyte subpopulations as compared to healthy controls was significantly abnormal at all times, including before transplant, possibly because of underlying malignancy and previous treatments, and reached a nadir six months after transplant, before beginning to become near to normal. However, immune populations were still overall significantly different from controls at two years after transplant. The global view we provide of such an evolution is in keeping with previous findings focusing on defined immune subsets.3,7,20–33 We next focused on patients alive at one year and analyzed global immune reconstitution of 25 lymphocyte subsets, and performed a correspondence analysis on this global dataset. This late time point was chosen to allow sufficient lymphocyte count recovery and significant cumulative incidence of cGvHD for analysis. Both study populations were defined on the basis of prolonged survival and thus include selected patients. However, their base-line characteristics were comparable to that of the global population transplanted at our center during the same period, except for an over-representation of CMV seronegative recipients, which is in keeping with the role of CMV replication on NRM after HSCT.34 The first 5 dimensions accounted for two-thirds of the total variance of the dataset. Analyses uncovered the distinct reconstitution of B− and NK-cell populations, and to a lesser extent of CD4+ and CD8+ T-cell subsets. Tregs were closer to CD4+ and CD8+ T cells. Within the CD8+ DR+ T-cell clustered with late effector memory, whereas CD8+ CD25+ T cells clustered with central memory cells.
To determine which factors influence the pattern of immune reconstitution we performed non-parametric analysis of variance. Both CMV serostatus, and CMV replication strongly (P<10−6) affected the 1st (and thus main) dimension of variance. Lymphopenia, and to a lesser extent chronic GvHD, affected the 2nd dimension, whereas the source of stem cells and use of ATG had a weak influence accounting for less than 10% of the total variance of immune profiles. Though older age as a dichotomic variable did not impact immune patterns, further analysis of the complex relationship between donor and recipient age and immune recovery is required. Heatmapping of immune populations according to recipient CMV serostatus revealed complex differences in the immune patterns of recipients according to their CMV serostatus. The most apparent changes were increased proportions of HLA-DR+ activated and of late effector memory CD8+ T cells, contrasting with decreased proportions of B-cell subsets in seropositive recipients. This likely reflects the expansion of absolute numbers of activated and memory T cells after CMV reactivation (see Lugthart et al.35; other data not shown). The redistribution of T-cell phenotypes from naïve predominant to memory-enriched after CMV infection occurs rapidly.36 Viral latency drives inflation of memory cells, and is considered a hallmark of CMV infection.37 Numerous data have pinpointed the requirement for the host to maintain control of latent CMV infection throughout life.38 In the setting of HSCT, several studies have addressed the role of CMV on immune recovery.35,39–42 However, none of these have provided multivariate evidence of the dominant role of CMV in shaping immune reconstitution, compared to pre-transplant characteristics, and to occurrence of GvHD. Further studies on a larger set of healthy controls are required to compare this pattern to that associated to CMV seropositivity in immunocompetent hosts. Chronic GvHD was, as expected, the second major event to shape long-term immune reconstitution. Chronic GvHD has already been reported to influence B- and T-cell reconstitution3,8,9,20,21,43,44 but none of these studies provided a broad overview as allowed here by CA. It is interesting to note that CMV-specific memory T cells cross react with alloantigens45,46 and have long been suspected to be involved in the pathogenesis of GvHD through molecular mimicry. Finally, although ATG has been reported to influence early immune reconstitution,20,21,43,44 its role in influencing long-term reconstitution was weak in the present study, possibly because of the late time point considered.
Finally, we sought to determine whether the global pattern of immune population, as captured by the principal dimensions, can correlate with long-term outcome of these patients. In multivariate analysis, DIM2 and chronic GvHD were found to be the only variables with significant and independent impact on NRM. DIM2 partly reflects the balance between B- and NK-cell populations, but neither the proportion of B cells, nor that of NK cells did influence NRM in univariate analysis. This particular point suggests the interest of multivariate methods in capturing equilibriums between immune populations, by providing novel information not captured by the analysis of individual immune populations. Future studies are required to incorporate data on myeloid populations in such global profiling of immune reconstitution.47
In summary, multivariate methods such as correspondence analysis and unsupervized clustering provide useful tools to analyze immune reconstitution and point to the crucial role of CMV serostatus (and CMV replication), and chronic GvHD in shaping long-term immune reconstitution following allogeneic hematopoietic stem cell transplantation. Application of such tools to independent cohorts with different flow cytometry panels may help validate this approach and gain novel insights into immune recovery.
Footnotes
The online version of this article has a Supplementary Appendix.
Authorship and Disclosures
Information on authorship, contributions, and financial & other disclosures was provided by the authors and is available with the online version of this article at www.haematologica.org.
References
- 1.Mackall C, Fry T, Gress R, Peggs K, Storek J, Toubert A. Background to hematopoietic cell transplantation, including post transplant immune recovery. Bone Marrow Transplant. 2009;44(8):457–62. [DOI] [PubMed] [Google Scholar]
- 2.Storek J. Immunological reconstitution after hematopoietic cell transplantation - its relation to the contents of the graft. Expert Opin Biol Ther. 2008;8(5):583–97. [DOI] [PubMed] [Google Scholar]
- 3.Corre E, Carmagnat M, Busson M, de Latour RP, Robin M, Ribaud P, et al. Long-term immune deficiency after allogeneic stem cell transplantation: B-cell deficiency is associated with late infections. Haematologica. 2010;95(6):1025–9. [DOI] [PMC free article] [PubMed] [Google Scholar]
- 4.Jimenez M, Ercilla G, Martinez C. Immune reconstitution after allogeneic stem cell transplantation with reduced-intensity conditioning regimens. Leukemia. 2007; 21(8):1628–37. [DOI] [PubMed] [Google Scholar]
- 5.Komanduri KV, St John LS, de Lima M, McMannis J, Rosinski S, McNiece I, et al. Delayed immune reconstitution after cord blood transplantation is characterized by impaired thymopoiesis and late memory T-cell skewing. Blood. 2007;110(13):4543–51. [DOI] [PMC free article] [PubMed] [Google Scholar]
- 6.Servais S, Lengline E, Porcher R, Carmagnat M, Peffault de Latour R, Robin M, et al. Long-Term Immune Reconstitution and Infection Burden after Mismatched Hematopoietic Stem Cell Transplantation. Biol Blood Marrow Transplant. 2014; 20(4):507–17. [DOI] [PubMed] [Google Scholar]
- 7.Storek J, Dawson MA, Storer B, Stevens-Ayers T, Maloney DG, Marr KA, et al. Immune reconstitution after allogeneic marrow transplantation compared with blood stem cell transplantation. Blood. 2001;97(11):3380–9. [DOI] [PubMed] [Google Scholar]
- 8.Clave E, Busson M, Douay C, Peffault de Latour R, Berrou J, Rabian C, et al. Acute graft-versus-host disease transiently impairs thymic output in young patients after allogeneic hematopoietic stem cell transplantation. Blood. 2009;113(25):6477–84. [DOI] [PubMed] [Google Scholar]
- 9.Podgorny PJ, Liu Y, Dharmani-Khan P, Pratt LM, Jamani K, Luider J, et al. Immune Cell Subset Counts Associated with Graft-versus-Host Disease. Biol Blood Marrow Transplant. 2014;20(4):450–62. [DOI] [PubMed] [Google Scholar]
- 10.Jeljeli M, Guerin-El Khourouj V, Porcher R, Fahd M, Leveille S, Yakouben K, et al. Relationship between cytomegalovirus (CMV) reactivation, CMV-driven immunity, overall immune recovery and graft-versus-leukaemia effect in children. Br J Haematol. 2014;166:229–39. [DOI] [PubMed] [Google Scholar]
- 11.Dong S, Maiella S, Xhaard A, Pang Y, Wenandy L, Larghero J, et al. Multiparameter single-cell profiling of human CD4+FOXP3+ regulatory T-cell populations in homeostatic conditions and during graft-versus-host disease. Blood. 2013;122(10):1802–12. [DOI] [PubMed] [Google Scholar]
- 12.Moins-Teisserenc H, Busson M, Herda A, Apete S, Peffault de Latour R, Robin M, et al. CD19+CD5+ B cells and B1-like cells following allogeneic hematopoietic stem cell transplantation. Biol Blood Marrow Transplant. 2013;19(6):988–91. [DOI] [PubMed] [Google Scholar]
- 13.Nguyen S, Dhedin N, Vernant JP, Kuentz M, Al Jijakli A, Rouas-Freiss N, et al. NK-cell reconstitution after haploidentical hematopoietic stem-cell transplantations: immaturity of NK cells and inhibitory effect of NKG2A override GvL effect. Blood. 2005;105(10):4135–42. [DOI] [PubMed] [Google Scholar]
- 14.Barron MA, Gao D, Springer KL, Patterson JA, Brunvand MW, McSweeney PA, et al. Relationship of reconstituted adaptive and innate cytomegalovirus (CMV)-specific immune responses with CMV viremia in hematopoietic stem cell transplant recipients. Clin Infect Dis. 2009;49(12):1777–83. [DOI] [PubMed] [Google Scholar]
- 15.Geyer HL, Emanuel RM, Dueck AC, Kiladjian JJ, Xiao Z, Slot S, et al. Distinct clustering of symptomatic burden amongst myeloproliferative neoplasm patients: retrospective assessment in 1470 patients. Blood. 2014;123(24):3803–10. [DOI] [PMC free article] [PubMed] [Google Scholar]
- 16.Naik SH, Perie L, Swart E, Gerlach C, van Rooij N, de Boer RJ, et al. Diverse and heritable lineage imprinting of early haematopoietic progenitors. Nature. 2013;496(7444):229–32. [DOI] [PubMed] [Google Scholar]
- 17.Husson F, Le S, Pages J. Exploratory Multivariate Analysis by Example Using R. Boca Raton: Chapman & Hall/CRC, 2010. [Google Scholar]
- 18.Josse J, Pagès J, Husson F. Testing the significance of the RV coefficient. Comput Stat Data Anal. 2008;53(1):82–91. [Google Scholar]
- 19.Fine JP, Gray RJ. A Proportional Hazards Model for the Subdistribution of a Competing Risk. J Am Stat Assoc. 1999;94(446):496–509. [Google Scholar]
- 20.Small TN, Papadopoulos EB, Boulad F, Black P, Castro-Malaspina H, Childs BH, et al. Comparison of immune reconstitution after unrelated and related T-cell-depleted bone marrow transplantation: effect of patient age and donor leukocyte infusions. Blood. 1999;93(2):467–80. [PubMed] [Google Scholar]
- 21.Parkman R, Weinberg KI. Immunological reconstitution following bone marrow transplantation. Immunol Rev. 1997; 157:73–8. [DOI] [PubMed] [Google Scholar]
- 22.Abrahamsen IW, Somme S, Heldal D, Egeland T, Kvale D, Tjonnfjord GE. Immune reconstitution after allogeneic stem cell transplantation: the impact of stem cell source and graft-versus-host disease. Haematologica. 2005;90(1):86–93. [PubMed] [Google Scholar]
- 23.D’Sa S, Peggs K, Pizzey A, Verfuerth S, Thuraisundaram D, Watts M, et al. T- and B-cell immune reconstitution and clinical outcome in patients with multiple myeloma receiving T-cell-depleted, reduced-intensity allogeneic stem cell transplantation with an alemtuzumab-containing conditioning regimen followed by escalated donor lymphocyte infusions. Br J Haematol. 2003;123(2):309–22. [DOI] [PubMed] [Google Scholar]
- 24.Heining C, Spyridonidis A, Bernhardt E, Schulte-Monting J, Behringer D, Grullich C, et al. Lymphocyte reconstitution following allogeneic hematopoietic stem cell transplantation: a retrospective study including 148 patients. Bone Marrow Transplant. 2007;39(10):613–22. [DOI] [PubMed] [Google Scholar]
- 25.Maris M, Boeckh M, Storer B, Dawson M, White K, Keng M, et al. Immunologic recovery after hematopoietic cell transplantation with nonmyeloablative conditioning. Exp Hematol. 2003;31(10):941–52. [DOI] [PubMed] [Google Scholar]
- 26.Sanchez-Garcia J, Serrano J, Gomez P, Martinez F, Martin C, Roman-Gomez J, et al. The impact of acute and chronic graft-versus-host disease on normal and malignant B-lymphoid precursors after allogeneic stem cell transplantation for B-lineage acute lymphoblastic leukemia. Haematologica. 2006;91(3):340–7. [PubMed] [Google Scholar]
- 27.Storek J, Ferrara S, Ku N, Giorgi JV, Champlin RE, Saxon A. B cell reconstitution after human bone marrow transplantation: recapitulation of ontogeny? Bone Marrow Transplant. 1993;12(4):387–98. [PubMed] [Google Scholar]
- 28.Storek J, Gooley T, Witherspoon RP, Sullivan KM, Storb R. Infectious morbidity in long-term survivors of allogeneic marrow transplantation is associated with low CD4 T cell counts. Am J Hematol. 1997;54(2):131–8. [DOI] [PubMed] [Google Scholar]
- 29.Storek J, Saxon A. Reconstitution of B cell immunity following bone marrow transplantation. Bone Marrow Transplant. 1992;9(6):395–408. [PubMed] [Google Scholar]
- 30.Storek J, Joseph A, Espino G, Dawson MA, Douek DC, Sullivan KM, et al. Immunity of patients surviving 20 to 30 years after allogeneic or syngeneic bone marrow transplantation. Blood. 2001;98(13):3505–12. [DOI] [PubMed] [Google Scholar]
- 31.Storek J, Wells D, Dawson MA, Storer B, Maloney DG. Factors influencing B lymphopoiesis after allogeneic hematopoietic cell transplantation. Blood. 2001;98(2):489–91. [DOI] [PubMed] [Google Scholar]
- 32.Storek J, Witherspoon RP, Storb R. T cell reconstitution after bone marrow transplantation into adult patients does not resemble T cell development in early life. Bone Marrow Transplant. 1995;16(3):413–25. [PubMed] [Google Scholar]
- 33.Tayebi H, Kuttler F, Saas P, Lienard A, Petracca B, Lapierre V, et al. Effect of granulocyte colony-stimulating factor mobilization on phenotypical and functional properties of immune cells. Exp Hematol. 2001;29(4):458–70. [DOI] [PubMed] [Google Scholar]
- 34.Schmidt-Hieber M, Labopin M, Beelen D, Volin L, Ehninger G, Finke J, et al. CMV serostatus still has an important prognostic impact in de novo acute leukemia patients after allogeneic stem cell transplantation: a report from the Acute Leukemia Working Party of EBMT. Blood. 2013;122(19):3359–64. [DOI] [PubMed] [Google Scholar]
- 35.Lugthart G, van Ostaijen-Ten Dam MM, Jol-van der Zijde CM, van Holten TC, Kester MG, Heemskerk MH, et al. Early cytomegalovirus reactivation leaves a specific and dynamic imprint on the reconstituting T cell compartment long-term after hematopoietic stem cell transplantation. Biol Blood Marrow Transplant. 2014; 20(5):655–61. [DOI] [PubMed] [Google Scholar]
- 36.Pawelec G. T-cell immunity in the aging human. Haematologica. 2014;99(5):795–7. [DOI] [PMC free article] [PubMed] [Google Scholar]
- 37.Seckert CK, Griessl M, Buttner JK, Scheller S, Simon CO, Kropp KA, et al. Viral latency drives ‘memory inflation’: a unifying hypothesis linking two hallmarks of cytomegalovirus infection. Med Microbiol Immunol. 2012;201(4):551–66. [DOI] [PubMed] [Google Scholar]
- 38.Nikolich-Zugich J. Ageing and life-long maintenance of T-cell subsets in the face of latent persistent infections. Nat Rev Immunol. 2008;8(7):512–22. [DOI] [PMC free article] [PubMed] [Google Scholar]
- 39.Cwynarski K, Ainsworth J, Cobbold M, Wagner S, Mahendra P, Apperley J, et al. Direct visualization of cytomegalovirus-specific T-cell reconstitution after allogeneic stem cell transplantation. Blood. 2001;97(5):1232–40. [DOI] [PubMed] [Google Scholar]
- 40.Mori T, Kato J. Cytomegalovirus infection/disease after hematopoietic stem cell transplantation. Int J Hematol. 2010;91(4):588–95. [DOI] [PubMed] [Google Scholar]
- 41.Kheav VD, Busson M, Scieux C, Peffault de Latour R, Maki G, Haas P, et al. Favorable impact of natural killer cell reconstitution on chronic graft-versus-host disease and cytomegalovirus reactivation after allogeneic hematopoietic stem cell transplantation. Haematologica. 2014. [Epub ahead of print]. [DOI] [PMC free article] [PubMed] [Google Scholar]
- 42.Hakki M, Riddell SR, Storek J, Carter RA, Stevens-Ayers T, Sudour P, et al. Immune reconstitution to cytomegalovirus after allogeneic hematopoietic stem cell transplantation: impact of host factors, drug therapy, and subclinical reactivation. Blood. 2003;102(8):3060–7. [DOI] [PubMed] [Google Scholar]
- 43.Zakrzewski JL, Goldberg GL, Smith OM, van den Brink MR. Enhancing T cell reconstitution after hematopoietic stem cell transplantation: a brief update of the latest trends. Blood Cells Mol Dis. 2008;40(1):44–7. [DOI] [PMC free article] [PubMed] [Google Scholar]
- 44.Geddes M, Storek J. Immune reconstitution following hematopoietic stem-cell transplantation. Best Pract Res Clin Haematol. 2007;20(2):329–48. [DOI] [PubMed] [Google Scholar]
- 45.Sewell AK. Why must T cells be cross-reactive? Nat Rev Immunol. 2012;12(9):669–77. [DOI] [PMC free article] [PubMed] [Google Scholar]
- 46.Farber DL, Yudanin NA, Restifo NP. Human memory T cells: generation, compartmentalization and homeostasis. Nat Rev Immunol. 2014;14(1):24–35. [DOI] [PMC free article] [PubMed] [Google Scholar]
- 47.Mougiakakos D, Jitschin R, von Bahr L, Poschke I, Gary R, Sundberg B, et al. Immunosuppressive CD14+HLA-DRlow/neg IDO+ myeloid cells in patients following allogeneic hematopoietic stem cell transplantation. Leukemia. 2013;27(2):377–88. [DOI] [PubMed] [Google Scholar]