

Supplemental digital content is available in the text.
Key Words: OLDER ADULTS, PHYSICAL ACTIVITY, SEDENTARY BEHAVIOR, ACCELEROMETER, COHORT STUDY
ABSTRACT
Background
The steep decline in physical activity (PA) among the oldest old is not well understood; there is little information about the patterns of change in PA and sedentary behaviour (SB) in older people. Longitudinal data on objectively measured PA data can give insights about how PA and SB change with age.
Methods
Men age 70–90 yr, from a United Kingdom population-based cohort wore a GT3X accelerometer over the hip annually on up to three occasions (56%, 50%, and 51% response rates) spanning 2 yr. Multilevel models were used to estimate change in activity. Men were grouped according to achieving ≥150 min·wk−1 of MVPA in bouts of ≥10 min (current guidelines) at two or three time points.
Results
A total of 1419 ambulatory men had ≥600 min wear time on ≥3 d at ≥2 time points. At baseline, men took 4806 steps per day and spent 72.5% of their day in SB, 23.1% in light PA, and 4.1% in moderate-to-vigorous PA (MVPA). Mean change per year was −341 steps, +1.1% SB, −0.7% light PA, and −0.4% MVPA each day (all P < 0.001). A total of 76.3% (n = 1083) never met guidelines (“stable low”), 7.9% (n = 112) consistently met guidelines (“stable high”), 8.2% (n = 116) stopped meeting guidelines by the last occasion (“decreasers”), and 4.9% (n = 69) started meeting guidelines by the last occasion (“increasers”). “Decreasers” spent 69.3% of each day in SB at baseline, which increased by 2% per year (P < 0.005), light activity remained at 23.3% (change, −0.2% per year; P = 0.4), and total MVPA decreased from 7.1% by −1.7% per year, (P < 0.001). The number of sedentary bouts >30 min increased from 5.1 by 0.1 per year (P = 0.02).
Conclusions
Among older adults, the steep decline in total PA occurred because of reductions in MVPA, while light PA is relatively spared and sedentary time and long sedentary bouts increase.
Physical activity (PA) levels are low in older adults and decline with increasing age; very few adults age over 70 yr meet current PA guidelines (23). Older adults could benefit greatly from leading more active lives as they bear high burdens of disease, which are preventable by PA. It is important to understand the decline in PA with age because it is one of the most important modifiable factors that can improve a wide range of mental and physical health outcomes. It is currently not clear whether the declines in total PA levels at older ages, which are observed in many countries (23), reflect a decline in moderate-to-vigorous PA (MVPA) levels and, if so, whether MVPA is replaced by lighter-intensity activities or whether sedentary time increases so that total time spent being active is reduced. Beyond that, it is not clear how patterns of PA associated with health benefits, such as bouts of 10 min or longer of MVPA change with age—are there fewer long bouts within the total amount of time spent in MVPA? Furthermore, does total sedentary behavior (SB) time increase and if so, does the pattern change to being sedentary for longer periods at a time? Given mounting evidence about the importance of SB for health (11,24), a change in pattern and total amount of SB is important from both health and policy perspectives.
Most research into PA levels in older adults has been based on cross-sectional data. Such studies mostly use self-reported PA and point to a decline in PA with increasing age, and in particular a very steep decline in activity in the oldest old (6,10,14). Longitudinal studies have shown that PA has low-to-moderate tracking from childhood to early adulthood (19) and through middle age (19), and from midlife into old age (2,13,16,18). However, few investigations using longitudinal data have examined changes in PA in later adulthood, including more than one time point when adults are aged over 70 yr (1,4,17). Moreover, existing studies are based on self-reported data, which has limited validity in older age groups. Objective measurements of activity are particularly valuable in providing a better indication of time spent in different levels of activity, particularly the light activities, which are imprecisely recalled and are the dominant intensity of activity in older adults. To date, only one study (based on 500 adults in one Japanese town) has provided such information (1). We report here on the results of 1419 community-dwelling men age >70 yr and including the oldest old drawn from 24 towns across the United Kingdom to descriptively investigate trajectories of activity over three time points spanning 2 yr. We examine average year-on-year changes in the total time and proportion of the day spent in PA of different intensities and changes in the duration of bouts of both MVPA and SB. In addition, we investigate these year-on-year changes in subgroups of men who did or did not meet the current PA guidelines at each of the time points, in order to examine whether the average annual changes differ in “high active” and “low active” men.
METHODS
Sample
The British Regional Heart Study is an ongoing prospective, population-based, cohort study originally including 7735 men who were recruited from primary care centers in 24 British towns in 1978–1980 and followed up repeatedly (25). In 1999/2000, men were invited to a rescreen and completed a questionnaire including lifestyle and medical history. Starting in 2010, survivors were invited to participate in a study of objectively measured PA annually on three occasions; 3127 were invited on at least two occasions. One follow-up was part of a clinic visit, and the other two were postal surveys (for approximately half the sample, the clinic visit was the first time point the accelerometer was offered, and for the other half, it was the second time point). All relevant local research ethics committees provided ethical approval. Participants provided informed written consent to the investigation, which was performed in accordance with the Declaration of Helsinki.
Measures
Accelerometer data
Participants were sent an accelerometer (at two time points) or were given one at an interview (at one time point) with a prepaid return envelope and a log diary to note when they wore the monitor. The three time points spanned 2 yr. Participants were asked to wear the GT3X accelerometer (ActiGraph, Pensacola, FL) over the right hip on an elasticated belt for 7 d, during waking hours, removing it for swimming or bathing. Data were processed using standard methods; raw data collected from movements registering on the vertical axis were integrated into 60-s periods (epochs). Nonwear time was identified and excluded using a commonly used and freely available R package, “Physical Activity” (7). Periods of continuous zeros lasting more than 90 min are assigned as nonwear time. During these nonwear periods, there may be artifactual monitor movements (because of accidental movement of the monitor, e.g., if it was touched while left on a table). The algorithm therefore allows short time intervals with nonzero counts lasting up to 2 min, provided that no counts are detected during both the 30-min upstream and downstream from that interval. This means that any nonzero counts except the allowed short interval of up to 2 min are considered as wear time. It is possible that removal periods lasting <90 min may be counted as SB instead of nonwear; however, when the self-reported wear time (from log diaries) was compared with the wear time estimated by the algorithm, the 90-min zero count window performed better than shorter zero count windows. Valid wear days were defined as ≥600-min wear time, and participants with three or more valid days were included in analyses, a conventional requirement to estimate usual PA levels (10,14,15). High activity levels (>10,000 counts per minute (cpm)) or high step counts (>20,000 steps per day) were verified against men’s daily log diaries. The number of minutes per day spent in PA of different intensity levels was categorized using standard count-based intensity threshold values of counts per minute developed for older adults (8), as follows: <100 cpm for SB (<1.5 METs),100–1040 for light activity (1.5–3 METs), and ≥1040 for MVPA (≥3 METs in older adults). In sensitivity analyses, 1952 cpm (≥3 METs in middle-age adults) was used to define MVPA (12).
Statistical Methods
Among men with complete data for three or more valid days of accelerometer wear, at two or three of the time points, random effects regression models were used to estimate the mean level and the annual change in the seven different PA outcome measures. The random effects models account for within-person clustering: the occasion of follow-up (range 1–3 occasions in 2010, 2011, and 2012) was at level 1, and the person ID was at level 2. Models were adjusted for age (centered around the sample mean), season of wear (spring, summer, autumn, and winter), average wear time (min·d−1), and region of residence (Scotland, North, Midlands, and South). Models of the percentage of the day spent in sedentary, light PA, and MVPA were not adjusted for wear time, as wear time is the denominator for calculating the percentage of time per day. The mean change per year in each of the PA outcomes was estimated and scaled per year of follow-up in the whole population. Linear models were used for daily steps, percentage of the day spent in sedentary, light PA, and MVPA, number of breaks in SB per sedentary hour, bouts of SB lasting >30 min, and bouts of SB lasting >60 min. The percent of the day and number of minutes spent in MVPA were highly positively skewed, so negative binomial models were used for these outcomes. In terms of mean structure, this model is comparable with a Poisson regression but it has an extra parameter to model the overdispersion (5). Statistical analyses were run in R version 2.15.3 and Stata version 13 and MLwiN version 2.28 (20–22).
For each participant, the total number of minutes spent in MVPA in each of the valid days (range, 3–8 d) was summed. For participants who did not have seven valid days, the total MVPA minutes were scaled to the number of valid days. Men were classified according to whether they met PA guidelines of attaining ≥150 min of MVPA over 7 d at each one of the three time points using the total number of minutes of MVPA accumulated in bouts lasting ≥10 min as recommended in current PA guidelines. The sample was then divided into five groups on the basis of whether men habitually adhered to guidelines on all three occasions, “stable high”; or not, “stable low,” those who started adhering to guidelines between time 1 and time 3; “increasers,” those who no longer adhered to guidelines by time 3 “decreasers”; and an “inconsistent” group who had at least two measurements but did not fit into these patterns.
Mean age stratified by the five activity trajectory groups was calculated, and a chi-square test was used to test differences across the five activity groups. The mean level and annual change in the summary measures of PA were calculated for each of the five PA trajectory groups using random effects regression models, as discussed previously.
RESULTS
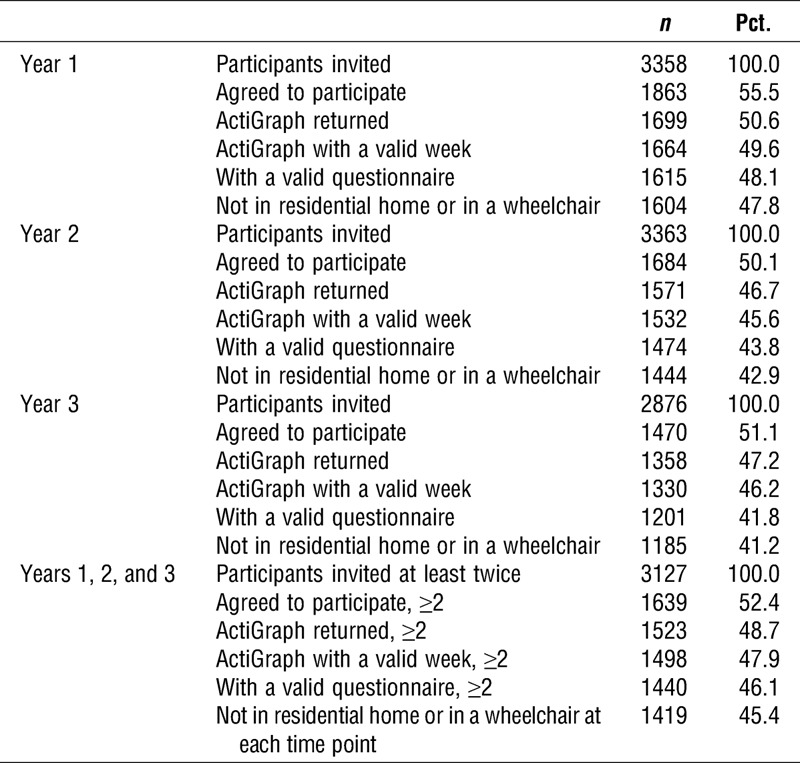
In 2010–2011, 3358 survivors were invited to participate in a study on objectively measured PA and 56% accepted; the following year, 3363 were invited and 50% accepted; in year 3, 2876 were invited and 51% accepted. In total, 3127 survivors were invited to participate in the annual activity monitor studies on at least two occasions. A total of 52% (1639/3127) accepted at least twice; of these, 1498/1639 (91%) men had at least 3 d of 600 min·d−1 of wear. A further 58 men who did not complete a questionnaire and 21 men in a residential home or who were confined to a wheelchair were excluded, leaving 1419 men for analyses who had data at two out of the three time points (Table 1). Comparing the characteristics of the 1639 men who accepted at least twice with those of the 913 men who were invited but did not accept ever (of whom, 1515 and 600, respectively, had data at a follow-up 10 yr previously), at that time point, men who accepted were younger (66 vs 69 yr on average, P < 0.001), less likely to smoke (12% vs 17%, P = 0.005), and had a higher level of PA (41% vs 26%, reporting at least moderately vigorous activity, P < 0.001).
TABLE 1.
Recruitment flow chart and identification of the eligible population of men over 3 yr of measurements.
PA at baseline
At the baseline time-point, men were age 77.9 yr (SD, 4.5) and had an average body mass index of 27 kg·m−2; 21% were depressed, 4% had prevalent stroke, 8% had prevalent myocardial infarction, 9% had diabetes, and 3% were current smokers. Men took an average of 4806 steps per day and spent 73% of their day in SB, 23% in light PA, and 4% in MVPA but only 1% of the day in bouts of MVPA lasting 10 min or longer (Table 2). The number of minutes per day spent in each level of activity is shown in Supplemental Digital Content 1 (Baseline PA according to trajectories of change in PA, http://links.lww.com/MSS/A411). Patterns of activity defined by the number of bouts or spells of activity of different durations were examined. Men had an average of 67.3 bouts per day of SB lasting 30 min or less at a time and 5.1 sedentary bouts lasting more than 30 min. Men broke up their sedentary time, taking on average 7.2 breaks per sedentary hour in the day. Most of the bouts of sedentary time were short; 85% lasted 15 min or less and 90% lasted 30 min or less. The patterns of number of sedentary bouts of ≤15 min (See Table, Supplemental Digital Content 1, Baseline PA according to trajectories of change in PA, http://links.lww.com/MSS/A411) and ≤30 min were very similar (Table 2), so only the latter are presented in Tables 2 and 3. In terms of long sedentary bouts, men had an average of 3.5 bouts of SB lasting 30–60 min and 1.4 bouts per day lasting over 1 h. Only data on bouts lasting >30 min are presented because these are the majority of the long bouts and patterns for bouts of >60 or >120 min (see Table, Supplemental Digital Content 1, Baseline PA according to trajectories of change in PA, http://links.lww.com/MSS/A411) were similar to patterns for bouts of >30 min (Table 2). On average, total accelerometer wear time at baseline was 855 min·d−1 (95% confidence interval (CI), 849–867).
TABLE 2.
Baseline characteristics of men according to their trajectories of change in PA over three time points (n = 1405).
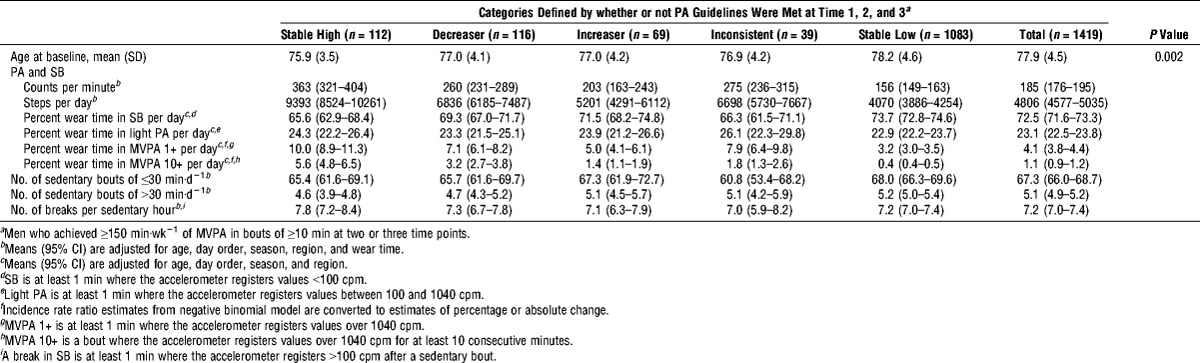
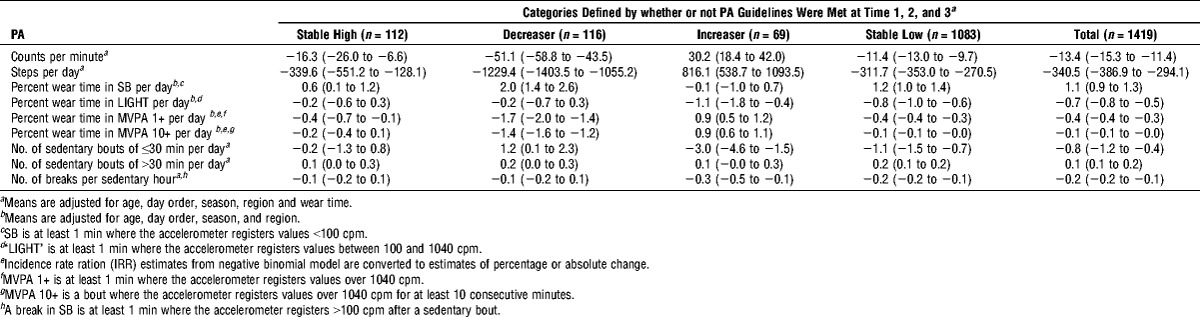
TABLE 3.
Mean (95% CI) annual change in PA according to trajectories of change in PA over three time points (n = 1419).
Changes in PA
Table 3 presents estimates for the mean change per year in each activity variable, from the same multilevel models as in Table 2. In the whole sample, the mean changes per year were −312 steps, +1.1% of time per day in SB, −0.7% of time per day in light PA, and −0.4% of time per day in MVPA each day (all P < 0.001). The number of short bouts of SB lasting 30 min or less decreased by 0.8 per year, whereas the number of longer bouts of SB lasting more than 30 min increased by 0.1 per year as did the number of bouts lasting more than 60 min. The number of sedentary breaks decreased by 0.2 per year (all P < 0.05). Supplemental Digital Content 2 (see Table, Annual percentage change in PA according to trajectories of change in PA, http://links.lww.com/MSS/A412) shows the equivalent values for the number of minutes per day and also the different bout lengths of PA and SB. The annual change in total recorded time over the period was −3.7 min (95% CI, −5.4 to −1.9), equivalent to 0.4% of the average wear day.
Meeting PA guidelines
The 1419 men were grouped according to whether they attained MVPA guidelines at the three time points. The four main trajectories of change over the three time points were as follows: 76.3% (n = 1083) never met guidelines, “stable low”; 7.9% (n = 112) always met guidelines, “stable high”; 8.2% (n = 116) stopped meeting guidelines by the last occasion, “decreasers”; and 4.9% (n = 69) started meeting guidelines by the last occasion, “increasers.” A total of 2.8% (n = 39) were inconsistent. The results presented focus on the first four groups because they are consistent activity patterns. PA levels at baseline differed between the groups. The adjusted mean baseline values for the stable high group were highest for counts per minute, daily step counts, and percentage of time spent in light and MVPA. The stable high group had the lowest percentage of time spent SB, followed by the decreasers group; the increasers group and the stable low had the lowest activity levels. The stable high group had the lowest number of sedentary bouts lasting over 30 min, followed by decreasers, increasers, and stable low groups. Figure 1 illustrates the baseline level and change in number of steps per day in the whole sample and in each of the four groups, estimated from the adjusted multilevel models presented in Tables 2 and 3.
FIGURE 1.
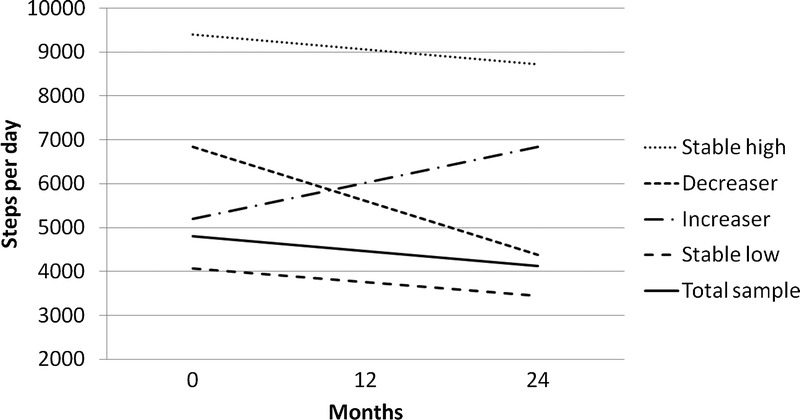
Baseline level and change in number of steps per day in the whole sample and in each of the four groups.
In Table 3 stratified analyses, among the “stable high” group (8%, n = 110) who were most active at baseline, the number of steps per day and short bouts of MVPA decreased. There was no change in the proportion of time spent in light activity and long bouts of MVPA. The percentage of sedentary time increased by 0.6%, which was less than that in the whole population, and there was no change in the number of short sedentary bouts. Among the “decreasers” (8%, n = 116), there was a large decrease in number of steps per day (1229 steps) and both short and long bouts of MVPA decreased from 7.1% by −1.7% per year and from 3.2% by −1.4% per year (both P < 0.001). Light activity remained stable. Sedentary time increased by 2% per year (P < 0.005), and the number of sedentary bouts >30 min increased from 4.7 by 0.2 per year (P = 0.02).
The majority of the population (76%, n = 1083) were “stable low,” among whom the number of steps per day decreased (312 steps), the percentage sedentary time increased (1.2%), and percentage of time in light (by −0.8%) and MVPA decreased (by −0.4%); the number of sedentary bouts ≤30 min and the number of breaks in sedentary time decreased, whereas the number of long sedentary bouts increased, pointing toward a pattern of lower light PA and MVPA and more SB accrued in longer bouts. Because these were the majority of the population, they were further stratified according to their average counts per minute, which revealed a variety of patterns (See Table, Supplemental Digital Content 3, Categories of activity patterns over three time points among the “stable low” men who never met the guidelines, http://links.lww.com/MSS/A413). Half of the “stable low” group had an average counts per minute under 200 (the population mean was 193 cpm) and were “low active” at each time point. A total of 24% had average counts, which decreased over the time points, and 9% increased their activity level. A total of 7% had activity counts 200–299 cpm, with a step count of 5796 at baseline and 2% had counts over 300 cpm and a step count of 7608 at baseline; neither of these two active groups met guidelines as they had insufficient time spent in MVPA in bouts of 10 min or longer yet the percentage of time spent in MVPA in bouts of 1 min or longer was 6% and 9%, respectively, indicating that they were in fact quite active but not in the right patterns to meet the guidelines.
Several sensitivity analyses were performed; the sample was stratified by age at baseline, under 75, 75–79, and over 80 yr. The younger men took more steps and spent more time in light PA and MVPA and less time in SB. However, the annual rate of change in time spent in different intensities of activity did not differ between the age groups, with the exception that the over 80s had a significantly greater reduction in percentage of time spent in light activity; the reduction was −0.4% (95% CI, −0.6 to −0.1) per year for men age under 75 yr and −0.9% for men age over 80 yr (an additional −0.5% (95% CI, −0.9 to −0.2); data not presented). The sample was also stratified by presence of mobility limitations (defined as having “slight” or “moderate or severe” problems getting about outdoors), and although the men without mobility limitations were more active than the men with limitations, the change in activity level did not differ in the men with no limitations compared with that in men with slight or severe mobility limitations (data not presented). Finally, models were additionally adjusted for self-rated health (excellent, good, fair, or poor) at each of the three time points. Results did not suggest that the changes in self-rated health status explained the changes in activity because the estimated level and changes in PA were very minimally affected by adjustment for self-rated health (data not presented).
DISCUSSION
Men spent an average of 73% of their day in SB, which increased by 1% per year, 23% of the day in light activity, which decreased by 0.7% per year, and 4% of the day in MVPA, which decreased by 0.4% per year. Although these are small changes, over a decade, they would amount to large decreases in activity. The 0.4% reduction in MVPA from a starting point of 4% represents a reduction of about 10% in the total daily time spent in MVPA, whereas the decrease of 0.7% in light activity from a starting point of 23% equates to 3% decline in daily light activity, suggesting that in relative terms, MVPA declines the most and light activity is relatively spared. This is important from the perspective of losing the health benefits of MVPA with advancing age. Nearly three quarters of the community-dwelling older men studied did not attain PA guidelines at any of the surveys; indeed, from population surveys using self-reported data, we expected this group to be the largest. Approximately one in 10 maintained adequate PA at each time they were surveyed. We also examined within-person change and identified that approximately 10% decreased activity level and 5% increased activity level to meet guidelines, whereas a further 3% had inconsistent activity patterns over the 3 yr.
As expected from surveys using self-report PA data, the largest group was the inactive group (2) and, in line with cross-sectional data showing lower PA levels with increasing age (6), the overall pattern was a decrease in within-person PA levels in all the groups, with the exception of the increasers. The objective data permitted us to quantify the percentage of the day spent in sedentary, light PA, and MVPA and to estimate the duration of bouts of activity and sedentary time and how much sedentary time is broken up; we found that even within the stable high group, the MVPA levels declined and SB increased, suggesting that some MVPA was displaced by sedentary activity. Those who stopped meeting the guidelines over the study period (decreasers) decreased both step counts and MVPA levels whereas light activity levels remained relatively similar, but they increased both their total sedentary time and their time in long sedentary bouts. The data suggested that over time, MVPA is largely displaced by SB rather than shifted to light activity. Even among the men who never met guidelines, the reduction in MVPA was accompanied by reduction in light activity and an increase in sedentary activity, suggesting that both light PA and MVPA are displaced by sedentary activity. It is possible that the greater relative decrease in MVPA compared with that in other intensities of PA may be due to declines in physical functioning rather than in volitional PA, although we cannot test this directly because we lack data on whether activity was volitional. We did, however, adjust models for self-rated health at each of the three time points, but results did not suggest that changes in health status explained the decline in activity because the estimated level and changes in PA were very minimally affected by the adjustment. Our overall findings fit with data from the Nakanojo study of older Japanese adults, the only other study with data on change in objectively measured PA in older adults over time (1). The reduction in the year-averaged daily step count with age was found to be due to reduction in activities of >3 METs (i.e., MVPA) in men, whereas in women, it was due to reduction in activities <3 METs. However, they did not report the changes in all the different intensities of activity as we have done. Our data suggest that there may be room for public health strategies to focus on increasing light PA in older adults to replace declining MVPA levels so that SB, particularly in long sedentary bouts, is not increased. However, at present, the evidence for the health benefits of light PA is much weaker than the evidence for MVPA (3) and if future studies demonstrate that light PA has beneficial health effects, particularly for prevention of onset of morbidity (e.g., cardiovascular diseases, diabetes, and stroke events) and mortality, this will have further weight.
Strengths and limitations
This study benefits from repeated measurements of objectively assessed PA in the same sample of men using the same study protocol over 3 yr, which permitted comparisons of PA levels to be made over time within the same individuals. However, the study is restricted to older men and may not be generalizable to older women, who have different patterns of PA. It is therefore possible that the patterns of decline may also differ between the sexes. The sample includes free-living community-dwelling older men rather than being restricted to special “at risk” clinical populations, so our results should be widely generalizable. Participants included in the present study differed in health status from those not included, with an underrepresentation of the less active. Indeed, comparison of participants suggested that the younger, more active, and nonsmokers were more likely to have been included in follow-up sample studied here than their older, less active, and cigarette smoker counterparts. Nevertheless, our response rates to the accelerometer studies (around 50%) are line with, or better than those in other studies on older adults, as follows: 21% (10), 43% (14), and in the Health Survey for England, 37% women and 48% men over 75 yr had four or more days with valid data (9).
CONCLUSIONS
Few older adults attain PA guidelines and manage to maintain that level of activity over repeated time points. Among those who stopped meeting the guidelines over the study period and those who never met the guidelines, MVPA was largely displaced by SB, rather than shifted to light activity. It may therefore be relevant for public health strategies to focus on increasing light PA in older adults so that long bouts of SB are not increased. However, at present, the evidence for the health benefits of light PA is much weaker than the evidence for MVPA. The results of future studies defining the health effects of light PA in older people will be particularly important in informing health advice.
Supplementary Material
Acknowledgments
We acknowledge the British Regional Heart Study team for data collection.
B. J. J. was funded by a National Institute for Health Research postdoctoral fellowship (2010-03-023). The British Regional Heart study is supported by a British Heart Foundation program grant (RG/08/013/25942). I. M. L. is partly supported by United States National Institutes of Health grant CA154647.
The authors’ contributions are as follows: B. J. J. conceived and designed the study, analyzed and interpreted data, and drafted the manuscript; B. J. J. is the guarantor of the study; C. S. analyzed and interpreted data and revised and approved the final version of the article; I. M. L. interpreted data and revised and approved the final version of the article; S. A. and L. T. L. collected and interpreted data and approved the final version of the article; S. G. W. conceived and designed the study, interpreted data, and revised and approved the final version of the article; and P. H. W. conceived and designed the study, collected and interpreted data, and revised and approved the final version of the article.
The National Institute for Health Research, British Heart Foundation, and United States National Institutes of Health had no role in the design and conduct of the study, collection, management, analysis, and interpretation of the data, preparation, review, or approval of the manuscript, and decision to submit the manuscript for publication. The views expressed in this publication are those of the author and not necessarily of the National Institute for Health Research.
The results of the present study do not constitute endorsement by the American College of Sports Medicine.
Footnotes
Supplemental digital content is available for this article. Direct URL citations appear in the printed text and are provided in the HTML and PDF versions of this article on the journal’s Web site (www.acsm-msse.org).
REFERENCES
- 1. Aoyagi Y, Shephard RJ. Habitual physical activity and health in the elderly: the Nakanojo study. Geriatr Gerontol Int. 2010; 10( 1 Suppl): S236– 43. [DOI] [PubMed] [Google Scholar]
- 2. Barnett TA, Gauvin L, Craig CL, Katzmarzyk PT. Distinct trajectories of leisure time physical activity and predictors of trajectory class membership: a 22 year cohort study. Int J Behav Nutr Phys Act. 2008; 5: 57. [DOI] [PMC free article] [PubMed] [Google Scholar]
- 3. Buman MP, Hekler EB, Haskell WL, et al. Objective light-intensity physical activity associations with rated health in older adults. Am J Epidemiol. 2010; 172( 10): 1155– 65. [DOI] [PMC free article] [PubMed] [Google Scholar]
- 4. Byberg L, Melhus H, Gedeborg R, et al. Total mortality after changes in leisure time physical activity in 50 year old men: 35 year follow-up of population based cohort. BMJ. 2009; 338: B688. [DOI] [PMC free article] [PubMed] [Google Scholar]
- 5. Cameron AC, Trivedi PK. Basic count regression. In: Regression Analysis of Count Data, Cambridge (United Kingdom): Cambridge University Press, 2013: 69– 109. [Google Scholar]
- 6. Chaudhury M, Roth M. Physical activity. In: Craig R, Mindell J, eds. Health Survey for England 2006. Volume 1. Cardiovascular Disease and Risk Factors in Adults, Leeds (United Kingdom): The Information Centre, 2008: 111– 34. [Google Scholar]
- 7. Choi L, Liu Z, Matthews C, Buchowski MS. Physical activity: process physical activity accelerometer data. 2011. Computer Program. [Google Scholar]
- 8. Copeland JL, Esliger DW. Accelerometer assessment of physical activity in active, healthy older adults. J Aging Phys Act. 2009; 17( 1): 17– 30. [DOI] [PubMed] [Google Scholar]
- 9. Craig R, Mindell J, Hirani V. Health Survey for England 2008. Physical Activity and Fitness. Summary of Key Findings, London (United Kingdom): The Health and Social Care Information Centre, 2009: 5– 9. [Google Scholar]
- 10. Davis MG, Fox KR, Hillsdon M, Sharp DJ, Coulson JC, Thompson JL. Objectively measured physical activity in a diverse sample of older urban UK adults. Med Sci Sports Exerc. 2011; 43( 4): 647– 54. [DOI] [PubMed] [Google Scholar]
- 11. Ford ES, Caspersen CJ. Sedentary behaviour and cardiovascular disease: a review of prospective studies. Int J Epidemiol. 2012; 41( 5): 1338– 53. [DOI] [PMC free article] [PubMed] [Google Scholar]
- 12. Freedson PS, Melanson E, Sirard J. Calibration of the computer science and Applications, Inc. accelerometer. Med Sci Sports Exerc. 1998; 30( 5): 777– 81. [DOI] [PubMed] [Google Scholar]
- 13. Hamer M, Kivimaki M, Steptoe A. Longitudinal patterns in physical activity and sedentary behaviour from mid-life to early old age: a substudy of the Whitehall II cohort. J Epidemiol Community Health. 2012; 66( 12): 1110– 5. [DOI] [PMC free article] [PubMed] [Google Scholar]
- 14. Harris TJ, Owen CG, Victor CR, Adams R, Cook DG. What factors are associated with physical activity in older people, assessed objectively by accelerometry? Br J Sports Med. 2009; 43( 6): 442– 50. [DOI] [PubMed] [Google Scholar]
- 15. Hart TL, Swartz AM, Cashin SE, Strath SJ. How many days of monitoring predict physical activity and sedentary behaviour in older adults? Int J Behav Nutr Phys Act. 2011; 8: 62. [DOI] [PMC free article] [PubMed] [Google Scholar]
- 16. Kirjonen J, Telama R, Luukkonen R, Kaaria S, Kaila-Kangas L, Leino-Arjas P. Stability and prediction of physical activity in 5-, 10-, and 28-year follow-up studies among industrial employees. Scand J Med Sci Sports. 2006; 16( 3): 201– 8. [DOI] [PubMed] [Google Scholar]
- 17. McAuley E, Hall KS, Motl RW, et al. Trajectory of declines in physical activity in community-dwelling older women: social cognitive influences. J Gerontol B Psychol Sci Soc Sci. 2009; 64( 5): 543– 50. [DOI] [PMC free article] [PubMed] [Google Scholar]
- 18. Morseth B, Jorgensen L, Emaus N, Jacobsen BK, Wilsgaard T. Tracking of leisure time physical activity during 28 yr in adults: the Tromso study. Med Sci Sports Exerc. 2011; 43( 7): 1229– 34. [DOI] [PubMed] [Google Scholar]
- 19. Parsons TJ, Power C, Manor O. Longitudinal physical activity and diet patterns in the 1958 British birth cohort. Med Sci Sports Exerc. 2006; 38( 3): 547– 54. [DOI] [PubMed] [Google Scholar]
- 20.R Core Team. R: A language and environment for statistical computing. 2013. Computer Program. [Google Scholar]
- 21. Rasbash J, Charlton C, Browne WJ, Healy M, Cameron B. Mlwin. 2009. Computer Program. [Google Scholar]
- 22.Statacorp. Stata Statistical Software: Release 13. 2013. Computer Program. [Google Scholar]
- 23. Sun F, Norman IJ, While AE. Physical activity in older people: a systematic review. BMC Public Health. 2013; 13: 449. [DOI] [PMC free article] [PubMed] [Google Scholar]
- 24. Thorp AA, Owen N, Neuhaus M, Dunstan DW. Sedentary behaviors and subsequent health outcomes in adults: a systematic review of longitudinal studies, 1996–2011. Am J Prev Med. 2011; 41( 2): 207– 15. [DOI] [PubMed] [Google Scholar]
- 25. Walker M, Whincup PH, Shaper AG. The British Regional Heart Study 1975–2004. Int J Epidemiol. 2004; 33( 6): 1185– 92. [DOI] [PubMed] [Google Scholar]
Associated Data
This section collects any data citations, data availability statements, or supplementary materials included in this article.