

Abstract
The pathogenesis of late-onset TH2-low asthma in obesity is thought to be related to weight-related decreases in lung volume, but why only a subset of individuals with obesity develop this condition is unknown. We tested the hypothesis that natural variations in both airway wall stiffness and airway wall thickness could lead to a subpopulation of hyperresponsive individuals exhibiting the symptoms of asthma in the setting of obesity. Increases in airway resistance (Raw) after airway smooth muscle stimulation were simulated using a computational model of an elastic airway embedded in elastic parenchyma. Using a range of randomly chosen values for both airway wall stiffness and thickness, we determined the resulting probability distributions of Raw responsiveness for a variety of different levels of transpulmonary pressure (Ptp). As Ptp decreased from 5 to 1 cmH2O, the resulting distributions of Raw moved toward progressively higher levels of responsiveness. With appropriate choices for the mean and standard deviation of the parameter that controls either airway wall stiffness or thickness, the model predicts a relationship between airway hyperresponsiveness and body mass index that is similar to that which has been reported in populations with obesity. We conclude that natural variations in airway wall mechanics and geometry between different individuals can potentially explain why an increasing percentage of the population exhibits the symptoms of asthma as the obesity of the population increases.
Keywords: airway-parenchymal interdependence, airway resistance, computational model, airway hyperresponsiveness
asthma is one of a number of common diseases being negatively impacted by the current obesity epidemic. The reasons why obesity increases asthma rates remain to be fully elucidated, but it has been shown that the asthma of obesity appears in two principle forms. One is an early-onset TH2-high phenotype that is reminiscent of most conventional asthma and that is exacerbated by the obese state. The other is a distinct obesity-related phenotype that frequently resolves with sufficient weight loss (18, 36). It seems logical to suppose that the latter phenotype is related to the chronic depressions in lung volume that invariably occur in morbid obesity due to the weight of excess adipose tissue around the chest wall (30). This causes corresponding reductions in transpulmonary pressure, something that is well known to be a potent mechanism leading to airways hyperresponsiveness (17). Curiously, only a subset of people with severe obesity develop asthma (38), yet presumably all such individuals are at risk for having their lung volumes depressed. This would seem to indicate that some predisposing factor is operative in those individuals who develop the late-onset TH2-low form of obese asthma.
We recently obtained evidence that this predisposing factor is related to an increased propensity for the lung periphery to become derecruited at reduced transpulmonary pressures in subjects with obesity and asthma compared with their counterparts without asthma (2). Specifically, we used a simple mathematical model of lung impedance to show that weight loss in a group of subjects with obesity and asthma led to a greater increase in lung compliance compared with controls, which can be explained by excess weight having caused greater collapse of the lung periphery in the subjects with asthma. To explain how this difference might arise, we first note that the reason why peripheral airways become more easily collapsed as lung volume is reduced is because of the associated reductions in the outward tethering forces exerted on the airway walls by their alveolar parenchymal attachments (32). These attachments mediate the transmission of transpulmonary pressure across the airway wall, so a given reduction in transpulmonary pressure would be expected to have an essentially equal effect on airway collapsibility for all subjects. However, the compressive stiffness of the airway wall itself also plays a substantial role in the collapsibility of airways (1, 4), and there is no a priori reason to suppose that wall stiffness should be the same in all individuals. Similarly, the thickness of the epithelial and submucosal layers inside the airway smooth muscle (ASM) exerts a powerful influence on both airway responsiveness and closure and again we might expect thickness to exhibit a natural variation within the population. This raises the possibility that nonatopic asthma may arise in individuals with obesity with airways that are either more compliant or thicker than average, something that would require novel therapies and is thus an important matter to understand.
Accordingly, the goal of the present study was to investigate, with the use of a computational model, the possibility that natural variations in the mechanical and geometric properties of the airway wall might explain how modest reductions in lung volume could give rise to a distinct population of individuals who develop the symptoms of asthma when they become obese.
METHODS
The calculations performed for this study were made using a computational model that we described in detail previously (4) and used in several other studies (3, 5, 14, 26). The model consists of a circular airway wall embedded in elastic parenchyma. The airway itself consists of a ring of ASM wrapped around an elastic airway wall. ASM contraction decreases airway radius by compressing the airway wall and by pulling against the parenchyma that is attached to the outside of the wall. The opposing force exerted by the parenchyma comes from transpulmonary pressure (Ptp) and from the local parenchymal distortions caused by the narrowing of the airway. The latter are assumed to follow the relationship identified by Lai-Fook (27).
The inward recoil of the airway wall is determined by its stiffness, which is assumed to arise from a fraction (1 − k) of the airway circumference that expands according to the one-third power of Ptp (i.e., in exactly the same way as the parenchyma itself). The remaining fraction, k, of the circumference is assumed to be inextensible, where 0 < k < 1. Thus when k = 0 the airway wall has exactly the same intrinsic elastic properties as the parenchyma (i.e., it is as if the parenchyma continues right up to the airway lumen and there is no separate structure representing the airway wall). When k = 1, the airway wall is completely inextensible, so the lumen remains the same size regardless of Ptp, making airway narrowing impossible. Thus the airway becomes progressively more compliant as k decreases below 1. Defining the stiffness of the airway wall also requires specifying the pressure, P0, at which the airway (in the absence of ASM activation) induces no local distortion in the attached parenchyma. In other words, replacing the entire airway with continuous parenchyma at this pressure would not alter the configuration of the remaining parenchyma.
After ASM activation the model airway narrows dynamically according to the Hill hyperbolic force-velocity relationship (4, 21) given by
| (1) |
where r is airway radius, FA is active force generated by the ASM, and a and b are constants. After experimental findings reported in rats (7), we set a = F0/4.
This model thus has four free parameters (k, P0, b, and F0) that can be evaluated by fitting it to experimentally measured profiles of Raw obtained immediately after injections of bronchial agonist repeated at different levels of lung inflation (4). Such data have not been collected in humans and indeed are unlikely to be for practical and ethical reasons. Accordingly, for the purposes of the present study we based our simulations on model parameter values previously identified for the mouse (14), namely P0 = 10 cmH2O, F0 = 4.8 cm/cmH2O, and b = 0.042 cm/s.
The values of k were chosen as follows. We assume that there exists within the normal human population a natural variation in airway wall stiffnesses. We represented this variation by drawing k from a Gaussian distribution with mean kmean and standard deviation kSD. We do not have data from human subjects to guide the choice of kmean and kSD, so in the present study we based kmean on values we previously determined for mice (14) and chose kSD to give a realistic variation in responsiveness within the simulated population (see results).
To calculate how variations in airway wall stiffness translate into variations in airway responsiveness we performed a series of Monte-Carlo simulations. For each such simulation the model was run 10,000 times at a fixed value of Ptp with k being drawn randomly for each run from the specified Gaussian distribution. The model airway was relaxed at the beginning of each run, but reached different levels of steady-state contraction (achieved by 200 s) depending on the value of k. During each run the model was assumed to be at a constant lung volume determined by the specified value of Ptp (i.e., ventilation was at a sufficiently low level that changes in lung volume did not influence the capacity of the ASM to shorten). We characterized airway responsiveness in each run as the final value of airway resistance, Raw, at the end of each 200-s model run, where Raw was taken as proportional to the fourth power of the radius of the airway lumen (i.e., assuming Poiseuille airflow in the airways). The histogram of the 10,000 values of Raw obtained in this manner then yielded the responsiveness probability distribution for the simulated population. This procedure was repeated for different values of Ptp.
We then repeated these simulations, keeping Ptp fixed while varying the thickness of the epithelial and other tissues on the luminal side of the ASM. These tissues are represented in the model by an annular lining between the ring of ASM and airway lumen. The thickness of the lining is a fraction, α, of the ASM radius under baseline conditions defined as when the ASM is relaxed and functional residual capacity (FRC) is at its nominal normal value when PEEP = 5 cmH2O. The lining retains its annular shape and its area is preserved as the ASM shortens, which leads to a geometric accentuation of the narrowing of the airway lumen. The calculations involved are detailed in the appendix of Ref. 5. Of course, the thickness of the tissue lying to the luminal side of the ASM in a real lung does not scale with airway size, so there is no single anatomically defined value of α that can be used to guide its choice for the model. Accordingly, we chose its value empirically in the present study.
RESULTS
Figure 1 illustrates how airway responsiveness predicted by the model is affected by variations in the level of lung inflation, airway wall stiffness, and airway wall thickness. Figure 1A shows Raw vs. time for Ptp = 5, 3, and 1 cmH2O with k = 0.73 (Raw in Fig. 1A has been normalized to its initial value at Ptp = 5 cmH2O). As one would expect, the responsiveness of the model is inversely related to the degree of lung inflation. Figure 1B gives corresponding plots for k = 0.68, 0.73, and 0.78 with Ptp = 5 cmH2O and α = 0 (Raw in Fig. 1B has been normalized to its initial value at k = 0.73 cmH2O), which shows that responsiveness is also highly sensitive to wall stiffness; a relatively stiff airway wall (k = 0.78) leads to an increase in Raw that is much smaller than when the airway wall is more compliant (k = 0.68). Figure 1C gives corresponding plots for α = 0.05, 0.08, and 0.11 with Ptp = 5 cmH2O and k = 0.73 (Raw in Fig. 1C has been normalized to its initial value at α = 0.08), which shows that responsiveness is at least as sensitive to wall thickness as to either Ptp or k.
Fig. 1.
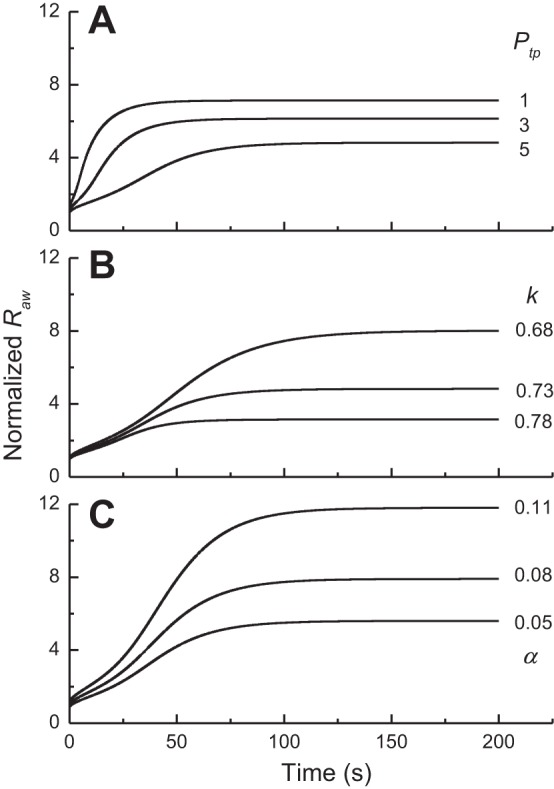
A: time courses of airway resistence [Raw; normalized to its initial relaxed value at transpulmonary pressure (Ptp) = 5 cmH2O] predicted by the computational model when Ptp was set equal to 5, 4, and 3 cmH2O while k was assigned a value of 0.7. B: corresponding Raw (normalized to the initial relaxed value for k = 0.73) time courses when k took values of 0.68, 0.73, and 0.78 while Ptp was fixed at 5 cmH2O. C: corresponding Raw (normalized to the initial relaxed value for α = 0.08) time courses when α took values of 0.05, 0.08, and 0.11 while Ptp was fixed at 5 cmH2O.
Figure 2A shows histograms of Raw for Ptp = 5, 3, and 1 cmH2O obtained with k selected from a Gaussian probability distribution with kmean = 0.73, corresponding our previous findings in mice (14), and kSD = 0.04. (Note that Raw in this plot has been normalized to the value defining the upper 5% of the distribution obtained with Ptp = 5 cmH2O.) The histograms have extended tails that spread to the right as Ptp decreases. These results show, first of all, that a naturally occurring variation in airway wall stiffness within the population is predicted to lead to a substantial variation in airway responsiveness. Most importantly, however, a decrease in Ptp, as tends to occur with obesity due to a decrease in lung volume, causes a substantial shift in the responsiveness distribution in the direction of hyperresponsiveness.
Fig. 2.
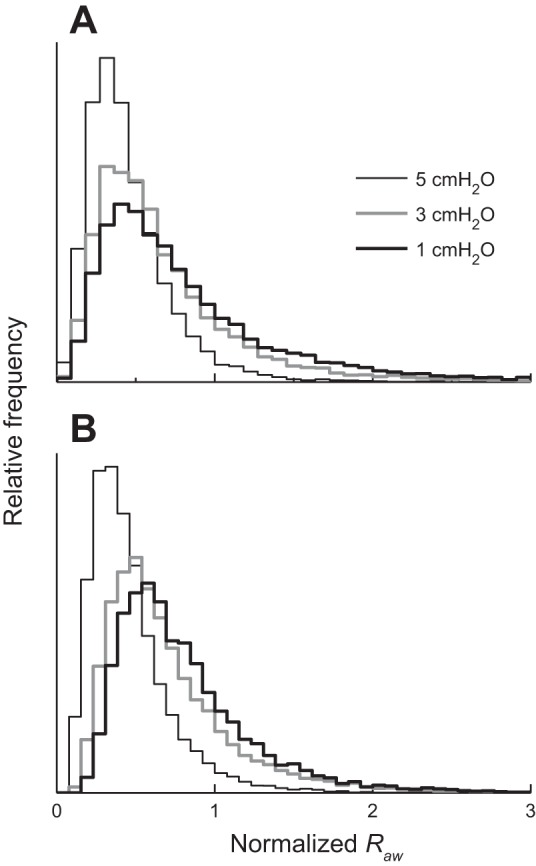
A: histograms of fractional increase in Raw obtained with 3 different values of Ptp while k was drawn randomly from a Gaussian distribution with kmean = 0.73 and kSD = 0.04. B: corresponding histograms obtained with 3 different values of Ptp while α was drawn randomly from a Gaussian distribution with mean = 0.08 and standard deviation = 0.03. Horizontal axis has been transformed from Ptp to body mass index (BMI) using a published relationship between BMI and reduction in functional residual capacity (FRC), as described in the text.
Figure 2B shows a corresponding plot obtained when kSD is set to zero (i.e., no variation in airway wall stiffness) and the lining of the airway wall is given a finite and varying thickness such that the mean value of α is 0.08 and its standard deviation is 0.03. The histograms for Raw are very similar to those obtained when α = 0 and k is allowed to vary (Fig. 2A).
We next use the model to predict how responsiveness in the population increases with increasing obesity. The Raw histogram obtained with Ptp = 5 cmH2O defines the distribution of responsiveness within the normal weight population at normal FRC. The value of Raw below which 95% of this distribution lies then defines the upper limit of normal responsiveness (hence the normalization of Raw to this value in the distributions shown in Fig. 2). As we decrease Ptp, progressively more of the population surpasses this limit and thus becomes hyperresponsive, as shown by the rightward movement of the distributions in Fig. 2. The increasing % of hyperresponsive individuals is shown in Fig. 3 as a function of body mass index (BMI) for both variations in k and variations in α. The transformation of the horizontal axis in this plot from Ptp to BMI was made as follows. First, increasing BMI reduces the volume of the thoracic cavity, which reduces Ptp and thus reduces FRC correspondingly. We assume that FRC at normal weight is 100% of its predicted value when Ptp = 5 cmH2O. As BMI increases, FRC approaches residual volume at Ptp = 0 cmH2O. Assuming a nominal value for residual volume at normal weight of 50% FRC, this gives FRC (% predicted) = (50 × Ptp/5) + 50. Finally, using the equation FRC (% predicted) = 231.9e−0.07BMI + 55.2, derived by Jones et al. (23), we convert a particular value of FRC to its corresponding value of BMI. Also shown on Fig. 3 are incidences of asthma as a function of the midpoint of different BMI ranges from (26a) for patients with obesity, as well as the midpoint of the incidence range in the general population placed at a healthy BMI (although it should be noted that the general population contains a significant number of individuals with obesity, so this point should perhaps be moved somewhat to the right). Figure 3 thus demonstrates that by judicious choice of its parameters the model predicts an increase in hyperresponsiveness with BMI that resembles the observed increasing incidence of asthma with obesity. However, this prediction can be made equally on the basis of variations in airway wall stiffness and wall thickness.
Fig. 3.
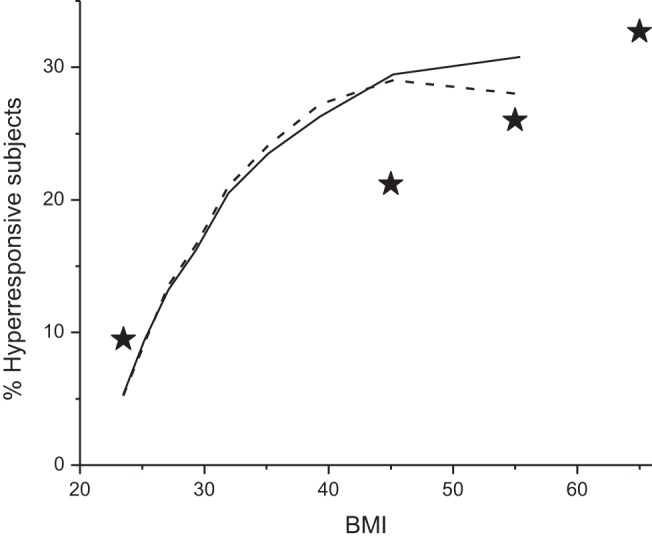
Percentage of the population that is hyperresponsive as a function of BMI predicted by the computational model for kmean = 0.73 and kSD = 0.04 (solid line) (A) and for α having a mean value of 0.08 and a standard deviation of 0.03 (dashed line) (B). ⋆ indicate the mid regions of BMI for corresponding incidence of asthma from (26a). Right most ★ is BMI > 60; left-most ⋆ corresponds to the general population.
DISCUSSION
The present study was motivated by our recent observations that individuals with obesity who develop late-onset TH2-low asthma appear to suffer from a greater degree of peripheral lung derecruitment under baseline conditions (2) and by findings from other laboratories indicative of a similar phenomenon during induced bronchoconstriction in subjects with obesity (11, 16, 35, 37). Having airways that are on the more compliant side of the distribution found in the normal population is one possible explanation for increased peripheral lung collapse in a subset of subjects with obesity. Furthermore, anecdotal experience from the bronchoscopy suite indicates that the airway walls of subjects with obesity and asthma are visually more labile during breathing compared with subjects who are lean, and there are some recent reports of central airway instability associated with obesity (8, 25). Accordingly, we hypothesized that the late-onset TH2-low asthma of obesity could be explained by the appearance of a hyperresponsive phenotype after weight gain in those individuals who find themselves at the more compliant end of the airway stiffness spectrum. This hypothesis derives from the known sensitivity of airway responsiveness to decreases in both Ptp (17) and airway wall stiffness (26). We chose to test the plausibility of this hypothesis in a simple computational model of an elastic airway embedded in elastic parenchyma that we previously showed can recapitulate both effects (3, 4, 26), as illustrated in Fig. 1, A and B, respectively.
What came as a surprise was the finding that, for a given variation in wall stiffness, the hyperresponsive (righthand) end of responsiveness distribution is affected by a decrease in Ptp much more than is the less responsive (lefthand) end, as illustrated in Fig. 2. We must remember that the computational results of the present study were based on data from mice, so extrapolating these results to humans assumes that the basic behavior of the airway smooth muscle and the airway wall is similar. That caveat aside, the results presented in Fig. 2 show how, in principle, a range of airway wall stiffness that is physiologically unproblematic in individuals of normal weight can yield a subpopulation of hyperresponsive individuals in the setting of obesity (16, 34). Figure 3 shows that the rates of asthma predicted by our model are actually quite similar to those rates reported in individuals with obesity (26a): in patients undergoing bariatric surgery, the prevalence of asthma increases from 21% in those with a BMI of 40–50 kg/m2 to 33% in those with a BMI of 60 kg/m2 or more. These results also offer an explanation for the puzzling question of why only some individuals with obesity have asthma when all such individuals are presumably at risk for the reduced lung volumes that come from being severely overweight; the individuals with asthma may be those who have the more compliant airways. It also suggests that those individuals on the compliant end of the airway stiffness spectrum should be specifically targeted for therapies that elevate lung volume, such as continuous positive airway pressure (20, 33).
On the other hand, our study also shows that one can arrive at essentially identical conclusions on the basis of variations in the thickness of the airway wall material lying to the luminal side of the ASM (Figs. 2 and 3). We previously found wall thickness to play a very strong role in airway responsiveness both from modeling and experimentally (5, 39). In the present study, we chose values for the mean and standard deviation of α purely on the grounds that they gave appropriate distributions for Raw (Figs. 2 and 3), although how these values related to wall thickness in a real lung is difficult to say given that the effect of thickness is very much a function of airway size. In any case, our results would appear to demonstrate that, in principle, variations in either wall stiffness or thickness could serve as a mechanism for the appearance of a hyperresponsive phenotype with increasing obesity in the population. However, we previously showed evidence that weight loss reduces the tendency for peripheral airways to close after methacholine challenge in subjects with TH2-low but not TH2-high asthma and obesity (12). Because one would expect airway inflammation and its attendant epithelial hypertrophy to be more pronounced in the latter group, this would seem to mitigate against airway wall thickening as the mechanism behind nonatopic obese asthma.
Of course, the physical properties of the airway wall are not the only phenomena that may be behind the increased peripheral lung collapse seen in subjects with late-onset TH2-low asthma and obesity. Perhaps an even more obvious candidate is variations in the way that adipose tissue is distributed around the body. Those who store fat centrally (in or around the abdomen and mediastinum) might be expected to suffer from greater lung compression and thus increased airway responsiveness compared with those who store it more peripherally on the thighs and buttocks. Exactly how different fat deposition patterns vary in their degrees of lung compression is not known, and we have thus far assumed that this deposition pattern, and hence the degree of consequent reduction in Ptp, is the same for subjects with and without asthma. Nevertheless, central obesity is a risk factor for asthma even after adjusting for BMI (9, 29), and the incidence of TH2-low obese asthma is more likely due to a constellation of factors that act synergistically rather than to any one factor alone.
Another issue that has relevance for the extrapolation of our model findings to human patients is that a change in lung volume due to excess weight in and around the thoracic cavity is not the only factor at play in subjects with late-onset TH2-low obesity and asthma. Adipose tissue is highly metabolically active (36), creating a biological milieu that differs substantially from that in normal weight individuals. Thus far, we have been working on the assumption that airway wall stiffness and thickness both exhibit normal variations in the population that carry over unchanged to the obese state. Alternatively, the altered milieu of the obese state might lead to airway remodeling that manifests as decreased wall stiffness, and this could be the phenomenon that varies between individuals. Equally, an inflammatory state in obesity could increase the thickness of the airway wall as has been demonstrated in allergic mice (39). We cannot distinguish between these various possibilities on the basis of their predicted responsiveness distributions (Fig. 2).
A limitation of our study is that it is based on a computational model that has been fit to data from mice rather than human subjects (14). Our interest in the present study is, of course, in the human lung, but collecting the data necessary to estimate human parameters would probably be impossible for practical and ethical reasons, so there is no way of knowing for sure how the parameter values in the model should be adjusted to represent the human condition. On the other hand, there is also no reason to suppose that the relative dependencies of airway responsiveness on positive end-expiratory pressure would be vastly different in a human compared with a mouse because lung mechanics scale more or less according to body size (6). Also, and of particular relevance for the present study, mouse airways have less cartilage and fewer generations than the human lung (22), which makes the mouse lung mechanically more like a peripheral section of the human lung rather than being simply a version of the entire human on a much smaller scale, and asthma is becoming increasingly recognized as a disease of the lung periphery (19, 24). Thus, although the relationship of our computational results to the condition of human asthma is not entirely clear, this model does account very accurately for the dynamics of airway responsiveness in mice (3, 14) and in rats and rabbits (4), so in an overall sense it appears to capture the essential dependencies of responsiveness on Ptp and the physical properties of the airway wall. There is thus no reason at this point to suppose that the same would not also apply to humans.
Other study limitations include the fact that the computational model itself is based on a highly simplified view of lung anatomy that neglects the branching structure of the airway tree and the fact that airway narrowing can be quite heterogeneous (28). Also, and importantly, we equated having asthma with having airways hyperresponsiveness, but this is only one of the factors contributing to the asthma syndrome and there a few data on the direct relationship between BMI and airways responsiveness. For example, individuals who are severely obese may have such reduced lung volumes that they approach limiting flow during expiration, which could contribute significantly to symptoms (34). Also, increased regional heterogeneity that manifests as ventilation defects occurs as lung volume is reduced, which would further exacerbate symptoms (40). Furthermore, we characterized airway responsiveness in terms of the airway narrowing that occurs in response to a single fixed dose of methacholine, whereas it is usual clinical practice to employ sequentially increasing doses to determine the dose at which a specified decrement in lung function occurs. Nevertheless, a link between BMI and airway responsiveness measured by spirometry has been reported (13), so there is no reason to suppose that BMI would not also be related to increased methacholine responsiveness measured by Raw.
We also made assumptions about the nature of the variation in airway wall stiffness within the population that are critical to our results. Using a value for kmean of 0.73 derived from our previous study in mice (14), we found by trial and error that a value for kSD of 0.04 gave an increase in the prevalence of hyperresponsiveness with increasing BMI (Fig. 3) that is reminiscent of the way that asthma incidence has been reported to increase with BMI (26a). However, kSD = 0.04 also gave rise to a wide range of Raw values for a given Ptp (Fig. 3), which raises the question as to whether such variation is actually seen with the human population. There are few reports of how Raw is distributed within the normal population, and in any case the normal population now includes a significant number of individuals with obesity. Nevertheless, there are indications that the natural variation in airway responsiveness measured by methacholine-induced changes in Raw may be rather wide. For example, McClean et al. (31) reported responsiveness to mannitol measured in terms of airway conductance that varied in subjects without asthma by about one order of magnitude, so the widths of the simulated distributions shown in Fig. 2 may not be unreasonable. The same arguments apply to our modeling of variations in airway wall thickness. It should also be pointed out that airway wall stiffness or thickness could be a risk factor for asthma even for individuals of normal weight. In the present study we arbitrarily assigned the most responsive 5% of the normal weight population as hyperresponsiveness in the present study (Fig. 3) simply because this is the conventional cutoff.
Finally, the results of this modeling study have some significant clinical implications for the management of patients with obesity and asthma. First, the hypothesis that the physical properties of the airway wall play a critical role in the asthma of obesity suggests that those at risk for developing this condition could be identified if airway wall compliance and/or thickness could be assessed in some manner. This could provide special motivation for avoiding excessive weight gain, or for losing weight, in such individuals. There are also some potential therapies that might be aimed at patients with these risk factors. For example, in patients with airways that are more compliant than average, stenting the airways with positive applied pressure, such as that provided by continuous positive airway pressure, is an obvious and relatively innocuous treatment. Indeed this has already received significant attention in the asthma community (10). Finally, there remains the unresolved issue of whether having either abnormally thickened or compliant airways in obesity is simply a matter of genetic bad luck or whether it results from some remodeling process associated with the altered metabolic state associated with obesity; the latter case might be responsive, for example, to long-term anti-inflammatory therapy.
In summary, we used a computational model of an airway contracting within the parenchyma to show that variations in both airway wall stiffness and thickness between individuals, coupled with increasing obesity, can potentially lead to an increasing fraction of the population exhibiting the asthmatic symptom of airways hyperresponsiveness. Although we cannot distinguish between these two possibilities at present, together they offer strong evidence that airway wall structure is involved in TH2-low late-onset asthma in individuals with obesity. Furthermore, we offer an explanation for why TH2-low asthma appears in only a subset of the obese individuals. Indeed, the imposition of a global insult on a distribution of susceptibilities may represent a general mechanism whereby any pathology may appear in only a subset of the entire population.
GRANTS
This work was supported by National Heart, Lung, and Blood Institute Grants R01 HL-103405 and National Institute of General Medical Sciences Grant P30 GM-103532.
DISCLOSURES
No conflicts of interest, financial or otherwise, are declared by the author(s).
AUTHOR CONTRIBUTIONS
Author contributions: J.H.B. and A.E.D. conception and design of research; J.H.B. performed experiments; J.H.B. analyzed data; J.H.B. and A.E.D. interpreted results of experiments; J.H.B. prepared figures; J.H.B. drafted manuscript; J.H.B. and A.E.D. edited and revised manuscript; J.H.B. and A.E.D. approved final version of manuscript.
REFERENCES
- 1.Adler A, Bates JH. A micromechanical model of airway-parenchymal interdependence. Ann Biomed Eng 28: 309–317, 2000. [DOI] [PubMed] [Google Scholar]
- 2.Al-Alwan A, Bates JH, Chapman D, Kaminsky DA, Desarno MJ, Irvin CG, Dixon AE. The non-allergic asthma of obesity: a matter of distal lung compliance. Am J Respir Crit Care Med 189: 1494–1502, 2014. [DOI] [PMC free article] [PubMed] [Google Scholar]
- 3.Bates JH, Cojocaru A, Lundblad LK. Bronchodilatory effect of deep inspiration on the dynamics of bronchoconstriction in mice. J Appl Physiol 103: 1696–1705, 2007. [DOI] [PubMed] [Google Scholar]
- 4.Bates JH, Lauzon AM. Parenchymal tethering, airway wall stiffness, and the dynamics of bronchoconstriction. J Appl Physiol (1985) 102: 1912–1920, 2007. [DOI] [PubMed] [Google Scholar]
- 5.Bates JH, Stevenson CA, Aliyeva M, Lundblad LK. Airway responsiveness depends on the diffusion rate of methacholine across the airway wall. J Appl Physiol 112: 1670–1677, 2012. [DOI] [PMC free article] [PubMed] [Google Scholar]
- 6.Bates JHT, Irvin CG, Farre R, Hantos Z. Oscillation mechanics of the respiratory system. In: Handbook of Physiology. Bethesda, MD: Am Physiol Soc, 2011, p. 1233–1272. [DOI] [PubMed] [Google Scholar]
- 7.Blanc FX, Coirault C, Salmeron S, Chemla D, Lecarpentier Y. Mechanics and crossbridge kinetics of tracheal smooth muscle in two inbred rat strains. Eur Respir J 22: 227–234, 2003. [DOI] [PubMed] [Google Scholar]
- 8.Boiselle PM, Litmanovich DE, Michaud G, Roberts DH, Loring SH, Womble HM, Millett ME, O'Donnell CR. Dynamic expiratory tracheal collapse in morbidly obese COPD patients. COPD 10: 604–610, 2013. [DOI] [PubMed] [Google Scholar]
- 9.Brumpton B, Langhammer A, Romundstad P, Chen Y, Mai XM. General and abdominal obesity and incident asthma in adults: the HUNT study. Eur Respir J 41: 323–329, 2013. [DOI] [PubMed] [Google Scholar]
- 10.Busk M, Busk N, Puntenney P, Hutchins J, Yu Z, Gunst SJ, Tepper RS. Use of continuous positive airway pressure reduces airway reactivity in adults with asthma. Eur Respir J 41: 317–322, 2013. [DOI] [PMC free article] [PubMed] [Google Scholar]
- 11.Chapman DG, Berend N, King GG, Salome CM. Increased airway closure is a determinant of airway hyperresponsiveness. Eur Respir J 32: 1563–1569, 2008. [DOI] [PubMed] [Google Scholar]
- 12.Chapman DG, Irvin CG, Kaminsky DA, Forgione PM, Bates JH, Dixon AE. Influence of distinct asthma phenotypes on lung function following weight loss in the obese. Respirology 19: 1170–1177, 2014. [DOI] [PMC free article] [PubMed] [Google Scholar]
- 13.Chinn S, Jarvis D, Burney PS, European Community Respiratory Health. Relation of bronchial responsiveness to body mass index in the ECRHS European Community Respiratory Health Survey. Thorax 57: 1028–1033, 2002. [DOI] [PMC free article] [PubMed] [Google Scholar]
- 14.Cojocaru A, Irvin CG, Haverkamp HC, Bates JH. Computational assessment of airway wall stiffness in vivo in allergically inflamed mouse models of asthma. J Appl Physiol (1985) 104: 1601–1610, 2008. [DOI] [PubMed] [Google Scholar]
- 16.Deesomchok A, Fisher T, Webb KA, Ora J, Lam YM, Lougheed MD, O'Donnell DE. Effects of obesity on perceptual and mechanical responses to bronchoconstriction in asthma. Am J Respir Crit Care Med 181: 125–133, 2010. [DOI] [PubMed] [Google Scholar]
- 17.Ding DJ, Martin JG, Macklem PT. Effects of lung volume on maximal methacholine-induced bronchoconstriction in normal humans. J Appl Physiol (1985) 62: 1324–1330, 1987. [DOI] [PubMed] [Google Scholar]
- 18.Dixon AE, Pratley RE, Forgione PM, Kaminsky DA, Whittaker-Leclair LA, Griffes LA, Garudathri J, Raymond D, Poynter ME, Bunn JY, Irvin CG. Effects of obesity and bariatric surgery on airway hyperresponsiveness, asthma control, and inflammation. J Allergy Clin Immunol 128: 508–515, 2011. [DOI] [PMC free article] [PubMed] [Google Scholar]
- 19.Farah CS, King GG, Brown NJ, Peters MJ, Berend N, Salome CM. Ventilation heterogeneity predicts asthma control in adults following inhaled corticosteroid dose titration. J Allergy Clin Immunol 130: 61–68, 2012. [DOI] [PubMed] [Google Scholar]
- 20.Ferguson GT, Benoist J. Nasal continuous positive airway pressure in the treatment of tracheobronchomalacia. Am Rev Respir Dis 147: 457–461, 1993. [DOI] [PubMed] [Google Scholar]
- 21.Hanks BS, Stephens NL. Mechanics and energetics of lengthening of active airway smooth muscle. Am J Physiol Cell Physiol 241: C42–C46, 1981. [DOI] [PubMed] [Google Scholar]
- 22.Irvin CG, Bates JH. Measuring the lung function in the mouse: the challenge of size. Respir Res 4: 4, 2003. [DOI] [PMC free article] [PubMed] [Google Scholar]
- 23.Jones RL, Nzekwu MM. The effects of body mass index on lung volumes. Chest 130: 827–833, 2006. [DOI] [PubMed] [Google Scholar]
- 24.Kaminsky DA. Peripheral lung mechanics in asthma: exploring the outer limits. Pulm Pharmacol Ther 24: 199–202, 2011. [DOI] [PubMed] [Google Scholar]
- 25.Kandaswamy C, Bird G, Gill N, Math E, Vempilly JJ. Severe tracheomalacia in the ICU: identification of diagnostic criteria and risk factor analysis from a case control study. Resp Care 58: 340–347, 2013. [DOI] [PubMed] [Google Scholar]
- 26.Khan MA, Ellis R, Inman MD, Bates JH, Sanderson MJ, Janssen LJ. Influence of airway wall stiffness and parenchymal tethering on the dynamics of bronchoconstriction. Am J Physiol Lung Cell Mol Physiol 299: L98–L108, 2010. [DOI] [PMC free article] [PubMed] [Google Scholar]
- 26a.LABS Writing Group, Belle SH, Chapman W, Courcoulas AP, Flum DR, Gagner M, Inabnet WB, King WC, Mitchell JE, Patterson EJ, Thirlby R, Wolfe BM, Yanovski SZ. Relationship of body mass index with demographic and clinical characteristics in the Longitudinal Assessment of Bariatric Surgery (LABS). Surg Obes Relat Dis 4: 474–480, 2008. [DOI] [PMC free article] [PubMed] [Google Scholar]
- 27.Lai-Fook SJ. A continuum mechanics analysis of pulmonary vascular interdependence in isolated dog lobes. J Appl Physiol 46: 419–429, 1979. [DOI] [PubMed] [Google Scholar]
- 28.Lauzon AM, Bates JH, Donovan G, Tawhai M, Sneyd J, Sanderson MJ. A multi-scale approach to airway hyperresponsiveness: from molecule to organ. Front Physiol 3: 191, 2012. [DOI] [PMC free article] [PubMed] [Google Scholar]
- 29.Leone N, Courbon D, Berr C, Barberger-Gateau P, Tzourio C, Alperovitch A, Zureik M. Abdominal obesity and late-onset asthma: cross-sectional and longitudinal results: the 3C study. Obesity (Silver Spring) 20: 628–635, 2012. [DOI] [PubMed] [Google Scholar]
- 30.Mahadev S, Salome CM, Berend N, King GG. The effect of low lung volume on airway function in obesity. Respir Physiol Neurobiol 188: 192–199, 2013. [DOI] [PubMed] [Google Scholar]
- 31.McClean MA, Htun C, King GG, Berend N, Salome CM. Cut-points for response to mannitol challenges using the forced oscillation technique. Resp Med 105: 533–540, 2011. [DOI] [PubMed] [Google Scholar]
- 32.Mead J, Takishima T, Leith D. Stress distribution in lungs: a model of pulmonary elasticity. J Appl Physiol 28: 596–608, 1970. [DOI] [PubMed] [Google Scholar]
- 33.Murgu SD, Colt HG. Tracheobronchomalacia and excessive dynamic airway collapse. Respirology 11: 388–406, 2006. [DOI] [PubMed] [Google Scholar]
- 34.Salome CM, King GG, Berend N. Physiology of obesity and effects on lung function. J Appl Physiol 108: 206–211, 2010. [DOI] [PubMed] [Google Scholar]
- 35.Salome CM, Munoz PA, Berend N, Thorpe CW, Schachter LM, King GG. Effect of obesity on breathlessness and airway responsiveness to methacholine in non-asthmatic subjects. Int J Obes 32: 502–509, 2008. [DOI] [PubMed] [Google Scholar]
- 36.Sideleva O, Suratt BT, Black KE, Tharp WG, Pratley RE, Forgione P, Dienz O, Irvin CG, Dixon AE. Obesity and asthma: an inflammatory disease of adipose tissue not the airway. Am J Respir Crit Care Med 186: 598–605, 2012. [DOI] [PMC free article] [PubMed] [Google Scholar]
- 37.Sutherland TJ, Cowan JO, Taylor DR. Dynamic hyperinflation with bronchoconstriction: differences between obese and nonobese women with asthma. Am J Respir Crit Care Med 177: 970–975, 2008. [DOI] [PubMed] [Google Scholar]
- 38.van Huisstede A, Castro Cabezas M, van de Geijn GJ, Mannaerts GH, Njo TL, Taube C, Hiemstra PS, Braunstahl GJ. Underdiagnosis and overdiagnosis of asthma in the morbidly obese. Resp Med 107: 1356–1364, 2013. [DOI] [PubMed] [Google Scholar]
- 39.Wagers S, Lundblad LK, Ekman M, Irvin CG, Bates JH. The allergic mouse model of asthma: normal smooth muscle in an abnormal lung? J Appl Physiol (1985) 96: 2019–2027, 2004. [DOI] [PubMed] [Google Scholar]
- 40.Winkler T, Venegas JG. Complex airway behavior and paradoxical responses to bronchoprovocation. J Appl Physiol (1985) 103: 655–663, 2007. [DOI] [PubMed] [Google Scholar]