

Abstract
We assessed the impact of energy deficiency on menstrual function using controlled feeding and supervised exercise over four menstrual cycles (1 baseline and 3 intervention cycles) in untrained, eumenorrheic women aged 18–30 yr. Subjects were randomized to either an exercising control (EXCON) or one of three exercising energy deficit (ED) groups, i.e., mild (ED1; −8 ± 2%), moderate (ED2; −22 ± 3%), or severe (ED3; −42 ± 3%). Menstrual cycle length and changes in urinary concentrations of estrone-1-glucuronide, pregnanediol glucuronide, and midcycle luteinizing hormone were assessed. Thirty-four subjects completed the study. Weight loss occurred in ED1 (−3.8 ± 0.2 kg), ED2 (−2.8 ± 0.6 kg), and ED3 (−2.6 ± 1.1 kg) but was minimal in EXCON (−0.9 ± 0.7 kg). The overall sum of disturbances (luteal phase defects, anovulation, and oligomenorrhea) was greater in ED2 compared with EXCON and greater in ED3 compared with EXCON AND ED1. The average percent energy deficit was the main predictor of the frequency of menstrual disturbances (f = 10.1, β = −0.48, r2 = 0.23, P = 0.003) even when weight loss was included in the model. The estimates of the magnitude of energy deficiency associated with menstrual disturbances ranged from −22 (ED2) to −42% (ED3), reflecting an energy deficit of −470 to −810 kcal/day, respectively. This is the first study to demonstrate a dose-response relationship between the magnitude of energy deficiency and the frequency of exercise-related menstrual disturbances; however, the severity of menstrual disturbances was not dependent on the magnitude of energy deficiency.
Keywords: energy balance, menstrual cycle disturbances, luteal phase, amenorrhea, oligomenorrhea
menstrual irregularities in physically active women and female athletes are observed frequently. Commonly reported irregularities and corresponding prevalence rates include luteal phase defects (29%), anovulation (20%), oligomenorrhea (7%), and amenorrhea (37%) (12). A large body of evidence in a variety of mammalian species has demonstrated a causal link between chronic energy deficiency and the suppression of reproductive function involving the central inhibition of gonadotropin-releasing hormone (GnRH) pulsatility (34). In humans, long-term energy deficiency can result in functional hypothalamic amenorrhea (FHA) and therefore decrease estrogen exposure, diminishing estrogen's impact on bone, reproductive, and cardiovascular regulation, often resulting in osteopenia (29, 34), stress fractures (1, 3, 5), transient infertility, dyslipidemia, and impaired endothelial function (14, 15, 26). Prospective studies support a causal role of low energy availability on the suppression of reproductive function that commonly occurs in physically active women and female athletes (6, 20, 39).
Although the importance of energy availability for the maintenance of reproductive function has been established (34), many important translational issues have not been addressed. Menstrual cycle disturbances, secondary to an energy deficit, occur along a continuum of severity ranging from subtle disturbances such as luteal phase defects (short or inadequate luteal phases) to anovulation, oligomenorrhea (menstrual cycle length of 36–90 days), and the most severe disturbance, amenorrhea (absence of menses for >90 days) (6, 12). Although short-term experiments (i.e., 5 days), which reduce energy availability below a threshold of 30 kcal·kg−1·fat-free mass−1 with the combination of diet and exercise, have demonstrated suppressed luteinizing hormone (LH) pulsatility (20) as well as a host of other metabolic alterations (i.e., decreased IGF-I, insulin, and leptin concentrations) (20), these studies do not address energy deficiency as it relates to disruptions in follicular development, ovulation, or luteal function, which may occur when exposure to an energy deficit occurs over a single menstrual cycle or multiple cycles. Furthermore, they do not address the time frame over which such disturbances develop or the association between a given level of energy deficiency and the severity of menstrual disturbances. In the seminal study by Bullen et al. (6), menstrual disturbances were induced by an abrupt onset of exercise and were exacerbated by weight loss; however, the magnitude of energy deficiency was not quantified. To address these issues, we conducted a randomized prospective experiment to assess the impact of varying levels of energy deficiency, which was created through a combination of caloric restriction and exercise, on menstrual function in young, premenopausal, sedentary women. We hypothesized that there would be a dose-response relation between the induction of menstrual disturbances (luteal phase defects, anovulation, and oligomenorrhea) and the magnitude of energy deficiency such that the intervention groups experiencing a greater energy deficit would incur a significantly greater incidence of menstrual cycle disturbances. As well, we hypothesized that the intervention groups experiencing a greater energy deficit would incur a greater incidence of more severe menstrual cycle disturbances.
MATERIALS AND METHODS
Experimental design overview.
This study utilized a randomized prospective design that employed controlled feeding and supervised laboratory-based exercise over the course of three menstrual cycles in young, untrained, premenopausal, eumenorrheic women. The study was conducted over 3 years, with yearly cohorts recruited in the fall of the academic year and followed until the end of spring semester. The controlled feeding and exercise training began after the screening and baseline periods, with each period lasting one menstrual cycle. All phases of the intervention were anchored to subjects' menstrual cycles, and each study phase consisted of one menstrual cycle (intervention cycle 1, intervention cycle 2, and intervention cycle 3). A poststudy period of 1 wk where diet and exercise remained controlled allowed for postintervention measurements. The study design is illustrated in Table 1. Group assignments were based on varying levels of energy deficiency created through a combination of caloric restriction and exercise such that one group remained in energy balance and four groups were in different degrees of an energy deficit. Repeated assessments of menstrual status, metabolic status, and body composition were conducted.
Table 1.
Experimental procedures
| Screening | Baseline Cycle | Intervention Cycle 1 | Intervention Cycle 2 | Intervention Cycle 3 | Poststudy (Cycle Days 1–7) |
|---|---|---|---|---|---|
| 3-Day diet log | 3-Day diet log | 3-Day diet log | 3-Day diet log | 3-Day diet log | 3-Day diet log |
| Body weight | Body weight | Body weight | Body weight | Body weight | Body weight |
| Menstrual calendar | Menstrual calendar | Menstrual calendar | Menstrual calendar | Menstrual calendar | Menstrual calendar |
| Daily Urine collection | Daily urine collection | Daily urine collection | Daily urine collection | Daily urine collection | Daily urine collection |
| Body composition | Body composition | Body composition | Body composition | ||
| Metabolic blood sample | Metabolic blood sample | Metabolic blood sample | |||
| Ovulation detection | Ovulation detection | Supervised exercise and controlled feeding | Supervised exercise and controlled feeding | Supervised exercise and controlled feeding | Supervised exercise and controlled feeding |
| Midluteal serum progesterone | Midluteal serum progesterone | ||||
| Medical history | Calibration period (7 days) to determine energy needs | ||||
| Menstrual history | |||||
| Physical activity | |||||
| Eating attitudes | |||||
| CBC/chemistry | |||||
| V̇o2max | V̇o2max | V̇o2max | V̇o2max | V̇o2max | V̇o2max |
| Panel | RMR | RMR | RMR | RMR | RMR |
| Endocrine Screen | Activity kcal | Activity kcal | Activity kcal | Activity kcal | Activity kcal |
| Physical Exam | |||||
| Psychological Interview | Randomization to experimental groups | Exercise kcal | Exercise kcal | Exercise kcal | Exercise kcal |
| Menstrual cycle 1 | Menstrual cycle 2 | Menstrual cycle 3 | Menstrual cycle 4 | Menstrual cycle 5 | Menstrual cycle 6 |
RMR, resting metabolic rate; CBC, complete blood count; V̇o2max, maximal aerobic capacity. Note: midstudy body composition testing occurred during intervention cycle 2 for most subjects, but in some subjects it occurred during intervention cycle 3.
Subjects.
Inclusion criteria for the study included 1) no history of serious medical conditions, 2) no current evidence of disordered eating or history of an eating disorder, 3) age 18–30 yr, 4) weight 45–75 kg, 5) body fat 15–35%, 6) BMI 18–25 kg/m2, 7) nonsmoking, 8) no medication use that would alter metabolic hormone levels, 9) no significant weight loss/gain (±2.3 kg) in the last year, 10) <1 h/wk of purposeful aerobic exercise for the past 6 mo, 11) not taking exogenous hormonal contraceptives for the past 6 mo, and 12) documentation of at least two ovulatory menstrual cycles during screening. Each subject was informed of the purpose, procedures, and potential risks of participation in the study before signing an informed consent form approved by the Penn State University Biomedical Institutional Review Board. Subjects were recruited in three yearly cohorts using fliers and newspaper and radio ads that targeted the university community in the fall of the academic year.
Screening and baseline.
Screening procedures assessed medical history, menstrual history (based on self-report from the prior 12 mo), current and past physical activity (16), eating attitudes and behaviors, anthropometrics, physical health, and psychological status. Screening and baseline periods were initiated on day 1 of subjects' menstrual cycles and lasted from two to three menstrual cycles. Screening blood samples were obtained via venipuncture and were analyzed for a complete blood count (CBC), basic chemistry panel, and an endocrine screen to rule out hormonal or metabolic disease. Each subject underwent a physical examination by a General Clinical Research Center (GCRC) clinician and was instructed on how to complete a 3-day diet log by a GCRC dietician. An interview to rule out current clinical eating disorders, assess the risk of developing disordered eating behaviors, and rule out existing major axis I psychiatric disorders was performed under the direction of a clinical psychologist. Menstrual status was determined using menstrual calendars, ovulation detection kits (First Response; Tambrands), and three midluteal serum progesterone measurements (at least one >5.0 ng/ml) during the baseline cycle to confirm ovulation. Menstrual calendars were used to document menstrual bleeding (and therefore, cycle length) and the occurrence of cramps or other menstrual symptoms.
If subjects were deemed to be in good health and had at least two successive ovulatory cycles, they were randomized into subject groups.
Subject groupings.
During the baseline period, subjects were randomly assigned to an experimental group for intervention cycles 1, 2, and 3 of the study. The goal of the subject groupings was to test the impact of varying levels of an energy deficit created by the combination of caloric restriction and exercise on menstrual function. They were assigned to either a control group that did not exercise and consumed an amount of calories estimated to maintain body weight, a control group that exercised but received extra food calories to remain in energy balance [exercising controls (EXCON)], or one of four groups that exercised and were prescribed reduced energy intake to create varying levels of an energy deficit [energy deficit (ED) groups]. ED groups were defined by an energy prescription comprised from the quantity of calories provided as food and the quantity of calories expended as exercise. ED groups were prescribed targeted reductions in energy intake (7 days/wk) compared with their baseline energy needs ranging from −15 to −30% in combination with prescribed increases in exercise energy expenditure (5 days/wk) equivalent in calories from +15 to +30% of baseline energy needs. Specifically, the initial four ED groups were intended to represent 1) an increase of 15% kcal of exercise (15% deficit), 2) an increase of 30% kcal of exercise (30% deficit), 3) a decrease of 15% in dietary intake combined with an increase of 15% of exercise, (30% deficit), and 4) a decrease of 30% in dietary intake combined with an increase of 30% kcal of exercise (60% deficit). This resulted in actual calculated daily energy deficits ranging from −9 to −42% of baseline energy needs calculated as follows: reduction in food intake (kcal) = %reduction in dietary intake/100 × baseline energy needs, exercise energy expenditure (kcal) = %increase in exercise energy expenditure/100 × baseline energy needs, total energy deficit (kcal) = reduction in food intake (kcal) + exercise energy expenditure (kcal), and energy deficit (%) = 100 − (total energy deficit/baseline energy needs × 100).
Data for the two groups intended to have a 30% deficit were combined in the present analyses to represent a single energy deficit group, as the actual daily energy deficits calculated for these two groups were not significantly different (i.e., −20 ± 8 and −28 ± 10%). Data for the control group that did not exercise are not presented in the current analyses, as the most appropriate comparison group to test the stated hypotheses was the EXCON group. Therefore, data are presented from the EXCON and three energy deficit groups, i.e., ED1, ED2, and ED3, that exhibited increasing average energy deficits of −9.5 ± 1.8, −22.6 ± 2.5, and −42.4 ± 7.9%, respectively (P < 0.05; ED1 vs. ED2, ED2 vs. ED3, and ED1 vs. ED3). The exercise and diet intervention lasted the equivalent of three menstrual cycles (intervention cycles 1–3) after baseline for each subject, with the beginning of the intervention falling on the first day of menses (intervention cycle 1).
Dropouts.
One-hundred nine subjects met all screening criteria and began the baseline phase of the study. Forty-seven subjects were excluded during the baseline period, mostly because they experienced subtle menstrual disturbances, i.e., luteal phase defects and/or short or long cycle lengths. Sixty-two subjects were randomized into experimental groups, including the control group that did not exercise (data not reported). Forty subjects completed the study in the EXCON and ED1–3 groups, and 13 subjects in the control group did not exercise (not included in present analysis). The dropout rate during the intervention was 14.5%. Dropouts differed significantly in some descriptive characteristics; i.e., they were older (22 ± 1 vs. 20 ± 0.3 yr, P < 0.05) and taller (170 ± 3 vs. 164 ± 1 cm, P < 0.05) and had a higher percentage of body fat (28.3 ± 0.8 vs. 24.2 ± 1.5%, P < 0.05). Six additional subjects' data were not included in the current analyses because they exhibited a luteal phase disturbance or an oligomenorrheic cycle (≥36 days) during their baseline cycle that could be determined only after the study was completed and all urinary assays and detailed analyses of menstrual calendars and menstrual disturbances were performed. The subjects who did not complete intervention or were eliminated for menstrual disturbances in the baseline cycle were as follows: for EXCON, one dropout and one eliminated from analyses; for ED1, three dropouts and three eliminated from analyses; for ED2, four dropouts and one eliminated from analyses; and for ED3, one dropout and one eliminated from analyses. Thus the final number for analysis was 34 subjects in the following groups: EXCON (n = 8), ED1 (n = 6), ED2 (n = 12), and ED3 (n = 8).
Assessment of baseline energy needs.
We assessed baseline energy needs during the baseline cycle. Twenty-four-hour energy expenditure was assumed to represent baseline energy needs, as all subjects were weight stable (±1.5 kg) during screening. To determine 24-h energy expenditure, resting metabolic rate (RMR) (kcal/24 h) and calories attributable to nonexercise physical activity throughout the day were summed. RMR was measured once during days 1–7 of the baseline cycle with indirect calorimetry, using previously reported methods (17). Subjects wore a research accelerometer (RT3; Stayhealthy, Monrovia, CA) for 24 h/day (except during training bouts, swimming, and bathing) during the first 7 days of the follicular phase of the baseline cycle for the assessment of nonexercise physical activity (PA) caloric expenditure (21, 31). The calories from the RMR and the nonexercise PA calories were added together. This sum was operationally defined as the baseline energy needs calorie level (17). This calorie level was verified and adjusted if body weight varied during a 1-wk “calibration” period during baseline (see below).
Determination of caloric intake during the intervention.
Depending on the group assignment (EXCON, ED1, ED2, or ED3), the prescribed dietary intake (intake, kcal) for the intervention was calculated as a percentage reduction from the estimate of baseline energy needs as determined at the end of the calibration period (described below). All food consumed during the study was prepared and weighed to the nearest gram to achieve the desired calorie level by GCRC metabolic kitchen staff. Energy content of prepared food items was verified with bomb calorimetry by mixing and grinding each day's menu items and then burning the food for that day in the calorimeter. This was repeated for each of the days' food from the 8-day menu rotation. Subjects were required to eat two of three meals per day during the week at the GCRC dining room. Dinner meals, a daily snack, and weekend meals were packed out. Intake was comprised of 55% carbohydrates, 30% fat, and 15% protein. The dietary protocol utilized an 8-day meal rotation. All subjects were also prescribed a multivitamin. The subjects were fed for 7 days during baseline, and ±100-kcal adjustments in intake were made if weight changed ±0.5 kg at the middle or end of the calibration week. To meet the target level of intake during the intervention, food intake was either increased or decreased according to group assignment. Subjects were instructed to eat all and only the food provided to them by the study. Any uneaten food was reweighed and recorded for later subtraction from the intake total. Eating food not provided by the study was highly discouraged, but if this occurred, extra food was recorded on a log sheet. Intake and macronutrient composition were calculated using Nutritionist Pro (First Data Bank, Indianapolis, IN).
Estimation of energy balance during the intervention.
To estimate energy balance during the intervention, measurements of intake, RMR, nonexercise PA, and exercise training energy expenditure in kcal (Ex) were repeated during the intervention, and these data were used to calculate daily values for energy balance. The calories for RMR, nonexercise PA, and Ex were summed to represent 24-h energy expenditure. RMR was assessed during the follicular phase of baseline, intervention cycle 2, and the poststudy period. Nonexercise PA was calculated every other week from subjects wearing the RT3 for 7 days, 24 h/day (except during training bouts, swimming, and bathing). Ex was measured during each training bout (see below). Intake was calculated daily (see below). Energy balance was thus calculated daily as [intake (kcal) − (RMR + nonexercise PA + Ex) (kcal)] using the most recent data available. Calculations for energy balance were updated continually throughout the intervention as new measurements were obtained.
Metabolic hormones.
Fasting blood samples were obtained during the baseline, intervention cycle 2, and the poststudy period for the measurement of triiodothyronine (T3; ng/dl) and insulin-like growth factor-I (IGF-I; ng/ml). The purpose of these measurements was to provide an additional laboratory measurement of metabolic status.
Exercise training.
All exercise training took place in Noll laboratory and was supervised by trainers. Exercising groups performed aerobic exercise five times/wk at 70–80% of maximum heart rate as determined from tests of maximal aerobic capacity (V̇o2 max). The duration of exercise (minutes) was equal to that required to expend a prescribed number of calories and ranged from 20 to 75 min, depending on the prescription. The total amount of calories expended during each exercise session was measured using the OwnCal feature on the Polar S610 heart rate monitor (Polar Electro Oy, Kempele, Finland) (10). The heart rate monitors were continually reinitialized twice weekly with the most recent values of weight, maximum heart rate, V̇o2 max, and age. Modes of exercise included treadmill running, elliptical machine exercise, stair stepping, and stationary cycling. When subjects came to the training room, they removed their RT3 monitors (used to monitor nonexercise PA kcal) and were given their polar heart rate monitor. When they finished their workout, they removed the polar and put the RT3 back on.
Menstrual status.
Menstrual cycle length and menstrual symptoms were documented throughout the study with menstrual calendars. Daily urine samples were collected during the baseline and intervention cycles 1–3 according to previously published methods (36). Estrogen and progesterone exposure, confirmation of ovulatory status, the presence or absence of luteal phase defects, and the lengths of the follicular and luteal phases were determined by analysis of daily urinary metabolites of estrone-1-glucuronide (E1G), pregnanediol glucuronide (PdG), and midcycle LH after completion of the study using previously published methods (11). The menstrual disturbances characterized included luteal phase defects, oligomenorrheic cycles, and anovulatory cycles. Two types of luteal phase defects, short luteal phases (<10 days in length) and inadequate luteal phases (PdG peak concentration <5.0 μg/ml), were assessed (11, 32). Oligomenorrheic cycles were defined as cycles ≥36 days in length (12). Anovulatory cycles were defined as cycles lacking an adequate preovulatory E1G peak, an absence of a midcycle LH surge, and no luteal rise in PdG above 2.49 μg/ml (11, 32). We quantified menstrual cycle disturbances two ways. For each subject, the sum of the total number of menstrual disturbances experienced over the course of three menstrual cycles was calculated. For example, a subject who experienced an anovulatory cycle in intervention cycle 2 and an oligomenorrheic cycle that also had a short luteal phase in intervention cycle 3 would have a sum of total disturbances of three. We also tabulated whether each subject experienced a menstrual disturbance or not in each of the intervention cycles (intervention cycles 1–3). This allowed us to determine the number of subjects in each experimental group that experienced at least one occurrence of each type of menstrual disturbance. We expressed this as the number of subjects with a given disturbance/total number of subjects, which was expressed as a ratio and as a percentage.
Body composition and body weight measurements.
Body weight was measured to the nearest 0.01 kg using a digital scale (Seca, Hamburg, Germany) twice/wk on the morning before eating breakfast by the GCRC dietician while subjects wore a standard shorts and tee shirt. During baseline, once during intervention cycle 2 or 3, and once during the poststudy period, subjects' body composition was determined once during the follicular phase (days 1–7) using underwater weighing, as described previously (17).
Resting metabolic rate.
RMR was measured between 0600 and 1000 following an overnight fast. Upon arrival at the laboratory, the subject lay in a supine position on a bed for 20–30 min to acclimate to room temperature and undergo familiarization with the equipment and procedures. A ventilated hood was then placed over the subject's head for 30 min, and metabolic rate was measured using previously published methods (17).
Aerobic capacity.
V̇o2 max was determined during screening, baseline, each intervention cycle, and poststudy. V̇o2 max was determined from an incremental exercise test on a treadmill-to-volitional exhaustion using the Modified Astrand Protocol, using indirect calorimetry (Sensormedics Metabolic Cart model no. 229; Sensormedics, Yorba Linda, CA) (28).
Blood sampling.
For all blood samples, subjects were fasted overnight prior to blood collection, which occurred between 0700 and 1000 at the GCRC after lying supine for ≥15 min. Blood was allowed to clot for 1 h prior to centrifugation. Serum was stored at −20°C until later analysis.
Biochemical analyses.
CBC/Chem 24 and the endocrine screen determinations were completed by Quest Diagnostics (Lyndhurst, NJ). The endocrine screen included LH, follicle-stimulating hormone, prolactin, progesterone, estradiol, thyroxine and thyroid-stimulating hormone. Circulating progesterone was measured using a radioimmunoassay (RIA) on serum samples (Diagnostics Products, Los Angeles, CA). The sensitivity of this assay is 0.02 ng/ml. The intra- and interassay coefficients of variation for the high controls were 2.7 and 3.9%, respectively. The intra- and interassay coefficients of variation for the low controls were 8.8 and 9.7%, respectively. Competitive enzyme immunoassays were used to measure the major urinary estrogen metabolite, E1G, and PdG according to previously published methods (23). Urinary LH was measured using RIA (Diagnostic Products). The sensitivity of this assay is 0.15 mIU/ml. The intra- and interassay coefficients of variation for the high controls were 1.0 and 3.4%, respectively. The intra- and interassay coefficients of variation for the low controls were 1.6 and 7.1%, respectively. Circulating total T3 was measured using a radioimmunoassay for total T3 (Diagnostics Products). The sensitivity of this assay is 7 ng/dl. The intra-assay and interassay coefficients of variation for the high controls were 3.1 and 5.7%, respectively; the intra-assay and interassay coefficients of variation for the low controls were 8.9 and 10.0%, respectively. IGF-I was measured using a RIA on extracted serum samples (Nichols Institute Diagnostics, San Juan Capistrano, CA). The sensitivity of this assay is 0.06 ng/ml. The intra- and interassay coefficients of variation for the high controls were 3.0 and 8.4%, respectively; the intra- and interassay coefficients of variations for the low controls were 2.4 and 5.2%, respectively. All biochemical determinations were assayed in duplicate, and all samples from a given subject were measured in the same assay.
Statistics and data analysis.
All data sets were tested for nonnormality, and outliers before statistical hypothesis tests were performed. Outliers detected were rejected and thus excluded from analysis. Data analyzed included those from all subjects who completed the study. Analyses for normally distributed data were conducted using general linear model procedures for repeated measurements, with four groups to test for changes over time, group differences, and time × group interactions. Post hoc analyses to isolate main effects were conducted using the Bonferroni correction. Analyses for the frequency of menstrual disturbances, i.e., the sum of total disturbances and the sum for each type of disturbance, were performed using a one-way ANOVA. Post hoc testing to isolate main effects was performed using t-tests, with least significant difference comparing each group with the EXCON group. To determine differences between groups in the occurrence of menstrual disturbances in each cycle of the intervention, chi-square analyses were conducted. To determine predictors of menstrual disturbances when all subjects were considered together, stepwise linear regression analyses were performed. Data were analyzed using SPSS for Windows (version 18.0; SPSS, Chicago, IL). All data are expressed as means ± SE, and P < 0.05 was considered statistically significant.
RESULTS
Descriptive characteristics.
Descriptive data from all subjects are illustrated in Table 2. There were no significant differences among ED groups in parameters of age, anthropometrics, initial V̇o2 max, reproductive maturity, menstrual cycle length, initial fitness, or caloric intake.
Table 2.
Baseline demographic characteristics of study subjects categorized by group
| EXCON (n = 8) | ED1 (n = 6) | ED2 (n = 12) | ED3 (n = 8) | P Value Group Effect | |
|---|---|---|---|---|---|
| Demographics | |||||
| Age, yr | 20.5 ± 0.4 | 20.5 ± 0.8 | 20.2 ± 0.6 | 20.4 ± 0.7 | 0.989 |
| Height, cm | 165 ± 3.0 | 165 ± 3.0 | 164 ± 2.0 | 164 ± 2.0 | 0.945 |
| Weight, kg | 57.9 ± 2.2 | 56.4 ± 1.2 | 59.8 ± 1.2 | 59.8 ± 1.5 | 0.385 |
| BMI, kg/m2 | 21.4 ± 1.3 | 20.7 ± 0.7 | 22.2 ± 0.5 | 22.4 ± 0.6 | 0.496 |
| Body Composition | |||||
| %Body fat | 26.5 ± 2.4 | 27.4 ± 1.5 | 28.8 ± 1.0 | 29.6 ± 1.3 | 0.528 |
| Fat mass, kg | 15.6 ± 2.0 | 15.5 ± 1.2 | 17.3 ± 0.8 | 17.8 ± 1.5 | 0.511 |
| Fat-free mass, kg | 42.3 ± 1.0 | 40.9 ± 0.6 | 42.6 ± 1.0 | 42.1 ± 1.2 | 0.729 |
| Reproductive Characteristics | |||||
| Age at menarche, yr | 12.3 ± 0.7 | 12.2 ± 0.2 | 11.9 ± 0.3 | 12 ± 1.0 | 0.949 |
| Baseline cycle length, days | 28.6 ± 0.9 | 27.8 ± 0.6 | 28.7 ± 0.5 | 30.2 ± 0.8 | 0.165 |
| Training/diet characteristics | |||||
| V̇o2peak, ml·kg−1·min−1 | 36.1 ± 1.4 | 38.4 ± 2.1 | 37.6 ± 1.4 | 38.1 ± 1.7 | 0.797 |
| Baseline caloric intake, kcala | 1,548 ± 195 | 2,150 ± 271 | 2,032 ± 154 | 1,881 ± 177 | 0.198 |
| Energy Balance Parameters | |||||
| RMR, kcal/24 h | 1,205 ± 57 | 1,293 ± 27 | 1,285 ± 64 | 1,242 ± 62 | 0.732 |
| Nonexercise PA, kcal/24 h | 593 ± 64 | 576 ± 47 | 737 ± 68 | 623 ± 64 | 0.276 |
| 24-h Energy Expenditure, kcal | 1,797 ± 92 | 1,870 ± 53 | 2,021 ± 105 | 1,865 ± 77 | 0.341 |
Values are expressed as means ± SE. EXCON, exercise controls; ED, energy deficit (groups 1–3); PA, physical activity.
Data from 3-day diet logs.
Compliance to diet and exercise prescriptions.
Prescribed caloric intake and actual caloric intake varied <35 kcal/wk during the intervention, and no differences in this parameter were found among groups. With respect to exercise training, 95% of the subjects consistently reached their prescribed exercise kilocalorie expenditure per week and target exercise intensity.
Energy balance parameters.
Table 3 depicts energy balance parameters averaged across the intervention for each group. Dietary intake was significantly lower in ED1 and ED2 vs. EXCON and significantly lower in ED3 vs. all other groups. Twenty-four-hour energy expenditure, nonexercise PA throughout the day, and RMR were not different among groups. Exercise kilocalories per workout session were significantly lower in the ED1 group vs. all other groups. By design, the calculated energy balance (deficit/surplus) was significantly different when each group was compared with the other groups, whether calculated as kcal/day or as percent of baseline energy needs. RMR did not change significantly over time (P = 0.643) and did not differ among groups (P = 0.757). There was not a significant group × time interaction (P = 0.093). Nonexercise PA did not change over time (P = 0.953), and there were no differences among groups (P = 0.212). There was not a significant group × time interaction (P = 0.691).
Table 3.
Energy balance parameters averaged across intervention cycles 1–3 for each group
| EXCON (n = 8) | ED1 (n = 6) | ED2 (n = 12) | ED3 (n = 8) | P Value (Group Effect) | |
|---|---|---|---|---|---|
| Dietary intake, kcal/day | 2,236 ± 87 | 1,845 ± 57a | 1,814 ± 43a | 1,321 ± 17a,b,c | <0.0001 |
| 24-h Energy expenditure, kcal/day | 2,149 ± 82 | 2,018 ± 71 | 2,330 ± 77 | 2,213 ± 85 | 0.084 |
| Exercise, kcal/workout | 536 ± 23 | 323 ± 16a | 495 ± 35b | 507 ± 30b | 0.001 |
| Nonexercise PA, kcal/day | 575 ± 49 | 586 ± 58 | 703 ± 50 | 672 ± 60 | 0.265 |
| RMR, kcal/day | 1,256 ± 43 | 1,230 ± 67 | 1,333 ± 41 | 1,250 ± 40 | 0.288 |
| Energy deficit/surplus, kcal/day | +80 ± 34 | −162 ± 45a | −470 ± 51a,b | −813 ± 72a,b,c | <0.0001 |
| Energy deficit/surplus, % | +4 ± 2 | −8 ± 2a | −22 ± 3a,b | −42 ± 3a,b,c | <0.0001 |
Values are expressed as means ± SE. RMR, resting metabolic rate.
Significantly different from EXCON, P < 0.016, post hoc test using Bonferroni correction;
significantly different from ED1, P < 0.016, post hoc test using Bonferroni correction;
significantly different from ED2, P < 0.016, post hoc test using Bonferroni correction.
Effects of the intervention on V̇o2 max, body weight and body composition, and metabolic hormones.
The actual training intensity throughout the intervention was not different among groups and was 76–79% of maximal heart rate (range 73–89%) for all subjects. V̇o2 max improved significantly (time effect P < 0.05), by 18% above baseline values, but the change did not differ among groups (all subjects at baseline V̇o2 max = 37.9 ± 0.7 ml·kg−1·min−1 and post-V̇o2 max = 44.2 ± 1.6 ml·kg−1·min−1). Body weight declined significantly over time (P < 0.001), and there was a significant time × group interaction (P = 0.005). Weight loss occurred in ED1 (−3.8 ± 0.2 kg), ED2 (−2.8 ± 0.6 kg), and ED3 (−2.6 ± 1.1 kg), whereas EXCON experienced minimal weight fluctuation (−0.9 ± 0.7 kg) (Fig. 1). Figure 1 depicts the change from baseline in body composition parameters. Fat loss accounted for most of the change in weight (time effect P < 0.0001) since no significant changes in fat-free mass were observed. Percent fat declined significantly (time effect P < 0.001) which was attributable mostly to the ED1, ED2, and ED3 groups (time × group P = 0.002). There were no differences between groups in baseline T3 (EXCON 92.7 ± 6.5 ng/dl, ED1 116.2 ± 10.2 ng/dl, ED2 111.3 ± 4.9 ng/dl, and ED3 107.3 ± 2.7 ng/dl, P > 0.05), but T3 declined significantly in all groups except for EXCON. Similarly, IGF-I was not different between groups at baseline (EXCON 379.4 ± 30 mg/ml, ED1 346.8 ± 23 mg/ml, ED2 399.9 ± 30 mg/ml, and ED3 366.0 ± 29 mg/ml) but declined significantly over time in all groups except for EXCON.
Fig. 1.

Change in body weight (kg; A), fat-free mass (kg; B), fat mass (kg; C), %body fat (D), triiodothyronine (T3; E), and IGF-I (ng/ml; F) from baseline to intervention cycle 1 (Int 1), intervention cycle 2 (Int 2), and intervention cycle 3 (Int 3) (A) or baseline, midstudy, and poststudy (B–F) in all groups. A: body weight (kg) exercising controls (EXCON), n = 8; energy deficit (ED)1, n = 6; ED2, n = 12; ED3, n = 8. B: fat-free mass (kg) EXCON, n = 6; ED1, n = 6; ED2, n = 11; ED3, n = 8. C: fat mass (kg) EXCON, n = 6; ED1, n = 6; ED2, n = 11; ED3, n = 8. D: %fat EXCON, n = 6; ED1, n = 6; ED2, n = 11; ED3, n = 8. E: T3 EXCON, n = 6; ED1, n = 5; ED2, n = 11; ED3, n = 8. F: IGF-I EXCON, n = 6; ED1, n = 5; ED2, n = 11; ED3, n = 8. For A–E, ANOVA with repeated-measures main effects with post hoc testing, using Bonferroni correction to isolate time effect: aED1 vs. baseline, P < 0.0125; bED2 vs. baseline P < 0.0125; cED3 vs. baseline, P < 0.0125. For F, Friedman test for related samples: aED1, P < 0.05; bED2, P < 0.05; cED3, P < 0.05. Data are reported as means ± SE.
Effects of the intervention on menstrual cycle characteristics.
No significant changes in menstrual cycle length or follicular phase length were observed in any group (Table 4). Luteal phase length declined significantly over time in all groups (P < 0.0001) but on average achieved the criteria only for “short” in the ED3 group. When changes over time were examined in each group, luteal phase length decreased in the ED3 group (time effect P = 0.01) at intervention cycle 3 (P < 0.001). Table 5 shows the percentage and numbers of subjects in each group who experienced each type of menstrual disturbance during each intervention cycle. The most frequent clinically significant menstrual disturbance observed was the development of luteal phase defects, i.e., short luteal phases and inadequate luteal phases. The frequency of these disturbances, which were mostly short luteal phases, increased as the intervention progressed from 21 to 34% of all subjects experiencing luteal defects from intervention cycle 1 to intervention cycle 3. The frequency of luteal phase disturbances increased significantly from EXCON to ED1 to ED2 and ED3, with the lowest percentage of subjects in EXCON (13%) and the highest percentage of subjects in ED3 (88%) experiencing luteal defects in at least one intervention cycle (P = 0.053). Alternatively, the frequency of oligomenorrheic and anovulatory cycles did not exhibit a dose-response relationship across increasing severity of energy deficiency, as there were no differences between groups. Figure 2 exhibits the incidence of each menstrual disturbance for the entire intervention in each group. The incidence of luteal phase defects was greater in ED2 and ED3 compared with EXCON. ED3 also incurred a significantly greater number of luteal phase defects compared with ED1 (Fig. 2, top). Neither the incidence of annovulatory (Fig. 2, middle) nor oligomenorrheic (Fig. 2, bottom) cycles is sigificantly different among groups. Figure 3 shows the relationship between the magnitude of energy deficit experienced by each group as the intervention progressed (Fig. 3A) and the overall frequency of all types of menstrual disturbances (Fig. 3B). Compared with EXCON, both the ED2 and ED3 groups incurred a significantly greater number of total disturbances. ED3 also incurred a significantly greater number of total disturbances compared with ED1.
Table 4.
Effects of the intervention on menstrual cycle length
| Baseline Cycle (Range) | Intervention Cycle 1 (Range) | Intervention Cycle 2 (Range) | Intervention Cycle 3 (Range) | |
|---|---|---|---|---|
| EXCON | ||||
| Cycle length, days (n = 8) | 28.6 ± 0.9 (25–32) | 29.6 ± 1.3 (25–37) | 28.9 ± 0.9 (25–32) | 27.0 ± 0.6 (24–28) |
| Follicular phase, days (n = 8) | 16.4 ± 0.6 (14–19) | 17.5 ± 1.3 (14–26) | 17.5 ± 1.0 (13–21) | 15.5 ± 0.6 (13–18) |
| Luteal phase, days (n = 8)a | 12.3 ± 0.6 (10–15) | 12.1 ± 0.5 (11–14) | 11.4 ± 0.7 (7–13) | 11.5 ± 0.5 (10–13) |
| ED1 | ||||
| Cycle length, days (n = 6) | 27.8 ± 0.6 (26–30) | 29.1 ± 1.1 (26–33) | 27.3 ± 1.0 (24–32) | 29.5 ± 1.0 (27–34) |
| Follicular phase, days (n = 6) | 16.8 ± 0.9 (14–20) | 17.5 ± 1.0 (15–21) | 16.0 ± 1.7 (14–22) | 19.3 ± 1.7 (15–25) |
| Luteal phase, days (n = 6)a | 11.0 ± 0.4 (10–13) | 11.7 ± 0.8 (10–15) | 11.3 ± 2.1 (2–18) | 10.1 ± 1.1 (5–12) |
| ED2 | ||||
| Cycle length, days (n = 12) | 28.7 ± 0.5 (26–31) | 27.5 ± 1.1 (21–35) | 27.3 ± 1.2 (22–34) | 28.5 ± 1.4 (24–41) |
| Follicular phase, days (n = 7) | 16.0 ± 0.5 (14–20) | 17.8 ± 0.9 (14–22) | 17.3 ± 1.0 (14–23) | 17.6 ± 1.4 (11–23) |
| Luteal phase, days (n = 7)a | 12.4 ± 0.4 (10–13) | 11.0 ± 1.0 (5–14) | 10.4 ± 1.2 (5–15) | 10.6 ± 1.0 (6–14) |
| ED3 | ||||
| Cycle length, days (n = 8) | 29.6 ± 0.6 (28–35) | 28.4 ± 0.7 (26–36) | 28.6 ± 1.5 (25–59) | 30.2 ± 3.1 (22–44) |
| Follicular phase, days (n = 5) | 18.5 ± 1.3 (13–23) | 18.2 ± 1.4 (15–24) | 21.0 ± 2.2 (13–30) | 20.6 ± 2.7 (14–34) |
| Luteal phase, days (n = 5)a,b | 11.6 ± 0.9 (10–15) | 9.4 ± 1.5 (4–15) | 6.8 ± 2.1 (3–15) | 6.8 ± 1.2 (3–13)c |
Values are expressed as means ± SE.
Time, P < 0.001; group, P = 0.069; group × time, P = 0.184; ANOVA with repeated measures on all groups, luteal phase (days).
Time, P = 0.01 vs. baseline cycle; ANOVA with repeated measures on each group separately.
P < 0.001, post hoc paired t-test; intervention cycle 3 vs. baseline cycle. Note: subjects that experienced anovulatory cycles are not included in the analyses for follicular or luteal phase length.
Table 5.
No. and corresponding percentage of subjects with at least 1 of each type of menstrual disturbances/total subjects in each group for each intervention cycle
| EXCON | ED1 | ED2 | ED3 | Total All Groups | P Value | |
|---|---|---|---|---|---|---|
| LPDs | ||||||
| Intervention cycle 1 | ||||||
| Subjects with at least 1 LPD/no. of subjects (%) | 0/8 (0) | 0/6 (0) | 5/12 (42) | 2/7 (29) | 7/33 (21) | 0.07 (χ2 = 7.0) |
| Intervention cycle 2 | ||||||
| Subjects with at least 1 LPD/no. of subjects (%) | 1/8 (13) | 1/6 (13) | 4/10 (40) | 4/6 (67) | 10/30 (33) | 0.14 (χ2 = 5.5) |
| Intervention cycle 3 | ||||||
| Subjects with at least 1 LPD/no. of subjects (%) | 0/8 (0) | 1/6 (29) | 4/9 (44) | 5/6 (83) | 10/29 (34) | 0.008 (χ2 = 11.8) |
| Intervention total | ||||||
| Subjects with at ≥1 LPD/no. of subjects (%) | 1/8 (13) | 1/6 (38) | 10/12 (83) | 7/8 (88) | 19/34 (56) | 0.001 (χ2 = 16.8) |
| Oligomenorrheic cycles | ||||||
| Intervention cycle 1 | ||||||
| Subjects with at least 1 oligomenorrheic cycle/no. of subjects (%) | 1/8 (13) | 0/6 (0) | 0/12 (0) | 0/8 (0) | 1/34 (3) | 0.34 (χ2 = 3.3) |
| Intervention cycle 2 | ||||||
| Subjects with at least 1 oligomenorrheic cycle/no. of subjects (%) | 0/8 (0) | 0/6 (0) | 0/12 (0) | 1/8 (13) | 1/34 (3) | 0.34 (χ2 = 3.3) |
| Intervention cycle 3 | ||||||
| Subjects with at least 1 oligomenorrheic cycle/no. of subjects (%) | 0/8 (0) | 0/6 (0) | 1/12 (8) | 2/7 (29) | 3/33 (9) | 0.20 (χ2 = 4.6) |
| Intervention total | ||||||
| Subjects with at least 1 oligomenorrheic cycle/no. of subjects (%) | 1/8 (13) | 0/6 (0) | 1/12 (8) | 2/7 (29) | 4/33 (12) | 0.43 (χ2 = 2.8) |
| Anovulatory cycles | ||||||
| Intervention cycle 1 | ||||||
| Subjects with at least 1 anovulatory cycle/no. of subjects (%) | 0/8 (0) | 0/6 (0) | 0/12 (0) | 1/8 (13) | 1/34 (3) | 0.34 (χ2 = 3.3) |
| Intervention cycle 2 | ||||||
| Subjects with at least 1 anovulatory cycle/no. of subjects (%) | 0/8 (0) | 0/6 (0) | 2/12 (17) | 2/8 (25) | 4/34 (12) | 0.32 (χ2 = 3.5) |
| Intervention cycle 3 | ||||||
| Subjects with at least 1 anovulatory cycle/no. of subjects (%) | 0/8 (0) | 1/8 (13) | 3/12 (25) | 0/7 (0) | 4/33 (12) | 0.12 (χ2 = 5.7) |
| Intervention total | ||||||
| Subjects with at least 1 anovulatory cycle/no. of subjects (%) | 0/8 (0) | 0/6 (0) | 5/12 (42) | 2/8 (29) | 7/34 (21) | 0.07 (χ2 = 7.0) |
LPD, luteal phase defect. Note: intervention totals reflect the no. of subjects that had at least one menstrual disturbance during intervention cycles 1–3. If subjects had more than one disturbance they were counted only once. The Total All Groups column reflects the no. of subjects who had at least one disturbance when all groups were considered. If subjects had more than one disturbance, they were counted only once.
Fig. 2.

Frequency of each menstrual disturbance observed across the intervention in each group. Data are reported as means ± SE of the total sum of disturbances per group. aSignificantly different from EXCON; bsignificantly different from EXCON and ED1. Data are reported as means ± SE.
Fig. 3.
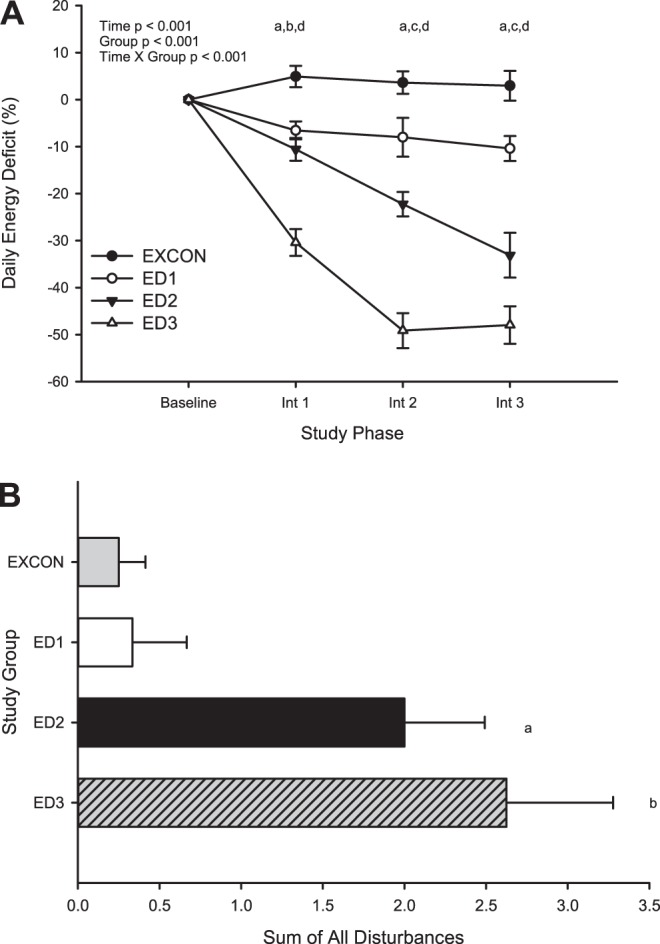
Average daily energy deficit (%) experienced across study phases (A) and sum of all menstrual disturbances across the intervention for each group (B). Data are reported as means ± SE. A: aED1 significantly different from EXCON; bED2 significantly different from EXCON; cED2 significantly different from EXCON and ED1; dED3 significantly different from EXCON, ED1, and ED2. B: asignificantly different from EXCON; bsignificantly different from EXCON and ED1. Data are reported as means ± SE.
When all subjects from all groups were considered together in a stepwise multiple linear regression analysis to predict the frequency of all menstrual disturbances, a dose-response relationship was observed between the frequency of all types of disturbances vs. the magnitude of the energy deficit. That is, the average percent energy deficit was a significant predictor of the frequency of menstrual disturbances (f = 10.1, β = −0.49, r2 = 0.24, P = 0.003). Interestingly, weight loss in kilograms, fat loss in kilograms, and the change in RMR were not significant predictors of the frequency of menstrual disturbances when included in the model.
DISCUSSION
This is the first study to demonstrate a dose-response relationship between the magnitude of energy deficiency and the frequency of exercise-related menstrual disturbances. As well, this study demonstrates two important clinical findings. 1) When young women experience the equivalent of three menstrual cycles' exposure to an energy deficit ranging from −8 to −42% of their typical energy needs, the most frequent form of menstrual disturbance that occurs is luteal phase defects characterized by either a short (<10 days) or inadequate (progesterone <5.0 μg/ml) luteal phase; and 2) the proportion of subjects experiencing a luteal phase defect and the frequency of luteal phase defects were greater in groups experiencing a greater energy deficit (ED2 and ED3), i.e., moderate or severe, compared with the control group and the ED1 or mild ED group. The average sum of luteal phase defects resulting from the moderate and severe deficits exceeded prevalence rates reported previously in exercising women (2, 11, 12). When all subjects and all menstrual disturbances were considered together, our regression analyses indicated that the magnitude of energy deficit is linearly related to the overall frequency of menstrual disturbances.
Suppression of reproductive function, i.e., FHA, in response to chronic energy deficiency may occur as a protective mechanism to preserve fuel for life-sustaining processes in the body (35). The neuroendocrine mechanism through which this suppression occurs is unclear but involves a complex interplay whereby peripheral signaling of metabolic status to hypothalamic GnRH neurons results in a decrease in GnRH pulsatile activity and a suppression of the reproductive axis (22). The goal of the current study was to address a more practical question involving the magnitude of energy deficiency that causes these effects. To this end, we conducted a randomized prospective study to assess the impact of caloric restriction and exercise designed to produce mild, moderate, and severe levels of energy deficiency on menstrual function in young, previously sedentary women.
Our subjects were typical of college-age women in terms of body weight, composition, and fitness. By design, they did not engage in purposeful exercise training or dieting prior to the study, and they exhibited very “robust” menstrual function, i.e., regular, ovulatory menstrual cycles. Effects of the exercise and caloric restriction intervention could then be ascribed to the treatment vs. any predisposition to disrupted menstrual function. Our intervention produced modest weight loss and typical losses in body fat percentage and gains in aerobic fitness. This intervention could be characterized as what a previously untrained woman would experience if she underwent a rather vigorous exercise program for a short period of time.
The estimates of the magnitude of energy deficiency associated with menstrual disturbances can be estimated from the moderate (ED2) and severe (ED3) energy deficit groups and thus ranged from −22 to −42% compared with baseline energy needs, reflecting an energy deficit of −470 to −810 kcal/day. This magnitude of an energy deficit was substantial enough to result in clinical and subclinical menstrual disturbances, which, if experienced over a long time frame, could result in other clinical sequelae associated with the female athlete triad (24). It is notable that this change resulted from both increases in energy expenditure associated with exercise training combined with decreases in food intake. Our finding that the magnitude of energy deficiency is related directly to the induction of menstrual disturbances extends previous laboratory findings from a short-term prospective study by Loucks and Thuma (20). The latter study demonstrated a suppression of LH pulsatility after 5 days below an energy availability of 30 kcal/kg lean body mass, and in the current study we are showing that a longer-term exposure to energy deficiency causes subclinical menstrual cycle disturbances in a dose-dependent manner. Notably, the most common disturbance observed, i.e., shortening of the luteal phase length, occurred with no significant change in menstrual cycle length or follicular phase length. Thus, no apparent or physical indication of a menstrual disturbance occurred, and subtle menstrual disturbances were detected exclusively by the measurement of urinary metabolites of menstrual cycle hormones. Consequently, exercising women may be experiencing subtle forms of menstrual dysfunction secondary to an energy deficit but may not be aware of such disturbances or the potential impact of these disturbances on fertility and bone health (13, 18, 24).
Several participants also presented with oligomenorrheic and/or anovulatory menstrual cycles in response to the diet and exercise intervention. The frequency of these more severe menstrual disturbances was not statistically significant among groups and was fairly similar to previous reports in exercising women or in a large study in women aged 18–44 yr (11, 12, 33). The lack of difference between groups may be physiologically significant in that an energy deficit in some participants elicited more severe menstrual disturbances than the same energy deficit in other participants. Thus, individuals may vary greatly in their sensitivity to changes in energy balance and susceptibility to particular types of menstrual dysfunction (27).
The current study also extends the prior analyses of the seminal study by Bullen et al. (6), who performed an intervention in a similar population to determine the impact of an abruptly imposed exercise program, with and without weight loss, on menstrual function. The previous study was conducted in 28 college-aged, untrained women over the course of two menstrual cycles. Participants were required to run 4 miles/day, progressing to 10 miles/day by the 5th wk, and engage in 3.5 h of moderate-intensity sport activity. Two groups, a weight maintenance group and weight loss group, were utilized to determine the impact of exercise, with or without weight loss, on menstrual function. The study demonstrated that 24 of 28 subjects experienced either luteal phase defects (short and or inadequate luteal phases) or suppression of the preovulatory LH surge over the course of the study. Specifically, delayed menses, luteal phase defects, and loss of the LH surge occurred in both groups, but in a significantly higher proportion of subjects in the weight loss group (weight loss up to 75% of subjects vs. weight maintenance up to 44% of subjects), who lost on average 4.0 ± 0.3 kg compared with the weight maintenance group, who lost 1.0 ± 0.2 kg. By comparison, our findings were similar to this study in terms of the percentage of luteal phase defects produced (2), but fewer subjects in our study experienced anovulatory cycles (moderate, 29%; severe, 42 vs. up to 81%) than in Bullen et al. (6). That study utilized body weight as a primary outcome measure and thus was not designed to measure changes in the components of energy balance. The weight-stable exercising control group lost only 1.0 ± 0.2 kg body wt but still exhibited menstrual disturbances and thus may have been exposed to an energy deficit with no statistically significant change in body weight.
Menstrual dysfunction in the absence of significant changes in body weight has also been demonstrated in monkeys, where amenorrhea was observed in response to an energy deficit in the absence of significant weight loss (38). As well, a lack of changes observed in body weight in response to subtle changes in energy balance may be a result of expansion of plasma volume (9), increases in muscle mass from training, and or increased body water stored with training-induced increases in glycogen storage, all of which can mask decreases in body weight that might result from negative energy balance. Thus, the use of body weight as a determinant of changes in energy balance with exercise training may not truly reflect subtle changes in energy status, and therefore, it may be misleading when used as an index of metabolic stress on the reproductive axis. Our intervention produced a significant change in body weight similar to the weight loss group in the study by Bullen et al. (6), but the changes in body weight were not predictive of menstrual disturbances, whereas estimates of the daily energy deficit were.
In other studies, varying levels of energy deficiency have been shown to elicit inconsistent responses with regard to suppression of reproductive function. This may be due to differences in susceptibility to reproductive dysfunction in response to energy balance changes and may be a consequence of gynecological age as a more mature reproductive axis exhibits less susceptibility to disruption (19, 30, 40). Other factors such as stress responsiveness (4, 7) may play a role in individual differences in susceptibility. There is evidence that stressors can act synergistically, which would add variability in reproductive responses to a metabolic stressor (37). Recent evidence of a genetic basis for FHA has also emerged, demonstrating that there may be gene mutations that exist in the gene encoding the GnRH receptor that may increase susceptibility of women to exercise-associated menstrual disturbances (8). Despite evidence that other factors may indeed be at play when considering one's susceptibility to exercise-associated menstrual disturbances, the dose response effect of energy deficiency on menstrual disturbances we observed in the current study underscores the strength of energy availability as a strong modulator of menstrual function.
This study has many strengths. It is a prospective study that provides an extension of prior cross-sectional studies (6) and is thus more generalizable to women that may engage in regular exercise. Caloric intake was carefully controlled, and all exercise was supervised for the duration of the study. Additionally, the measurement of daily urinary metabolites of menstrual cycle hormones allowed for the determination of subtle menstrual disturbances like luteal phase defect (LPD), which would otherwise have gone unnoticed had other methods of documenting menstrual status such as calendars or sporadic blood sampling been used.
A limitation of the study is small sample size. A greater number of participants experienced oligomenorrheic cycles in the groups experiencing a greater energy deficit; however, this proportion was not significantly different between groups. Thus, we may not have had enough power to demonstrate that a significantly greater proportion of participants was experiencing more severe menstrual disturbances, i.e., oligomenorrhea in response to a greater energy deficit. However, studies such as the current one are difficult to perform, as they are costly and require extreme subject compliance and thus subject burden. We utilized carefully controlled feeding and supervised exercise to create a quantifiable energy deficit across three menstrual cycles and have thus been able to present accurate and quantifiable data with regard to suppression of menstrual function in response to changes in energy balance. Moreover, the time course of the study may not have allowed for more severe disturbances, i.e., oligo and amenorrhea, to be observed in response to the energy deficit. However, this study is still to date the longest prospective intervention, other than those conducted in an animal model, designed to assess the magnitude and severity of menstrual disturbances that occur in response to varying levels of energy deficiency. It is possible that if the intervention were carried out longer, more frequent and more severe disturbances might have developed. The idea that severe disturbances might be preceded by more subtle disturbances is supported by Bullen et al. (6) and by a study in exercising female monkeys where menstrual cycles immediately before induction of amenorrhea were characterized by suppressed progesterone concentrations and lower early follicular LH concentrations (38, 39). Thus, the subtle menstrual disturbances observed in the current study may increase the risk of or subsequently lead to more severe menstrual disturbances. Another limitation may be the generalizability of the results. We included only subjects in whom two ovulatory cycles were documented during screening and in whom baseline cycles were ovulatory and devoid of other defects such as LPD. Thus, the subjects were very homogenous with respect to menstrual status. Although this approach is an important feature of the experimental design to draw conclusions about an intervention, our results may not be generalizable to the many young women that experience irregular menstrual cycles for unidentified reasons. Given the strict screening criteria we used (those with history of menstrual disturbances or recent disturbances excluded, and two consecutive ovulatory menstrual cycles documented prior to intervention), it is likely that our subjects were robust in terms of their susceptibility to our intervention. It is likely that a similar intervention conducted in subjects with a wider range of baseline menstrual function would have had a greater disruptive effect.
In conclusion, a combination of caloric restriction and exercise that produced varying levels of energy deficiency ranging from −470 to −810 kcal/day over a period of three menstrual cycles induced menstrual disturbances that occurred more frequently in women who were the most energy deprived. Because individuals may vary greatly in their sensitivity to changes in energy balance and susceptibility to menstrual dysfunction, more research is needed to determine how this effect is modified by age, training status, initial menstrual function, susceptibility to psychological stress, and other factors. Moreover, additional research on the effects of similar interventions on other end points such as bone structure and strength is warranted.
GRANTS
This study was supported by National Institutes of Health Grants RO1-HD-39245-01 (N. I. Williams) and M01-RR-10732 and the Department of Kinesiology, Women's Health and Exercise Laboratory, Penn State University.
DISCLOSURES
The authors have nothing to disclose.
AUTHOR CONTRIBUTIONS
N.I.W. conception and design of research; N.I.W. and H.J.L. performed experiments; N.I.W., H.J.L., B.R.H., and M.J.D.S. analyzed data; N.I.W., R.S.L., and M.J.D.S. interpreted results of experiments; N.I.W. prepared figures; N.I.W. drafted manuscript; N.I.W., J.L.L., R.S.L., and M.J.D.S. edited and revised manuscript; N.I.W. approved final version of manuscript.
ACKNOWLEDGMENTS
We thank Ann Cathcart, Thom Parrott, Brian Frye, Kelly Dougherty, Meredith Snook, Erica Richards, and Jackie Gardner for their important contributions to this research. We also appreciate the extraordinary cooperation of the study subjects and the expert assistance of the GCRC staff.
REFERENCES
- 1.Barrow GW, Saha S. Menstrual irregularity and stress fractures in collegiate female distance runners. Am J Sports Med 16: 209–216, 1988. [DOI] [PubMed] [Google Scholar]
- 2.Beitins IZ, McArthur JW, Turnbull BA, Skrinar GS, Bullen BA. Exercise induces two types of human luteal dysfunction: confirmation by urinary free progesterone. J Clin Endocrinol Metab 72: 1350–1358, 1991. [DOI] [PubMed] [Google Scholar]
- 3.Bennell K, Matheson G, Meeuwisse W, Brukner P. Risk factors for stress fractures. Sports Med 28: 91–122, 1999. [DOI] [PubMed] [Google Scholar]
- 4.Berga SL, Marcus MD, Loucks TL, Hlastala S, Ringham R, Krohn MA. Recovery of ovarian activity in women with functional hypothalamic amenorrhea who were treated with cognitive behavior therapy. Fertil Steril 80: 976–981, 2003. [DOI] [PubMed] [Google Scholar]
- 5.Brukner P, Bennell K. Stress fractures in female athletes. Diagnosis, management and rehabilitation. Sports Med 24: 419–429, 1997. [DOI] [PubMed] [Google Scholar]
- 6.Bullen BA, Skrinar GS, Beitins IZ, von Mering G, Turnbull BA, McArthur JW. Induction of menstrual disorders by strenuous exercise in untrained women. N Engl J Med 312: 1349–1353, 1985. [DOI] [PubMed] [Google Scholar]
- 7.Cameron JL. Stress and behaviorally induced reproductive dysfunction in primates. Semin Reprod Endocrinol 15: 37–45, 1997. [DOI] [PubMed] [Google Scholar]
- 8.Caronia LM, Martin C, Welt CK, Sykiotis GP, Quinton R, Thambundit A, Avbelj M, Dhruvakumar S, Plummer L, Hughes VA, Seminara SB, Boepple PA, Sidis Y, Crowley WF Jr, Martin KA, Hall JE, Pitteloud N. A genetic basis for functional hypothalamic amenorrhea. N Engl J Med 364: 215–225, 2011. [DOI] [PMC free article] [PubMed] [Google Scholar]
- 9.Convertino VA, Brock PJ, Keil LC, Bernauer EM, Greenleaf JE. Exercise training-induced hypervolemia: role of plasma albumin, renin, and vasopressin. J Appl Physiol 48: 665–669, 1980. [DOI] [PubMed] [Google Scholar]
- 10.Crouter SE, Albright C, Bassett DR Jr. Accuracy of polar S410 heart rate monitor to estimate energy cost of exercise. Med Sci Sports Exerc 36: 1433–1439, 2004. [DOI] [PubMed] [Google Scholar]
- 11.De Souza MJ, Miller BE, Loucks AB, Luciano AA, Pescatello LS, Campbell CG, Lasley BL. High frequency of luteal phase deficiency and anovulation in recreational women runners: blunted elevation in follicle-stimulating hormone observed during luteal-follicular transition. J Clin Endocrinol Metab 83: 4220–4232, 1998. [DOI] [PubMed] [Google Scholar]
- 12.De Souza MJ, Toombs RJ, Scheid JL, O'Donnell E, West SL, Williams NI. High prevalence of subtle and severe menstrual disturbances in exercising women: confirmation using daily hormone measures. Hum Reprod 25: 491–503, 2010. [DOI] [PubMed] [Google Scholar]
- 13.De Souza MJ, Williams NI. Physiological aspects and clinical sequelae of energy deficiency and hypoestrogenism in exercising women. Hum Reprod Update 10: 433–448, 2004. [DOI] [PubMed] [Google Scholar]
- 14.Friday KE, Drinkwater BL, Bruemmer B, Chesnut C 3rd, Chait A. Elevated plasma low-density lipoprotein and high-density lipoprotein cholesterol levels in amenorrheic athletes: effects of endogenous hormone status and nutrient intake. J Clin Endocrinol Metab 77: 1605–1609, 1993. [DOI] [PubMed] [Google Scholar]
- 15.Hoch AZ, Jurva JW, Staton MA, Thielke R, Hoffmann RG, Pajewski N, Gutterman DD. Athletic amenorrhea and endothelial dysfunction. WMJ 106: 301–306, 2007. [PubMed] [Google Scholar]
- 16.Kohl HW, Blair SN, Paffenbarger RS Jr, Macera CA, Kronenfeld JJ. A mail survey of physical activity habits as related to measured physical fitness. Am J Epidemiol 127: 1228–1239, 1988. [DOI] [PubMed] [Google Scholar]
- 17.Leidy HJ, Gardner JK, Frye BR, Snook ML, Schuchert MK, Richard EL, Williams NI. Circulating ghrelin is sensitive to changes in body weight during a diet and exercise program in normal-weight young women. J Clin Endocrinol Metab 89: 2659–2664, 2004. [DOI] [PubMed] [Google Scholar]
- 18.Li D, Hitchcock CL, Barr SI, Yu T, Prior JC. Negative spinal bone mineral density changes and subclinical ovulatory disturbances—prospective data in healthy premenopausal women with regular menstrual cycles. Epidemiol Rev 36: 137–147, 2014. [DOI] [PubMed] [Google Scholar]
- 19.Loucks AB. The response of luteinizing hormone pulsatility to 5 days of low energy availability disappears by 14 years of gynecological age. J Clin Endocrinol Metab 91: 3158–3164, 2006. [DOI] [PubMed] [Google Scholar]
- 20.Loucks AB, Thuma JR. Luteinizing hormone pulsatility is disrupted at a threshold of energy availability in regularly menstruating women. J Clin Endocrinol Metab 88: 297–311, 2003. [DOI] [PubMed] [Google Scholar]
- 21.Maddison R, Jiang Y, Hoorn SV, Mhurchu CN, Lawes CM, Rodgers A, Rush E. Estimating energy expenditure with the RT3 triaxial accelerometer. Res Q Exerc Sport 80: 249–256, 2009. [DOI] [PubMed] [Google Scholar]
- 22.Maeda K, Ohkura S, Uenoyama Y, Wakabayashi Y, Oka Y, Tsukamura H, Okamura H. Neurobiological mechanisms underlying GnRH pulse generation by the hypothalamus. Brain Res 1364: 103–115, 2010. [DOI] [PubMed] [Google Scholar]
- 23.McConnell HJ, O'Connor KA, Brindle E, Williams NI. Validity of methods for analyzing urinary steroid data to detect ovulation in athletes. Med Sci Sports Exerc 34: 1836–1844, 2002. [DOI] [PubMed] [Google Scholar]
- 24.Nattiv A, Loucks AB, Manore MM, Sanborn CF, Sundgot-Borgen J, Warren MP. American College of Sports Medicine position stand. The female athlete triad. Med Sci Sports Exerc 39: 1867–1882, 2007. [DOI] [PubMed] [Google Scholar]
- 26.O'Donnell E, De Souza MJ. The cardiovascular effects of chronic hypoestrogenism in amenorrhoeic athletes - a critical review. Sports Med 34: 601–627, 2004. [DOI] [PubMed] [Google Scholar]
- 27.Pauli SA, Berga SL. Athletic amenorrhea: energy deficit or psychogenic challenge? Ann NY Acad Sci 1205: 33–38, 2010. [DOI] [PMC free article] [PubMed] [Google Scholar]
- 28.Pollock ML, Wilmore JH, Fox SM. Exercise in Health and Disease: Evaluation and Prescription for Prevention and Rehabilitation. Philadelphia, PA: W. B. Saunders, 1984. [Google Scholar]
- 29.Rencken ML, Chesnut CH 3rd, Drinkwater BL. Bone density at multiple skeletal sites in amenorrheic athletes. JAMA 276: 238–240, 1996. [PubMed] [Google Scholar]
- 30.Rogol AD, Weltman A, Weltman JY, Seip RL, Snead DB, Levine S, Haskvitz EM, Thompson DL, Schurrer R, Dowling E, et al. Durability of the reproductive axis in eumenorrheic women during 1 yr of endurance training. J Appl Physiol 72: 1571–1580, 1992. [DOI] [PubMed] [Google Scholar]
- 31.Rowlands AV, Thomas PW, Eston RG, Topping R. Validation of the RT3 triaxial accelerometer for the assessment of physical activity. Med Sci Sports Exerc 36: 518–524, 2004. [DOI] [PubMed] [Google Scholar]
- 32.Santoro N, Crawford SL, Allsworth JE, Gold EB, Greendale GA, Korenman S, Lasley BL, McConnell D, McGaffigan P, Midgely R, Schocken M, Sowers M, Weiss G. Assessing menstrual cycles with urinary hormone assays. Am J Physiol Endocrinol Metab 284: E521–E530, 2003. [DOI] [PubMed] [Google Scholar]
- 33.Wactawski-Wende J, Schisterman EF, Hovey KM, Howards PP, Browne RW, Hediger M, Liu A, Trevisan M. BioCycle study: design of the longitudinal study of the oxidative stress and hormone variation during the menstrual cycle. Paediatr Perinat Epidemiol 23: 171–184, 2009. [DOI] [PMC free article] [PubMed] [Google Scholar]
- 34.Wade GN, Schneider JE, Li HY. Control of fertility by metabolic cues. Am J Physiol Endocrinol Metab 270: E1–E19, 1996. [DOI] [PubMed] [Google Scholar]
- 35.Wade RJ. Compensation, stress and the “V” code. Med J Aust 165: 530–530, 1996. [DOI] [PubMed] [Google Scholar]
- 36.Westerlind KC, Williams NI. Effect of energy deficiency on estrogen metabolism in premenopausal women. Med Sci Sports Exerc 39: 1090–1097, 2007. [DOI] [PubMed] [Google Scholar]
- 37.Williams NI, Berga SL, Cameron JL. Synergism between psychosocial and metabolic stressors: impact on reproductive function in cynomolgus monkeys. Am J Physiol Endocrinol Metab 293: E270–E276, 2007. [DOI] [PubMed] [Google Scholar]
- 38.Williams NI, Caston-Balderrama AL, Helmreich DL, Parfitt DB, Nosbisch C, Cameron JL. Longitudinal changes in reproductive hormones and menstrual cyclicity in cynomolgus monkeys during strenuous exercise training: abrupt transition to exercise-induced amenorrhea. Endocrinology 142: 2381–2389, 2001. [DOI] [PubMed] [Google Scholar]
- 39.Williams NI, Helmreich DL, Parfitt DB, Caston-Balderrama A, Cameron JL. Evidence for a causal role of low energy availability in the induction of menstrual cycle disturbances during strenuous exercise training. J Clin Endocrinol Metab 86: 5184–5193, 2001. [DOI] [PubMed] [Google Scholar]
- 40.Williams NI, Reed JL, Leidy HJ, Legro RS, De Souza MJ. Estrogen and progesterone exposure is reduced in response to energy deficiency in women aged 25–40 years. Hum Reprod 25: 2328–2339, 2010. [DOI] [PMC free article] [PubMed] [Google Scholar]