Abstract
Na+/H+ exchanger (NHE)3 is the predominant NHE on the brush-border membrane of the proximal tubule in adult animals. NHE8 has been localized to the brush-border membrane of proximal tubules and is more highly expressed in neonates than in adult animals. However, the relative role of NHE8 in neonatal renal acidification is unclear. The present study examined if there was a compensatory increase in NHE3 in NHE8-null neonatal mice and whether there was a compensatory increase in NHE8 in NHE3-null neonatal mice. In addition, we examined whether wild-type, NHE3-null, and NHE8-null mice had an increase in NHE activity in response to metabolic acidosis. We found that at baseline, there was comparable renal NHE3 mRNA, total protein, and brush-border membrane protein abundance as in neonatal control and NHE8-null mice. There was comparable renal NHE8 mRNA, total protein, and brush-border membrane protein abundance in NHE3-null neonatal and control mice. Both NHE3- and NHE8-null mice had a comparable but lower rate of NHE activity than control mice. We next imposed metabolic acidosis in wild-type, NHE3-null, and NHE8-null mice. Acidemic NHE8-null mice had an increase in brush-border membrane vesicle NHE3 protein abundance and NHE activity compared with vehicle-treated mice. Likewise, NHE3-null mice had an increase in NHE8 brush-border membrane protein abundance and NHE activity in response to metabolic acidosis. In conclusion, both NHE3 and NHE8 likely play a role in neonatal acidification.
Keywords: sodium/hydrogen exchanger, proximal tubule, development, acidosis
the adult proximal tubule reabsorbs the majority of filtered bicarbonate. Two-thirds of luminal proton secretion for bicarbonate reabsorption is mediated by the Na+/H+ exchanger (NHE) and one-third is mediated by H+-ATPase (4, 24). In the adult proximal tubule, NHE3 mediates virtually all NHE activity (8, 9, 25, 32, 33). NHE8 is also expressed on the apical membrane of the adult proximal tubule, but whereas NHE3-null mice have profound metabolic acidosis (25), NHE8-null mice have comparable serum bicarbonate levels to their wild-type controls (6). Thus, the functional significance of NHE8 in adult proximal tubule acidification is unclear.
We have previously examined the ontogeny of NHE3 and NHE8 expression in the rat and mouse kidney (8, 29). NHE3 is highly expressed on brush border membranes of adults, but there is minimal expression in neonates (8, 28, 29). NHE8 is highly expressed on brush-border membranes of neonates and decreases to relatively low levels in adults (8, 29). The change in expression of NHE3 and NHE8 occurs at the time of weaning in rats and mice. The developmental change in NHE3 and NHE8 expression may be due to the postnatal increase in thyroid hormone and glucocorticoids that occurs at the time of weaning (19, 31, 34). We have previously provided evidence that the developmental increase in NHE3 and decrease in NHE8 are mediated by the developmental increase in thyroid hormone and glucocorticoids (5, 15, 18, 20).
While NHE8 is more highly expressed in neonates than adults, its role in mediating proximal tubule Na+/H+ exchange is unclear as the relative abundance of a protein may not parallel its activity (8, 29). The purpose of the present study was to examine if there is a compensatory increase in NHE3 and NHE8 when one of these is deleted in neonatal nursing mice. We also examined relative NHE activity in neonatal NHE3-null and NHE8-null mice compared with control mice. Finally, we examined if NHE3 and NHE8 have increased expression and activity in response to metabolic acidosis in the neonate.
METHODS
NHE3- and NHE8-null mice.
NHE3-null (NHE3−/−) mice were generated by Schultheis et al. (13, 25). These mice lack codons for amino acids 320–831, which encode sequences required for Na+/H+ exchange and have been shown not to express NHE3 (25). Homozygous NHE3-null mice and siblings (NHE3+/+ mice) were generated by mating of heterozygotes. NHE8-null (NHE8−/−) mice were generated by deletion of bases 631–656 of NHE8 and replaced with the LacZ-Neo gene (Deltagen, San Mateo, CA). We have shown that NHE8−/− mice do not express NHE8 mRNA or protein. Mice were nursed and cared for by their mothers, which were fed a Teklad Global 2016 diet (16% protein), and neonatal mice were studied at 8–12 days of age. Control, NHE3-null, and NHE8-null mice were on a C57/B6 background. No heterozygous mice were used except for breeding. There was no selection for sex, and both male and female mice were used in these experiments. NHE3−/−/NHE8+/+ and NHE3+/+/NHE8−/− mice are also designated as NHE3−/− and NHE8−/− mice, respectively, in this report. This study was approved by the Institutional Animal Care and Use Committee of the University of Texas Southwestern Medical Center and were in accordance with the American Physiologic Society's “Guiding Principles in the Care and Use of Animals.”
Gavage and metabolic acidosis.
In some experiments, the effect of metabolic acidosis on NHE3 and NHE8 mRNA, total protein, brush-border membrane protein abundance, and NHE activity was examined in neonatal mice. Starting at 6–8 days of age, wild-type, NHE3−/−/NHE8+/+, and NHE3+/+/NHE8−/− mice were gavaged with 1 mmol/100 g body wt and with a volume of 1 ml/100 g body wt with NH4Cl or vehicle (NaCl) twice daily for 7 doses (29). We gavaged neonates using polyethylene tubing with an inner diameter of 0.28 mm. The last dose was administered 2 h before euthanization.
Phlebotomy and blood analysis.
Blood samples were obtained from mice anesthetized with Inactin (1 mg/10 g body wt, Sigma, St. Louis, MO). Blood (100 μl) was collected via cardiac puncture in neonates and placed in heparinized tubes for analysis of electrolytes, pH, Pco2, and bicarbonate levels using a Stat Profile Critical Care Express blood gas machine (Nova Biomedical, Waltham, MA).
Total renal protein and brush-border membrane vesicle isolation.
Total renal protein and brush-border membranes were isolated by placing kidneys in ice-cold isolation buffer containing 300 mmol/l mannitol, 16 mmol/l HEPES, and 5 mmol/l EGTA titrated to pH 7.4 with Tris. The isolation buffer contained 100 μg/ml PMSF and 1 μl/ml protease inhibitor cocktail (Sigma). Kidneys were homogenized with 15 strokes of a Teflon-glass homogenizer at 4°C (6, 8). Brush-border membrane vesicles (BBMVs) were isolated from the total kidney protein homogenate by magnesium precipitation and differential centrifugation as previously described (6, 8). The BBMV fraction was resuspended in isolation buffer. Protein fractions were assayed using the Bradford assay with BSA as the standard (11).
cDNA synthesis and real-time PCR.
RNA was isolated from kidneys of neonates using the GenElute Mammalian Total RNA Miniprep Kit per the manufacturer's instructions (Sigma-Aldrich). The quality of RNA was determined using an Epoch microplate spectrophotometer at 260- and 280-nm wavelengths (Biotek, Winooski, VT). RNA (4 μg) was treated with DNAse I (Invitrogen, Carlsbad, CA) and random hexamer primers and reverse transcriptase was used to synthesize cDNA (Invitrogen or Thermo Scientific) (29).
mRNA abundance was quantitated using real-time PCR using an iCycler PCR Thermal Cycler (Bio-Rad, Hercules, CA). Primers for NHE8 (forward: 5′-ACAGTTTCGCATTTGGCTCCCTG-3′ and reverse: 5′-TGTTGGTGAGGACGATGGAGACTG-3′) and NHE3 (forward: 5′-TTCAAATGGCACCACGTCCAGG-3′ and reverse: 5′-TGACTTTGTGGGACAGTTGAAAG-3′) were mixed with cDNA and SYBR green master mix per the manufacturer's instructions (Bio-Rad). The PCR conditions were denaturation (94°C for 30 s), annealing (61°C for 20 s), and extension at 72°C for 20 s for 40 cycles. The housekeeping gene 28S (forward: 5′-TTGAAAATCCGGGGGAGAG-3′ and reverse: 5′-ACATTGTTCCATGCCAG-3′) was used to normalize the relative expression of NHE8 and NHE3 (30).
SDS-PAGE and immunoblot analysis.
Protein samples were diluted in 5× loading buffer [5 mM Tris·HCl (pH 6.8), 10% β-mercaptoethanol, 10% glycerol, and 1% SDS] (25 μg/lane) and heated at 37°C for 5 min. Proteins were then separated on an 8% polyacrylamide gel using SDS-PAGE as previously described (8). Proteins were transferred to a polyvinylidene fluoride membrane (Immobilon, Millipore, Billerica, MA) at 400 mA at 4°C for 1 h (8, 10). Blots were incubated in Blotto (1% nonfat milk and 0.05% Tween 20 in PBS, pH 7.4) for 1 h before the addition of the primary antibody. Primary antibodies were polyclonal NHE8 antibody (NBP1-59888, Novus Biologicals, Littleton, CO) and monoclonal NHE3 (3H3) antibody (a gift from Orson Moe). Primary antibodies were used at 1:5 dilution for NHE3 and 1:1,000 for NHE8 in 1% Blotto. Blots were incubated overnight at 4°C and then washed in PBS containing 0.1% Tween 20. This was followed by an incubation for 1 h at room temperature with the secondary antibody, horseradish peroxidase-conjugated donkey anti-mouse antibody, at 1:10,000 dilution for NHE3 (Santa Cruz Biotechnology, Santa Cruz, CA) and donkey anti-rabbit antibody at 1:10,000 dilution for NHE8 (Santa Cruz Biotechnology) in 1% Blotto. Enhanced chemiluminescence was used to detect bound antibody (Amersham Biosciences, Piscataway, NJ). Confirmation of equal loading of protein was verified using an antibody to β-actin at 1:15,000 dilution for total protein samples (Sigma) and an antibody to villin at 1:250 dilution for brush-border membranes (Santa Cruz Biotechnology). NHE3 and NHE8 abundance was quantitated using densitometry. It should be noted that in all immunoblots, the results shown were the same if we analyzed the data with or without normalization for β-actin or villin. Each lane shown represents tissue from a single mouse. N refers to the number of experiments and number of mice studied individually.
In vitro microperfusion measurement of proximal convoluted tubule Na+/H+ exchange activity.
Kidneys were rapidly removed from NHE3+/+/NHE8+/+, NHE3−/−/NHE8+/+, and NHE3+/+/NHE8−/− mice, cut in coronal sections, and immersed in Hanks' solution (4°C), which contained (in mM) 137 NaCl, 5 KCl, 10 Tris(hydroxymethyl)aminomethane hydrochloride, 0.25 CaCl2, 2, 0.8 MgSO4, 0.33 Na2HPO4, 0.44 KH2PO4, 1 MgCl2, and 2 l-lactate glutamine (pH 7.4). Proximal convoluted tubules from neonatal mice were dissected using Dumont 5 forceps (13).
Compositions of the solutions used to assay Na+/H+ exchange are shown in Table 1. Proximal convoluted tubules were perfused with concentric glass pipettes with Na+-containing solution (solution B) and bathed with solution containing (in mM) 115 NaCl, 25 NaHCO3, 10 Na acetate, 8.3 glucose, 5 KCl, 4.0 Na2HPO4, 1.8 CaCl2, 1 MgSO4, 5 alanine, 2 glutamine, and 2 lactate. Intracellular pH (pHi) was measured with a Nikon Eclipse TE 2000-U inverted epifluorescent microscope equipped with a Photometrics Cascade:512F microscopy camera (Ottobrunn, Germany) and Lambda DG-4/DG-5 illumination system (Sutter Instrument, Novato, CA). Tubules were incubated with the pH-sensitive dye BCECF-AM (5 × 10⁻⁶ M, Molecular Probes, Eugene, OR), which is permeable across cell membranes (1, 3, 13, 28). The AM group is cleaved by intracellular esterases, trapping BCECF in cells. A nigericin calibration curve was used to determine pHi from the fluorescence ratio (500/450 nm) (1, 3, 13). Proximal convoluted tubules were then bathed with solution A containing 1 mM SITS, which inhibits the Na+-bicarbonate cotransporter, the major regulator of proximal tubular pHi (1). This solution had 5 mM bicarbonate (pH 6.6), which compensates for the cell alkalinization caused by bath SITS (2, 3, 24). The luminal perfusate was changed to one without Na+ (solution C). After a steady state had been reached, pHi was measured and Na+ was added back to the lumen. Rates of change in cell pH were measured (dpHi/dt) with luminal Na+ removal and readdition to assess Na+/H+ exchange activity (1, 13, 14).
Table 1.
Solutions
| Bath Solution (Solution A) | Luminal Na+ Solution (Solution B) | Luminal Na+-free Solution (Solution C) | |
|---|---|---|---|
| NaCl | 140 | 115 | |
| NaHCO3 | 5 | 25 | |
| N-methyl-d-glucamine-Cl | 115 | ||
| Choline HCO3 | 25 | ||
| KCl | 5 | ||
| K2HPO4 | 2.5 | 2.5 | |
| MgCl2 | 1 | 1 | |
| MgSO4 | 1 | ||
| Na2HPO4 | 1 | ||
| Glucose | 5 | ||
| l-Alanine | 5 | ||
| Urea | 5 | ||
| CaCl2 | 1.8 | 1.8 | 1.8 |
| Heptanoic Acid | 2 | ||
| pH | 6.6 | 7.4 | 7.4 |
All constituents are in mM. All solutions were adjusted to an osmolality of 295 mosM/kg H2O.
Statistical analysis.
All data are expressed as means ± SEM. Comparisons were made using an unpaired Student's t-test when there were two groups and ANOVA when more than two groups were evaluated. P values of ≤ 0.05 were considered significant.
RESULTS
In the first series of experiments, we compared serum electrolytes, serum bicarbonate, pH, and Pco2 in neonatal wild-type (NHE3+/+/NHE8+/+), NHE3-null (NHE3−/−/NHE8+/+), and NHE8-null (NHE3+/+/NHE8−/−) mice. These results are shown in Table 2. There were no differences in serum electrolytes, serum bicarbonat and serum pH among wild-type, NHE3-null, and NHE8-null mice. Adult NHE3-null mice have metabolic acidosis, whereas adult NHE8-null mice have comparable pH, bicarbonate, and electrolyte levels as adult wild-type mice (6, 25). The lack of acidosis in neonatal NHE3- and NHE8-null mice is likely due to either the fact that they are nursing and have a very low glomerular filtration rate or there is compensation for the absence of one isoform by upregulation of another, which was examined below.
Table 2.
Baseline weight, blood gas, and electrolytes in mice at 10 days of age
| Body Weight, g | Age, days | pH | Pco2 | HCO3− | Na+ | K+ | Cl− | |
|---|---|---|---|---|---|---|---|---|
| NHE3+/+/NHE8 +/+ | 5.2 ± 0.2 | 9.5 ± 0.4 | 7.46 ± 0.02 | 33.9 ± 2.1 | 24.2 ± 1.0 | 138.7 ± 0.8 | 3.9 ± 0.2 | 108.5 ± 1.9 |
| N | 10 | 10 | 10 | 10 | 10 | 10 | 10 | 10 |
| NHE3−/−/NHE8+/+ | 4.5 ± 0.4 | 9.7 ± 0.5 | 7.43 ± 0.03 | 35.8 ± 3.1 | 23.3 ± 0.9 | 138.8 ± 1.9 | 4.0 ± 0.4 | 112.1 ± 3.6 |
| N | 9 | 9 | 9 | 9 | 9 | 6 | 6 | 6 |
| NHE3+/+/NHE8−/− | 5.1 ± 0.3 | 9.5 ± 0.4 | 7.45 ± 0.02 | 36.3 ± 2.1 | 25.4 ± 0.9 | 137.5 ± 0.8 | 4.1 ± 0.2 | 108.0 ± 1.2 |
| N | 11 | 11 | 11 | 11 | 11 | 11 | 11 | 11 |
Values are means ± SD; N, number of mice/group. NHE, Na+/H+ exchanger.
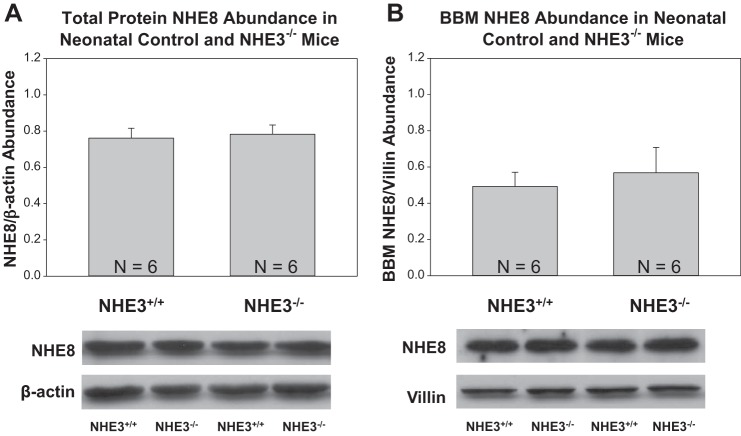
To determine the effect on NHE8 in NHE3-null mice, we compared mRNA, total protein, and brush-border membrane abundance in 10-day-old NHE3-null and wild-type mice. As shown in Fig. 1, there was comparable NHE8 mRNA abundance in the two groups. Figure 2 shows that NHE8 total protein and brush-border membrane abundance were comparable in NHE3-null and wild-type mice.
Fig. 1.
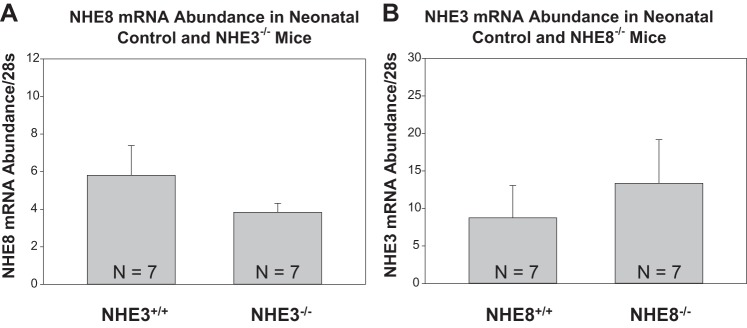
Na+/H+ exchanger (NHE)8 and NHE3 mRNA abundance in wild-type and knockout mice. A: NHE8 mRNA abundance was assessed in wild-type (NHE+/+) and NHE3-null (NHE8+/+/NHE3−/− or NHE3−/−) mice using real-time PCR at 10 days of age. NHE8 mRNA abundance was comparable in both groups. B: NHE3 mRNA abundance was assessed in wild-type (NHE8+/+) and NHE8-null (NHE8−/−/NHE3+/+ or NHE8−/−) mice using real-time PCR at 10 days of age. NHE3 mRNA abundance was comparable in both groups.
Fig. 2.
Renal total protein and brush-border membrane NHE8 protein abundance in neonatal NHE3-null mice. A: NHE8 total protein abundance was comparable in wild-type and NHE3-null neonatal mice. The molecular mass of NHE8 was ∼80 kDa. B: NHE8 brush-border membrane abundance was comparable in wild-type and NHE3-null neonatal mice.
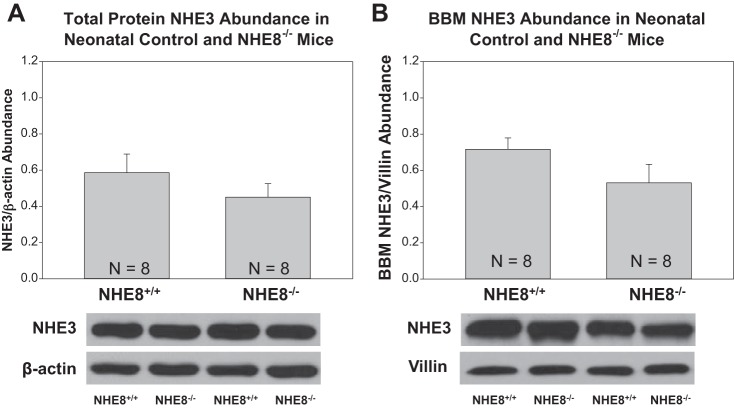
We next examined if there was a compensatory increase in NHE3 in neonatal NHE8-null mice. As shown in Fig. 1, NHE3 mRNA abundance in wild-type mice was comparable to mRNA abundance in NHE8-null mice. As shown in Fig. 3, there were no differences in total protein or brush-border membrane NHE3 abundance in NHE8-null and wild-type mice.
Fig. 3.
Renal total protein and brush-border membrane NHE3 protein abundance in neonatal NHE8-null mice. A: NHE3 total protein abundance was comparable in wild-type and NHE8-null neonatal mice. The molecular mass of NHE3 was ∼90 kDa. B: brush-border membrane NHE3 abundance was comparable in wild-type and NHE8-null neonatal mice.
We next compared NHE activity in wild-type, NHE3-null, and NHE8-null mice. NHE activity was assessed by measuring the rate of change in pHi in response to luminal Na+ removal and readdition. As shown in Table 3, there was a comparable decrease in pHi in all three groups with luminal Na+ removal and pH recovered to baseline with the addition of luminal Na+. Figure 4 shows that dpHi/dt upon Na+ removal was comparable in NHE8- and NHE3-null mice, but both were significantly less than in wild-type mice. As shown in Table 3, similar results in dpHi/dt were found with the readdition of Na+ to the tubular lumen, showing that the rate was less in NHE8- and NHE3-null mice than that of wild-type mice. Figure 4 also shows a typical tracing of pHi with luminal Na+ removal and readdition. Thus, deletion of either NHE3 or NHE8 affects neonatal proximal tubule NHE activity.
Table 3.
pHi in the presence or absence of luminal Na+ and dpHi/dt with luminal Na+ removal and readdition
| Baseline pHi | dpHi/dt With Luminal Na+ Removal | 0-Na+ pHi | dpHi/dt With Luminal Na+ Addition | Recovery pHi | |
|---|---|---|---|---|---|
| NHE3+/+/NHE8+/+ | 7.34 ± 0.08 | 1.54 ± 0.13 | 7.00 ± 0.08† | 1.89 ± 0.20 | 7.34 ± 0.08 |
| NHE3−/−/NHE8+/+ | 7.32 ± 0.07 | 0.92 ± 0.11* | 7.11 ± 0.08† | 0.93 ± 0.13* | 7.27 ± 0.06 |
| NHE3+/+/NHE8−/− | 7.31 ± 0.07 | 1.10 ± 0.14* | 7.05 ± 0.08† | 1.28 ± 0.20* | 7.29 ± 0.08 |
Values are means ± SD; N = 15 NHE3+/+/NHE8+/+ (control) mice, 13 NHE3−/−/NHE8+/+ mice, and 13 NHE3+/+/NHE8−/− mice. pHi, intracellular pH.
P < 0.05 vs. dpHi/dt in NHE3+/+/NHE8+/+ mice;
P < 0.01 vs. baseline and recovery pHi.
Fig. 4.
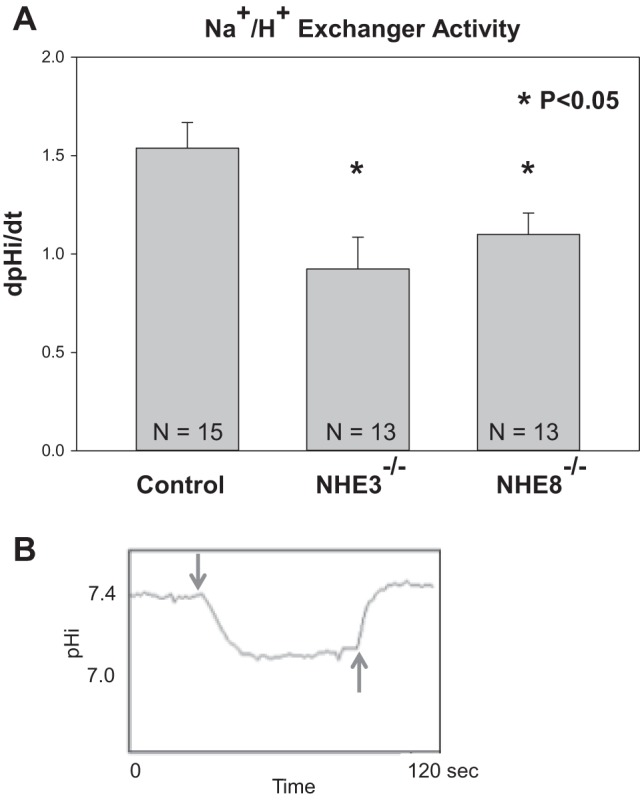
NHE activity in neonatal wild-type, NHE3-null, and NHE8-null mice. A: NHE activity was assayed in 8- to 12-day-old neonatal mice as the rate of Na+ removal on intracellular pH (dpHi/dt). NHE activity was greater in control mice than in NHE3- and NHE8-null mice. There was no difference in the rate of NHE activity in NHE3- and NHE8-null neonatal mice. B: typical tracing examining the rate of change in pHi with luminal Na+ removal (downward arrow) and luminal Na+ readdition (upward arrow). Note that there was little recovery of cell pH in the absence of luminal Na+.
We next examined the effect of metabolic acidosis in wild-type, NHE3-null, and NHE8-null mice. Table 4 shows the electrolyte and blood gas results from vehicle- and NH4Cl-gavaged mice. As shown in Table 4, acid-gavaged mice had comparable hyperchloremic metabolic acidosis compared with the vehicle-gavaged group in wild-type, NHE3-null, and NHE8-null mice. As shown in Fig. 5, metabolic acidosis did not affect NHE8 mRNA in NHE3-null mice or NHE3 mRNA abundance in NHE8-null mice.
Table 4.
Body weight, blood gas, and electrolytes in vehicle- and acid-gavaged mice at 10 days of age
| Body Weight, g | Age, days | pH | Pco2 | HCO3− | Na+ | K+ | Cl− | |
|---|---|---|---|---|---|---|---|---|
| NHE3+/+/NHE8+/+ | ||||||||
| Vehicle | 5.0 ± 1.3 | 9.8 ± 0.2 | 7.42 ± 0.01 | 29.3 ± 1.6 | 20.0 ± 0.7 | 150.5 ± 2.5 | 3.3 ± 0.1 | 126.8 ± 2.7 |
| N | 10 | 10 | 10 | 10 | 10 | 8 | 8 | 8 |
| Acid | 4.9 ± 0.2 | 9.8 ± 0.2 | 7.23 ± 0.04* | 25.5 ± 1.7 | 11.6 ± 1.0* | 150.5 ± 1.7 | 4.2 ± 0.2 | 135.4 ± 2.2* |
| N | 10 | 10 | 10 | 10 | 10 | 7 | 7 | 7 |
| NHE3−/−/NHE8+/+ | ||||||||
| Vehicle | 4.8 ± 0.1 | 11.0 ± 0.5 | 7.36 ± 0.02 | 33.7 ± 2.7 | 19.8 ± 1.3 | 147.2 ± 2.9 | 3.6 ± 0.3 | 122.5 ± 2.3 |
| N | 7 | 7 | 7 | 7 | 7 | 7 | 7 | 7 |
| Acid | 4.3 ± 0.3 | 10.5 ± 0.6 | 7.21 ± 0.01* | 28.7 ± 2.9 | 12.0 ± 1.1* | 144.3 ± 1.2 | 4.7 ± 0.3* | 131.4 ± 2.7 |
| N | 7 | 7 | 7 | 7 | 7 | 7 | 7 | 7 |
| NHE3+/+/NHE8−/− | ||||||||
| Vehicle | 4.9 ± 0.2 | 9.9 ± 0.3 | 7.41 ± 0.03 | 34.3 ± 2.4 | 22.6 ± 0.8 | 147.0 ± 2.9 | 3.7 ± 0.1 | 122.0 ± 2.0 |
| N | 9 | 9 | 9 | 9 | 9 | 6 | 6 | 6 |
| Acid | 4.5 ± 0.2 | 10.1 ± 0.2 | 7.23 ± 0.03* | 25.2 ± 1.6* | 11.8 ± 1.0* | 148.6 ± 1.8 | 4.0 ± 0.2 | 133.3 ± 4.0* |
| N | 9 | 10 | 10 | 10 | 10 | 7 | 7 | 7 |
Values are means ± SD; N, number of mice/group.
P < 0.05 vs. vehicle-treated mice.
Fig. 5.
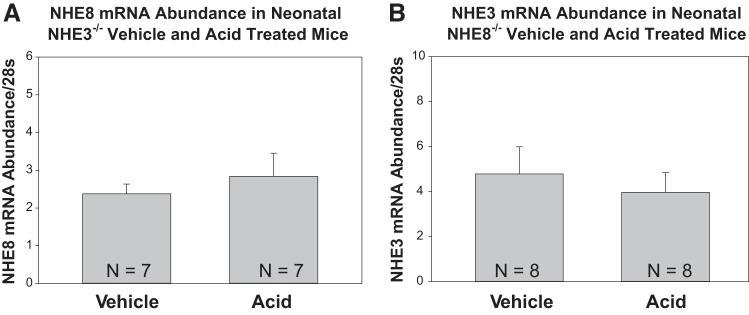
Effect of metabolic acidosis on mRNA abundance in wild-type, NHE3-null, and NHE8-null mice. A: NHE8 mRNA abundance was compared in vehicle-gavaged and NH4Cl-gavaged (acid) NHE3-null neonatal mice. NHE8 mRNA was comparable in control and acidemic groups. B: NHE3 mRNA abundance was compared in vehicle-gavaged and NH4Cl-gavaged NHE8-null neonatal mice. NHE3 mRNA was comparable in control and acidemic groups.
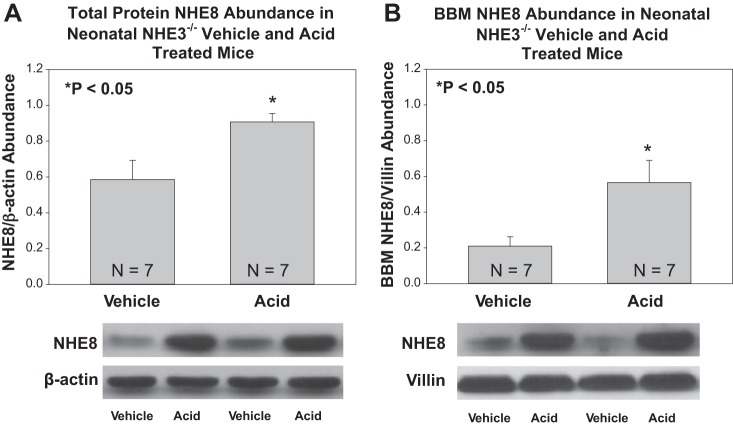
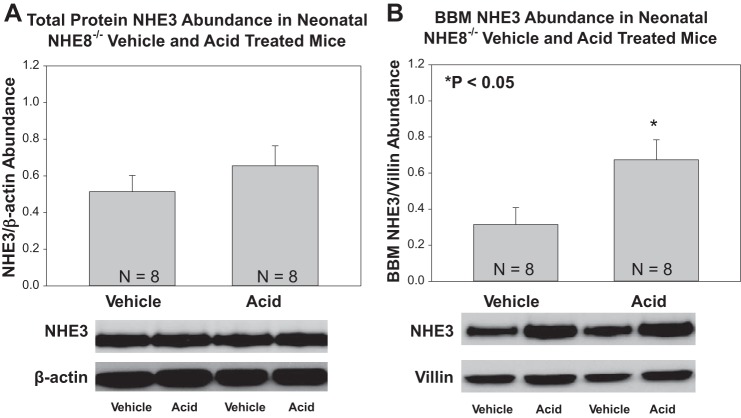
The effect of metabolic acidosis on NHE8 total and brush-border membrane protein abundance on NHE3 null mice is shown in Fig. 6. Metabolic acidosis resulted in an increase in the total kidney homogenate and brush border membrane NHE8 in NHE3-null mice. We also studied the effect of metabolic acidosis on NHE3 total protein abundance and brush-border membrane abundance in NHE8-null mice, which is shown in Fig. 7. There was no effect of acidosis on NHE3 on total protein abundance in NHE8-null mice, but acidosis resulted in an increase in brush-border membrane NHE3 in NHE8-null mice.
Fig. 6.
Effect of metabolic acidosis on NHE8 total protein and brush-border membrane abundance in NHE3-null mice. A: metabolic acidosis increased NHE8 total protein abundance in neonatal NHE3-null mice. B: metabolic acidosis increased NHE8 brush-border membrane protein abundance in NHE3-null mice.
Fig. 7.
Effect of metabolic acidosis on NHE3 total protein and brush border membrane abundance in NHE8-null mice. A: metabolic acidosis did not significantly change NHE3 total protein abundance in NHE8-null neonatal mice. B: metabolic acidosis increased NHE3 brush-border membrane protein abundance in NHE8-null neonatal mice.
Table 5 shows the effect of metabolic acidosis on pHi and dpHi/dt with luminal Na+ removal and readdition. Basal pHi values were comparable in acidic and vehicle control groups. In all groups, there was cell acidification with luminal Na+ removal and recovery of cell pH upon addition of luminal Na+ to values not different than the control group. We next examined NHE activity in vehicle- and acid-gavaged wild-type, NHE3-null, and NHE8-null mice. As shown in Fig. 8, there was stimulation in NHE activity with acidosis in all groups, although the stimulation by acidosis in wild-type mice was small and was not present upon readdition of Na+ to the tubular lumen (Table 5). As shown in Table 5, dpHi/dt was also faster in NHE3- and NHE8-null mice proximal tubules with readdition of Na+ to the tubular lumen with acidosis compared with NHE3 and NHE8 vehicle-treated control mice. Thus, NHE3 and NHE8 can both compensate for metabolic acidosis in neonatal mice.
Table 5.
pHi in the presence or absence of luminal Na+ in gavaged Mice and dpHi/dt with luminal Na+ removal and readdition
| N | Baseline pHi | dpHi/dt With Luminal Na+ Removal | 0-Na+ pHi | dpHi/dt With Luminal Na+ Addition | Recovery pHi | |
|---|---|---|---|---|---|---|
| NHE3+/+/NHE8+/+ | ||||||
| Vehicle gavage | 9 | 7.44 ± 0.05 | 1.41 ± 0.06 | 7.15 ± 0.05* | 1.97 ± 0.25 | 7.42 ± 0.05 |
| Acid gavage | 11 | 7.48 ± 0.07 | 1.86 ± 0.15† | 7.20 ± 0.06* | 2.25 ± 0.23 | 7.52 ± 0.07 |
| NHE3−/−/NHE8+/+ | ||||||
| Vehicle gavage | 9 | 7.40 ± 0.09 | 0.89 ± 0.08 | 7.24 ± 0.10* | 1.02 ± 0.16 | 7.42 ± 0.09 |
| Acid gavage | 10 | 7.48 ± 0.05 | 1.48 ± 0.07† | 7.26 ± 0.05* | 1.74 ± 0.23† | 7.50 ± 0.06 |
| NHE3+/+/NHE8−/− | ||||||
| Vehicle gavage | 10 | 7.39 ± 0.06 | 1.03 ± 0.15 | 7.17 ± 0.06* | 1.36 ± 0.22 | 7.40 ± 0.06 |
| Acid gavage | 12 | 7.39 ± 0.06 | 1.78 ± 0.15‡ | 7.15 ± 0.05* | 2.41 ± 0.26‡ | 7.45 ± 0.07 |
Values are means ± SD; N, number of mice/group.
P < 0.01 vs. baseline and recovery pHi;
P < 0.05 vs. dpHi/dt in vehicle-treated mice;
P < 0.01 vs. dpHi/dt in vehicle-treated mice.
Fig. 8.

Effect of metabolic acidosis on NHE activity in wild-type, NHE3-null, and NHE8-null neonatal mice. A: metabolic acidosis increases NHE activity in wild-type mice. B: metabolic acidosis increases NHE activity in NHE3-null mice. C: metabolic acidosis increases NHE activity in NHE8-null mice.
DISCUSSION
Previous studies have examined the importance of NHE3 in proximal tubule acidification using adult NHE3-null mice (6, 21, 25). Adult NHE3-null mice have Na+ wasting, hypotension, hyperkalemia, and acidosis (21). There is a compensation for the absence of NHE3 in adult mice in several nephron segments that is likely due to the volume depletion and metabolic acidosis in these mice. The predominant compensatory mechanism for volume depletion in NHE3-null mice is a decrease in the glomerular filtration rate mediated by tubular glomerular feedback, which decreases the filtered load of Na+ and bicarbonate (12, 22). In addition, NHE3-null mice have an increase in NaPi-2a protein abundance, an increase in the 70-kDa form of the γ-subunit of the epithelial Na+ channel (ENaC) (12), as well as an increase in anion exchenger 1 and ENaC α-subunit mRNA abundance (25). There is no change in the abundance of other Na+ transporters in the distal nephron, such as the Na+-K+-Cl− cotransporter, Na+-Cl− cotransporter, or basolateral Na+-K+-ATPase α1-subunit (12). While there is not a significant increase in proximal tubule H+-ATPase activity in NHE3-null mice (32), NHE3-null mice have an increase in H+-ATPase in the cortical and medullary collecting duct and an increase in H+-K+-ATPase in the medullary collecting duct (23).
The proximal tubule has Na+/H+ exchange activity in NHE3-null mice (13), which is likely due to NHE8 (6, 8, 16, 17). We have previously examined the expression of NHE8 and NHE activity in adult NHE3-null mice and the expression and activity of NHE3 in adult NHE8-null mice (6). Adult NHE3-null mice had metabolic acidosis and a lower rate of proximal tubule NHE activity than wild-type controls. There was an increase in total protein and brush-border membrane NHE8 expression in NHE3-null mice compared with control mice, consistent with a compensation for the absence of NHE3 by an upregulation of NHE8. Adult NHE8-null mice did not have metabolic acidosis and had comparable Na+/H+ exchange activity as wild-type mice. While adult NHE8-null mice had comparable NHE3 mRNA and total protein abundance as control mice, there was an upregulation of brush-border membrane NHE3 protein abundance. The mechanism for the increase in NHE3 was not clear.
Other studies found that there is compensation for the absence of one transporter by increasing the expression of a different isoform (27). There are two NaPi-2 cotransporters on the apical membrane of the proximal tubule, designated as NaPi-2a and NaPi-2c. NaPi-2a is the predominant Na+-dependent phosphate transporter in adult rodents, whereas NaPi-2c is highly expressed in weaning rodents and has relatively low expression in adult rodents (26). The relative importance of these phosphate transporters has been clarified using NaPi-2a- and NaPi-2c-null as well as double-knockout mice (27). NaPi-2a-null mice have hypophosphatemia and a higher fractional excretion of phosphate compared with control mice (7, 27), whereas the serum phosphorus and fractional excretion of phosphorus are normal in adult NaPi-2c-null mice (27). From these data, it appears that NaPi-2c plays a very minor role in phosphate transport in the adult mouse. However, NaPi-2a/NaPi-2c double-knockout mice have a lower serum phosphorus level and higher fractional excretion of phosphate than NaPi-2a-null mice, indicating that NaPi-2c is likely playing a compensatory role in NaPi-2a-null mice (27).
The present study examined the relative importance of NHE3 and NHE8 in the neonate using neonatal NHE3- and NHE8-null mice. All mice had comparable weights at the time of study at ∼10 days of age, an age when both NHE3 and NHE8 are expressed in wild-type mice (29). We found that unlike adult NHE3 mice (25), neither NHE3- nor NHE8-null neonatal mice had any acid base disturbance at baseline. There was no compensatory increase in NHE3 mRNA, total protein, or brush-border membrane abundance in NHE8-null mice. NHE3-null mice had comparable NHE8 mRNA, total protein, and brush-border membrane abundance as wild-type control mice. Thus, there was no compensatory increase in NHE8 or NHE3 when the other NHE was knocked out in neonates. Na+/H+ exchange activities in NHE8- and NHE3-null mice were comparable at 10 days of age and significantly less than wild-type mice.
Renal proximal tubule acidification in the neonate has not been as well studied. We have previously shown that NHE activity was less in the neonate than in the adult (28, 29). We have previously examined the effect of metabolic acidosis on control mice (29). Neonatal mice with metabolic acidosis had comparable NHE3 and NHE8 mRNA abundance as vehicle-treated controls. There was an increase in both total and brush-border membrane NHE3 protein abundance with acidosis in neonates. Acidosis resulted in an increase in brush-border membrane NHE8 abundance, but there was no effect of acidosis in total cellular NHE8 protein abundance in neonates (29). In the present study, we found that NHE8 total protein abundance was increased by acidosis, whereas NHE3 total protein abundance was comparable to controls. The cause for this inconsistency is unclear.
The present study shows that acid gavage in wild-type, NHE3-null, and NHE8-null neonatal mice produced a comparable metabolic acidosis and that both NHE3 and NHE8 brush-border membrane protein abundance are increased by acidosis. The increase in NHE activity was comparable in both NHE3- and NHE8-null mice, demonstrating that both NHE3 and NHE8 can play a role in adaptation to metabolic acidosis in the neonate. It is interesting to note that the increase in NHE activity in NHE3- and NHE8-null mice with acidosis was far greater than that of wild-type mice. Indeed, the small increase in dpHi/dt in wild-type mice in acidemic compared with vehicle control was only seen with Na+ removal and not with readdition of Na+ to the lumen. This suggests that having both NHE3 and NHE8 mitigates the increase in Na+/H+ exchange activity with acidosis. The relative importance of these transporters in adaptation in the younger neonate that predominantly expresses NHE8 is unknown (8, 29). In conclusion, unlike adults, deletion of either NHE3 or NHE8 does not cause metabolic acidosis in the neonate. Both NHE3 and NHE8 contribute to neonatal proximal tubule acidification in the 10-day-old nursing mouse. This study directly demonstrates that there is an increase in both NHE3 and NHE8 activity in response to metabolic acidosis.
GRANTS
This work was supported by National Institute of Diabetes and Digestive and Kidney Diseases Grants DK-41612 and DK-078596 (to M. Baum) and P30-DK-079328 (to the O'Brien Center).
DISCLOSURES
No conflicts of interest, financial or otherwise, are declared by the author(s).
AUTHOR CONTRIBUTIONS
Author contributions: K.P., J.G., and M.B. conception and design of research; K.P., J.G., V.D., and M.B. performed experiments; K.P., J.G., V.D., and M.B. analyzed data; K.P., J.G., and M.B. interpreted results of experiments; K.P. and M.B. prepared figures; K.P., J.G., V.D., and M.B. edited and revised manuscript; K.P., J.G., V.D., and M.B. approved final version of manuscript; M.B. drafted manuscript.
ACKNOWLEDGMENTS
The authors thank Dr. Gary Shull for the NHE3-null mice.
REFERENCES
- 1.Alpern RJ, Chambers M. Cell pH in the rat proximal convoluted tubule. Regulation by luminal and peritubular pH and sodium concentration. J Clin Invest 78: 502–510, 1986. [DOI] [PMC free article] [PubMed] [Google Scholar]
- 2.Alpern RJ, Chambers M. Basolateral membrane Cl/HCO3 exchange in the rat proximal convoluted tubule. Na-dependent and -independent modes. J Gen Physiol 89: 581–598, 1987. [DOI] [PMC free article] [PubMed] [Google Scholar]
- 3.Baum M. Neonatal rabbit juxtamedullary proximal convoluted tubule acidification. J Clin Invest 85: 499–506, 1990. [DOI] [PMC free article] [PubMed] [Google Scholar]
- 4.Baum M. Developmental changes in rabbit juxtamedullary proximal convoluted tubule acidification. Pediatr Res 31: 411–414, 1992. [DOI] [PubMed] [Google Scholar]
- 5.Baum M, Dwarakanath V, Alpern RJ, Moe OW. Effects of thyroid hormone on the neonatal renal cortical Na+/H+ antiporter. Kidney Int 53: 1254–1258, 1998. [DOI] [PMC free article] [PubMed] [Google Scholar]
- 6.Baum M, Twombley K, Gattineni J, Joseph C, Wang L, Zhang Q, Dwarakanath V, Moe OW. Proximal tubule Na+/H+ exchanger activity in adult NHE8−/−, NHE3−/−, and NHE3−/−/NHE8−/− mice. Am J Physiol Renal Physiol 303: F1495–F1502, 2012. [DOI] [PMC free article] [PubMed] [Google Scholar]
- 7.Beck L, Karaplis AC, Amizuka N, Hewson AS, Ozawa H, Tenenhouse HS. Targeted inactivation of Npt2 in mice leads to severe renal phosphate wasting, hypercalciuria, and skeletal abnormalities. Proc Natl Acad Sci USA 95: 5372–5377, 1998. [DOI] [PMC free article] [PubMed] [Google Scholar]
- 8.Becker AM, Zhang J, Goyal S, Dwarakanath V, Aronson PS, Moe OW, Baum M. Ontogeny of NHE8 in the rat proximal tubule. Am J Physiol Renal Physiol 293: F255–F261, 2007. [DOI] [PMC free article] [PubMed] [Google Scholar]
- 9.Biemesderfer D, Pizzonia J, Abu-Alfa A, Exner M, Reilly R, Igarashi P, Aronson PS. NHE3: a Na+/H+ exchanger isoform of renal brush border. Am J Physiol Renal Fluid Electrolyte Physiol 265: F736–F742, 1993. [DOI] [PubMed] [Google Scholar]
- 10.Bobulescu IA, Dwarakanath V, Zou L, Zhang J, Baum M, Moe OW. Glucocorticoids acutely increase cell surface Na+/H+ exchanger-3 (NHE3) by activation of NHE3 exocytosis. Am J Physiol Renal Physiol 289: F685–F691, 2005. [DOI] [PMC free article] [PubMed] [Google Scholar]
- 11.Bradford MM. A rapid and sensitive method for the quantitation of microgram quantities of protein utilizing the principle of protein-dye binding. Anal Biochem 72: 248–254, 1976. [DOI] [PubMed] [Google Scholar]
- 12.Brooks H, Sorensen A, Terris J, Schultheis P, Lorenz J, Shull G, Knepper M. Profiling of renal tubule Na+ transporter abundances in NHE3 and NCC null mice using targeted proteomics. J Physiol 530: 359–366, 2001. [DOI] [PMC free article] [PubMed] [Google Scholar]
- 13.Choi JY, Shah M, Lee MG, Schultheis PJ, Shull GE, Muallem S, Baum M. Novel amiloride-sensitive sodium-dependent proton secretion in the mouse proximal convoluted tubule. J Clin Invest 105: 1141–1146, 2000. [DOI] [PMC free article] [PubMed] [Google Scholar]
- 14.Dagan A, Gattineni J, Cook V, Baum M. Prenatal programming of rat proximal tubule Na+/H+ exchanger by dexamethasone. Am J Physiol Regul Integr Comp Physiol 292: R1230–R1235, 2007. [DOI] [PMC free article] [PubMed] [Google Scholar]
- 15.Gattineni J, Sas D, Dagan A, Dwarakanath V, Baum M. Effect of thyroid hormone on the postnatal renal expression of NHE8. Am J Physiol Renal Physiol 294: F198–F204, 2008. [DOI] [PMC free article] [PubMed] [Google Scholar]
- 16.Goyal S, Mentone S, Aronson PS. Immunolocalization of NHE8 in rat kidney. Am J Physiol Renal Physiol 288: F530–F538, 2005. [DOI] [PubMed] [Google Scholar]
- 17.Goyal S, Vanden Heuvel G, Aronson PS. Renal expression of novel Na+/H+ exchanger isoform NHE8. Am J Physiol Renal Physiol 284: F467–F473, 2003. [DOI] [PubMed] [Google Scholar]
- 18.Gupta N, Dwarakanath V, Baum M. Maturation of the Na/H antiporter (NHE3) in the proximal tubule of the hypothroid adrenalectomized rat. Am J Physiol Renal Physiol 287: F521–F527, 2004. [DOI] [PMC free article] [PubMed] [Google Scholar]
- 19.Henning SJ. Plasma concentrations of total and free corticosterone during development in the rat. Am J Physiol Endocrinol Metab Gastrointest Physiol 235: E451–E456, 1978. [DOI] [PubMed] [Google Scholar]
- 20.Joseph C, Gattineni J, Dwarakanath V, Baum M. Glucocorticoids reduce renal NHE8 expression. Physiol Rep 1: e00031, 2013. [DOI] [PMC free article] [PubMed] [Google Scholar]
- 21.Ledoussal C, Lorenz JN, Nieman ML, Soleimani M, Schultheis PJ, Shull GE. Renal salt wasting in mice lacking NHE3 Na+/H+ exchanger but not in mice lacking NHE2. Am J Physiol Renal Physiol 281: F718–F727, 2001. [DOI] [PubMed] [Google Scholar]
- 22.Lorenz JN, Schultheis PJ, Traynor T, Shull GE, Schnermann J. Micropuncture analysis of single-nephron function in NHE3-deficient mice. Am J Physiol Renal Physiol 277: F447–F453, 1999. [DOI] [PubMed] [Google Scholar]
- 23.Nakamura S, Amlal H, Schultheis PJ, Galla JH, Shull GE, Soleimani M. HCO3− reabsorption in renal collecting duct of NHE-3-deficient mouse: a compensatory response. Am J Physiol Renal Physiol 276: F914–F921, 1999. [DOI] [PubMed] [Google Scholar]
- 24.Preisig PA, Ives HE, Cragoe , Alpern RJ, Rector FC Jr. Role of the Na+/H+ antiporter in rat proximal tubule bicarbonate absorption. J Clin Invest 80: 970–978, 1987. [DOI] [PMC free article] [PubMed] [Google Scholar]
- 25.Schultheis PJ, Clarke LL, Meneton P, Miller ML, Soleimani M, Gawenis LR, Riddle TM, Duffy JJ, Doetschman T, Wang T, Giebisch G, Aronson PS, Lorenz JN, Shull GE. Renal and intestinal absorptive defects in mice lacking the NHE3 Na+/H+ exchanger. Nat Genet 19: 282–285, 1998. [DOI] [PubMed] [Google Scholar]
- 26.Segawa H, Kaneko I, Takahashi A, Kuwahata M, Ito M, Ohkido I, Tatsumi S, Miyamoto K. Growth-related renal type II Na/Pi cotransporter. J Biol Chem 277: 19665–19672, 2002. [DOI] [PubMed] [Google Scholar]
- 27.Segawa H, Onitsuka A, Furutani J, Kaneko I, Aranami F, Matsumoto N, Tomoe Y, Kuwahata M, Ito M, Matsumoto M, Li M, Amizuka N, Miyamoto K. Npt2a and Npt2c in mice play distinct and synergistic roles in inorganic phosphate metabolism and skeletal development. Am J Physiol Renal Physiol 297: F671–F678, 2009. [DOI] [PubMed] [Google Scholar]
- 28.Shah M, Gupta N, Dwarakanath V, Moe OW, Baum M. Ontogeny of Na+/H+ antiporter activity in rat proximal convoluted tubules. Pediatr Res 48: 206–210, 2000. [DOI] [PMC free article] [PubMed] [Google Scholar]
- 29.Twombley K, Gattineni J, Bobulescu IA, Dwarakanath V, Baum M. Effect of metabolic acidosis on neonatal proximal tubule acidification. Am J Physiol Regul Integr Comp Physiol 299: R1360–R1368, 2010. [DOI] [PMC free article] [PubMed] [Google Scholar]
- 30.Vandesompele J, De Preter K, Pattyn F, Poppe B, Van Roy N, De Paepe A, Speleman F. Accurate normalization of real-time quantitative RT-PCR data by geometric averaging of multiple internal control genes. Genome Biol 3: 1–12, 2002. [DOI] [PMC free article] [PubMed] [Google Scholar]
- 31.Walker P, Dubois JD, Dussault JH. Free thyroid hormone concentrations during postnatal development in the rat. Pediatr Res 14: 247–249, 1980. [DOI] [PubMed] [Google Scholar]
- 32.Wang T, Yang CL, Abbiati T, Schultheis PJ, Shull GE, Giebisch G, Aronson PS. Mechanism of proximal tubule bicarbonate absorption in NHE3 null mice. Am J Physiol Renal Physiol 277: F298–F302, 1999. [DOI] [PubMed] [Google Scholar]
- 33.Wu MS, Biemesderfer D, Giebisch G, Aronson PS. Role of NHE3 in mediating renal brush border Na+-H+ exchange. Adaptation to metabolic acidosis. J Biol Chem 271: 32749–32752, 1996. [DOI] [PubMed] [Google Scholar]
- 34.Wysocki SJ, Segal W. Influence of thyroid hormones on enzyme activities of myelinating rat central-nervous tissues. Eur J Biochem 28: 183–189, 1972. [DOI] [PubMed] [Google Scholar]


