Background: Inositol 1,4,5-trisphosphate receptor (InsP3R3) is critical to secretion in a number of epithelia and its expression is lost in secretory disorders.
Results: miR-506 down-regulates InsP3R3 expression and impairs Ca2+ signaling and secretion.
Conclusion: Post-translational regulation of InsP3R3 expression by miR-506 might contribute to disease phenotype.
Significance: Restoring InsP3R3 expression by use of anti-miR-506 therapy might be beneficial in a variety of secretory disorders.
Keywords: Calcium; Epithelial Cell; Inositol 1,4,5-Trisphosphate (IP3); MicroRNA (miRNA); Secretion; Cholangiocytes; IP3 Receptor Type III; IP3 Receptor Type III H69 Cells; Cholangiocytes; miR-506
Abstract
The type III isoform of the inositol 1,4,5-trisphosphate receptor (InsP3R3) is apically localized and triggers Ca2+ waves and secretion in a number of polarized epithelia. However, nothing is known about epigenetic regulation of this InsP3R isoform. We investigated miRNA regulation of InsP3R3 in primary bile duct epithelia (cholangiocytes) and in the H69 cholangiocyte cell line, because the role of InsP3R3 in cholangiocyte Ca2+ signaling and secretion is well established and because loss of InsP3R3 from cholangiocytes is responsible for the impairment in bile secretion that occurs in a number of liver diseases. Analysis of the 3′-UTR of human InsP3R3 mRNA revealed two highly conserved binding sites for miR-506. Transfection of miR-506 mimics into cell lines expressing InsP3R3–3′UTR-luciferase led to decreased reporter activity, whereas co-transfection with miR-506 inhibitors led to enhanced activity. Reporter activity was abrogated in isolated mutant proximal or distal miR-506 constructs in miR-506-transfected HEK293 cells. InsP3R3 protein levels were decreased by miR-506 mimics and increased by inhibitors, and InsP3R3 expression was markedly decreased in H69 cells stably transfected with miR-506 relative to control cells. miR-506-H69 cells exhibited a fibrotic signature. In situ hybridization revealed elevated miR-506 expression in vivo in human-diseased cholangiocytes. Histamine-induced, InsP3-mediated Ca2+ signals were decreased by 50% in stable miR-506 cells compared with controls. Finally, InsP3R3-mediated fluid secretion was significantly decreased in isolated bile duct units transfected with miR-506, relative to control IBDU. Together, these data identify miR-506 as a regulator of InsP3R3 expression and InsP3R3-mediated Ca2+ signaling and secretion.
Introduction
Cytosolic Ca2+ (Ca2+i) signaling controls a multitude of cellular effects including proliferation, gene transcription, metabolism, and secretion (1–5). In epithelial cells including pancreatic acinar cells, parotid acinar epithelial cells, and biliary cells, Ca2+i has been shown to regulate both electrolyte secretion and exocytic release of vesicles (6–8). In these cell types the major intracellular Ca2+ release channels are the inositol 1,4,5-trisphosphate receptors (InsP3Rs),3 which have 3 isoforms in mammals, namely InsP3R1, InsP3R2, and InsP3R3 (9). These isoforms are endoplasmic reticulum membrane proteins, which are expressed to different degrees and localize to distinct subcellular regions in different epithelia. For example, in cholangiocytes, cells that line the intra- and extra-hepatic bile ducts, InsP3R3 is the major isoform and is concentrated along the subapical portion of the endoplasmic reticulum where it regulates bicarbonate (HCO3−) and chloride (Cl−) secretion into the bile (8, 10). In contrast, hepatocytes express mainly InsP3R2, which are also concentrated along the apical (canalicular) membrane where it modulates secretion of bile solutes such as bilirubin and bile acids (5, 11, 12). Furthermore, InsP3R3 and InsP3R2 double knock-out mice have severe defects of pancreatic zymogen secretion (13), underscoring the importance of these intracellular Ca2+ channels for normal epithelial secretory function.
Much interest has been dedicated to studying mechanisms of post-translational regulation of InsP3Rs (14). These efforts have identified several such mechanisms that include phosphorylation, glycosylation, oxidation, and ubiquitination as well as binding to a range of regulatory proteins. Nevertheless, the mechanisms driving InsP3R expression at the transcriptional level are poorly understood. TNFα has been shown to regulate InsP3R1 expression in neurons via specificity protein (SP-1) response elements on the InsP3R1 promoter (15). More recently, microRNAs (miRNAs) have been implicated in the regulation of InsP3Rs. Specifically, miR-133 expression was shown to be involved in a feedback loop regulation of InsP3R2 in cardiomyocytes during hypertrophy (16).
MicroRNAs (miRNAs) are small 22–23-nucleotide non-coding RNAs, which inhibit gene expression by either complete or partial pairing to seed sequences located at the 3′-untranslated regions (UTR) of mRNAs. Changes in expression levels of several miRNAs occur in various liver disorders ranging from fibrosis to cholestasis, and serum levels of specific microRNAs have been proposed as diagnostic and disease progression biomarkers (17, 18). For example, systemic silencing of miR-33 levels in mice increases bile flow and cholesterol excretion due to specific changes in expression of multiple hepatic transporters (ABCA1, ABCG5, and G8; ABCB11 and ATP8B1) (19). A second example is miR-506, which modulates fluid secretion in cholangiocytes through regulation of the anion exchanger 2 (20). Moreover miR-506 is up-regulated in cholangiocytes of patients with primary biliary cirrhosis (PBC), an autoimmune disease of the liver characterized by loss of bile ducts and impaired bile secretion (20). Interestingly, PBC is among several cholestatic diseases in which InsP3R3 expression is lost from cholangiocytes (21) and loss of InsP3R3 impairs cholangiocyte Ca2+i signaling and secretion (8). However, the mechanism by which InsP3R3 and its Ca2+-dependent signaling are affected in cholestatic diseases is currently unknown. Here, the role of miRNAs in the regulation of InsP3R3 was investigated along with their potential role in the modulation of fluid secretion by cholangiocytes.
EXPERIMENTAL PROCEDURES
Materials
InsP3R3-specific monoclonal antibody and anti-GAPDH antibodies were obtained from BD Biosciences and Millipore, respectively. Anti-β-actin antibodies were from Sigma. Cell culture media, FBS, and Lipofectamine 2000 were obtained from Invitrogen. miR precursors, mimics, inhibitors, and negative controls were obtained either from Dharmacon Co., Ambion, TX, or from Exiqon, Boston, MA. All other chemicals were from Sigma or Fisher Scientific unless otherwise stated. DNA sequencing and oligo synthesis were carried out by the Yale Center for Genomic Analyses (YCGA), West Haven, CT.
Cell Lines
HEK293T cells were obtained from ATCC and cultured in DMEM supplemented with 10% FBS and penicillin/streptomycin. The H69 normal cholangiocyte cell line was a gift from Dr. Doug Jefferson, Tufts University, and grown in a 50/50% (v/v) DMEM/Ham's F-12 along with other additives as previously described (20). For routine subculturing, the cells were grown in rat collagen-1 substratum (to maintain polarized phenotype), whereas transfections were conducted on cells grown without collagen.
Human Liver Sections from Normal Controls and PBC Patients
Human liver tissue biopsies were obtained under the auspices of protocols approved by the Institutional Committee on the Protection of the Rights of Human Subjects (Yale University). The Human Investigation Committee protocol number is HIC-1208010665.
Generation of Wild-type and Mutant Human InsP3R3-UTR-Luc Plasmid Constructs
Wild-type 3′-UTR-Luc construct
InsP3R3–3′-UTR-Luc construct was made by amplification of the 808-bp long 3′-UTR of the InsP3R3 mRNA by PCR using the sense and antisense primers as indicated in Table 1. The template for the PCR consisted of the BAC DNA containing part of the InsP3R3 gene (BAC clone-NCBI accession number AL139044). PCR were carried out using Phusion High Fidelity Polymerase according the instructions from the manufacturer (FINNzymes/New England Biolabs, MA). The correctly amplified product was cloned into a Qiagen PCR cloning vector pDrive as per the manufacturer's instructions. After verification by restriction enzyme digestion and sequencing of the pDrive clones, the insert containing the 3′-UTR fragment was cloned in the pMIR-Report vector (Ambion) into HindIII and MluI sites downstream of the firefly luciferase coding sequence using routine cloning methods with the Rapid Ligation kit (New England Biolabs, MA). Maxipreps prepared from colonies obtained after the final cloning were again verified by DNA sequencing to confirm authenticity of the inserts.
TABLE 1.
Oligonucleotides used in InsP3R3–3′-UTR constructs and in the mutagenesis of miR-506 binding sites
| Oligo name | Sequence 5′ → 3′ |
|---|---|
| InsP3R3–3′-UTR Fa | ATGCTCATCACTGGAGACTGCG |
| InsP3R3–3′-UTR | AGGGGCTCTTGTTCCTGTCTTCTG |
| 3′-UTR PWF | CGCGTCACTGGGACTCAGTTTACCTTAAT |
| GCCTTAGCAGAAGATAAATCCTAAGA | |
| 3′-UTR PWR | AGCTTTTCTAGGAGGATTTATCTTCTGC |
| TAAGGCATTAAGGTAAACTGAGTCCCAGTG | |
| 3′-UTR PMF | CGCGTCACTGGGACTCAGTTTACCTTAATG |
| AAGTAGCAGAAGATAAATCCTAAGA | |
| 3′-UTR PMR | AGCTTTCTTAGGATTTATCTTCTGCTA[i]CTTC |
| ATTAAGGTAAACTGAGTCCCAGTG | |
| 3′-UTR DWF | CGCGTCAAATCCTTTGGCCTGAGAACTAAT |
| ATGTTAATTGCCTTAAATAAATTAATAGAAATCTAGTCCGTTAAAAA | |
| 3′-UTR DWR | AGCTTTTTTTAACGGACTAGATTTCTATTAA |
| TTTATTTAAGGCAATTAACATATTAGTTCTCAGGCCAAAGGATTTG | |
| 3′-UTR DMF | CGCGTCAAATCCTTTGGCCTGAGAACTAAT |
| ATGTTAATTG[i]AAGTAAATAAATTAATAGAAATCTAGTCCGTTAAAAA | |
| 3′-UTR DMR | AGCTTTTTTTTAACGGACTAGATTTCTATTA |
| ATTTATTTA[i]CTTCAATTAACATATTAGTTCTCAGGCCAAAGGATTG |
a The following abbreviations are used: F, forward; R, reverse; PW and PM, proximal wild-type and mutant miR-506 binding site; DW and DM, distal wild-type and mutant miR-506 binding site. Mutated bases are in italics and underlined.
Mutated proximal and distal miR-506 binding site-Luc constructs
Initial attempts to mutate the proximal and distal miR-506 binding sites in the context of the entire 3′-UTR failed after multiple trials due to the high frequency of AT-rich sequences. Similar failure to mutate miR-binding sites has been previously reported in the literature (22). Subsequently oligos containing the wild-type and mutated proximal and distal binding sites with surrounding sequences and HindIII and MluI enzyme adapters were synthesized (see Table 1). Briefly, the cognate sense and antisense wild-type and mutated oligos were annealed, phosphorylated using T4 kinase, and ligated to similarly digested pMIR-Report vector downstream of the luciferase coding sequence. DNA sequencing of the plasmid preps obtained after ligation and transformation confirmed successful cloning of the respective fragments.
Transfection of HEK293 and H69 Cell Lines
Transient transfections
Luciferase Reporter Gene Assays
HEK293 and H69 cells were plated in 24-well plates at a density of 1 × 10⁵ cells/well 24 h before transfection. miR-506 mimics and inhibitors and Negative controls 1 and 2 (Ambion/ABI) were transfected at a final concentration of 50 nm in combination with wild-type or mutated InsP3R3–3′UTR-Luc (0.25 μg/well) in Opti-MEM complexed to Lipofectamine 2000 at a ratio of 1:3 (μg:μl) as per the manufacturer's instructions. In the mutational studies reported in Fig. 4, we used LNA-modified miR-506 mimics and inhibitors (Exiqon) because the unmodified reagents showed nonspecific effects. Twenty-four hours later, the medium was changed to DMEM (HEK293) or H69 medium. Forty-eight hours after transfection cell lysates were prepared in 250 μl of 1 × Passive Lysis Buffer (Promega). Firefly and Renilla luciferase activities were assayed in 50 μl of the lysate using the Dual Luciferase Kit (Promega) as per the manufacturer's instructions using an Optocomp I luminometer (MGM Instruments, Hamden, CT). Relative luciferase activities were reported after normalization of the individual values to Renilla luciferase.
FIGURE 4.
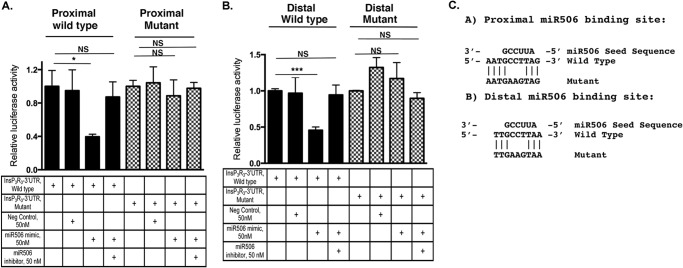
InsP3R3 proximal and distal miR-506 binding sites are both functional. Isolated wild-type and mutant proximal (A) and distal (B) miR-506 binding sites with surrounding sequences were cloned downstream of luciferase as described under “Experimental Procedures.” HEK293 cells were transfected with either the wild-type or mutant plasmid constructs and cotransfected with 50 nm negative controls, miR-506 mimics, or inhibitors. Relative luciferase activity compared with empty plasmids is shown. PW and PM, proximal wild-type and mutant; DW and DM, distal wild-type and mutant. C, schematic of the proximal and distal miR-506 wild-type and mutant binding sites aligned to the miR-506 seed sequence to show the mutations introduced into the seed region of the constructs employed in A and B. NS, not significant compared with control.
Western Blotting after miR-506 Mimic, Inhibitor, or Negative Control Transfection
To examine the effect of miR-506 overexpression on InsP3R3 proteins levels, H69 cells were plated in 6-well plates at a density of 1 × 10⁵ cells/well 24 h prior to transfection. The following day, the cells were transfected with miR-506 mimics, inhibitors, or negative controls at a concentration of 50 and 100 nm after complexing with Lipofectamine RNAiMax at a ratio of 1:3 (μl/μl) in Opti-MEM medium. The cells were fed with H69 medium after 24 h. Forty-eight hours after transfection, the cells were lysed with 150 μl of M-PER (Mammalian Protein Extracation Reagent, Pierce Scientific) containing proteolytic and phosphatase inhibitor mixture (Sigma). Western blotting was carried out after protein quantitation.
Stable transfection with control and miR-506 plasmids and generation of stably transfected cell lines
For construction of the H69 cholangiocyte cell line stably expressing miR-506, we used the BLOCK-IT PolII miR RNA Expression Vector Kit with EmGFP (Invitrogen). Pre-miR-506 sequence was obtained from Microcosm Target Resource. The vector used in this kit transcribes an inserted pre-miR sequence from a PolII promoter and contains flanking and loop sequences for correct processing. In addition, the construct contains a GFP coding sequence controlled by CMV promoter so that transfected cells also express GFP. Sense and antisense oligos of the corresponding sequence (available on request) with the adapter sequence (5-ACGA and 3′-CAGG) were synthesized and annealed followed by ligation to the pcDNA 6.2 GW/EmGFP-miR-validated vector. Verified plasmid containing the correct Pre-miR-506 sequence was transfected into H69 cells along with a negative control plasmid (pcDNA 6.2 GW/miR negative control plasmid) using Lipofectamine 2000 in suspension. Twenty-four hours after the cells were plated, the cells were selected using Blasticidin (resistance for which is encoded by a cassette on the plasmid vector) at a concentration 8 μg/ml of H69 medium and the medium was changed every 2–3 days. The cells were simultaneously also monitored for expression of GFP fluorescence using an inverted microscope. To obtain pure populations of negative control or miR-506 stably expressing cells, the resistance of H69 cells were sorted using a BD FACSAria III Cytometer Separator. Successful isolation of miR-506 expressing cells was verified by real-time PCR quantitation of miR-506 expression using the TaqMan miR quantitation assay kit (Applied Biosystems, Invitrogen).
Ca2+ Signaling Studies
Control-miR and miR-506-expressing H69 cells were plated on collagen I-coated coverslips 3 days prior to Ca2+ imaging. Cells were loaded with 3 μm Fluo-4/AM (Invitrogen) for 30 min at 37 °C and then transferred to a custom-built perfusion chamber on the stage of a Zeiss LSM 710 Duo confocal microscope (Zeiss, Thornwood, NY). Cells were perfused with a HEPES-based buffer and imaged at 1 Hz using a ×40 water-immersion lens with excitation at 488 nm and emission collected above 505 nm. Time lapse data were processed in ImageJ (NIH) and fluorescence data were normalized as follows: F/F0 × 100, where F is the fluorescence at any given time point and F0 is the fluorescence at baseline (5).
Secretion Assays in Rat Isolated Bile Duct Units
Isolated Bile Duct Units (IBDUs) were prepared as previously described (23). IBDUs were treated with 30, 40, or 50 nm miR-506 or negative control number 2 by addition of the miRs followed by shaking at 37 °C for 30 min in shaking incubator (Innova4080, New Brunswick Scientific). Following this step, IBDU fragments were placed on Matrigel-coated coverslips inside 12-well plates for 48 h in the presence of the miRs. Secretion assays were performed on IBDUs, which had visible, sealed lumens. Viability of the IBDUs were assessed by Trypan Blue exclusion, which was ∼95%. There was no difference in viability between negative control miR-treated and miR-506-treated (30 and 40 nm) IBDUs. However, treatment with 50 nm miR-506 resulted in IBDUs that looked unhealthy relative to the lower concentrations. Video microscopic optical planimetry was employed to study secretion by the IBDUs after treatment with 10 μm forskolin, which has been shown to stimulate secretion in cholangiocytes in an autocrine fashion that depends on InsP3R3-mediated Ca2+i signaling (8). The units were observed initially for 5 min after which they were treated with forskolin and observed for an additional 30 min. Images were obtained every 5 min until the end of the time period. Changes in lumen volumes were used as an index of secretion after normalization to the initial value (23). Results are expressed as percent expansion relative to the initial value.
Western Blotting Analyses
Protein extracts of HEK293, H69 cholangiocytes stably transfected or transiently transfected with control and miR-506 mimics and inhibitors were lysed for 15 min on ice in 150 μl of M-PER (Pierce Scientific) containing protease and phosphatase inhibitor mixtures. Cell debris were removed by centrifugation at 16,000 rpm (21,130 × g) for 15 min at 4 °C in an Eppendorf microcentrifuge. Protein concentration in the supernatant was estimated using BSA as standard (Bio-Rad). 15–45 μg of protein in 1 × Laemmli buffer was loaded per lane of a 4–20% Mini-Protean TGX precast gels (Bio-Rad) and run at 200 volts for 40 min. Pre-stained Precision Plus Dual Color Protein standards (Bio-Rad) were also run on the same gels to estimate protein molecular size. The fractionated proteins were blotted using a Bio-Rad Semi-dry blotter (Trans-Blot SD semi-dry blotter cell) to pre-cut PVDF membranes (Immunoblot PVDF membrane, 7.0 × 8.5 cm) in Tris glycine/methanol (20%) buffer at 20 V for 90 min. Following protein transfer, the blots were blocked with 5% Nonfat Dry Blot Omniblok (American BioAnalytical, Natick, MA) in 1 × blocking buffer (diluted from 10 × Tris-buffered saline with 0.5% Tween 20, KPL, Gaithersburg, MD). Following blocking, incubation with primary antibodies (to InsP3R3 and GAPDH), with secondary peroxidase-conjugated antibodies and the washing steps were performed as previously described (20). Signals developed with ECL reagent (Millipore) were quantitated using ImageJ.
Total RNA Isolation and Real-time PCR Assays
Total RNA was isolated from various cell types as denoted in the figure legends using the RNAeasy Mini Kit (Qiagen, Gaithersburg, MD) according to the manufacturer's instructions. Quantitation of RNA was done using Nanodrop 2000. cDNA synthesis was carried out using the Affinity Script Multi Temperature cDNA Synthesis Kit (Agilent Biotechnologies, Santa Clara, CA) on 2 μg of total RNA as per the manufacturer's directions. The cDNA was diluted 10-fold and 5 μl of the diluted cDNA (100 ng) per well was utilized for qPCR using either SYBR Green or TaqMan as the detection method employing Power SYBR Green or TaqMan Gene expression master mixtures. Oligonucleotide primers used in the SYBR Green qPCR assays will be provided on request. For TaqMan assays, labeled 20× primers were purchased from ABI Biosystems as follows: 1) InsP3R3-Hs01573555_m1; 2) KRT19-Hs01051611-gH; and 3) ACTB-Hs010606665_g1. In SYBR Green assays, normalization was achieved using 36B4 as a housekeeping control, and β-Actin levels in TaqMan assays. All qPCR were done using an ABI 9500 machine located in the Liver Center of Yale School of Medicine, New Haven, CT. Relative expression was calculated using the comparative CT method (ΔΔCT method) as per the manufacturer's instructions (Applied Biosystems). Primer sequences not included here are available on request.
Matrix Metalloproteinase Activity Assay
Matrix Metalloproteinase activity was measured in wild-type H69, control miR, and miR-506 cells as described by us (24).
In Situ Hybridization of miR-506 Using Normal Control and PBC Liver Sections
In situ hybridization of miR-506 in formalin-fixed paraffin-embedded human liver biopsies from control or PBC patients (5 sections in each category) were analyzed using a combination of two methods previously described (20, 25). Briefly, the sections were deparaffinized in xylene followed by rehydration in decreasing ethanol concentrations. Samples were then treated with proteinase K at 37 °C for 10 min, rinsed in 0.2% glycine, PBS, and fixed in 4% paraformaldehyde for 10 min at room temperature. After rinsing with PBS, they were first washed twice for 10 min each with 0.13 m 1-methylimadazole and then fixed for 1 h in 1-ethyl-3-(3-dimethylaminopropyl)carbodiimide (Thermo Scientific) for 1 h. Endogenous peroxidase activity was then blocked with incubation 1% H2O2 for 30 min. The slides were subsequently pre-hybridized in a hybridization oven for 2 h at 51 °C in pre-hybridization solution (50% formamide, 5× SSC, 0.1% Tween, 50 μg/ml of heparin, and 500 μg ml of yeast tRNA). They were then hybridized at the same temperature overnight in the same hybridization solution containing 40 nm of either scrambled miR-506 or U6 LNA probes (Exiqon, Boston, MA). The probes were labeled with digoxigenin at both the 5′- and 3′-ends. The probe sequences were as follows: 1) scrambled miR, 5′-GTGTAACACGTCTATACGCCCA-3′; 2) hsa-miR-506, 5′- UAAGGCACCCUUCUGAGUAGA-3′; and 3) hsa-U6, 5′-CACGAATTTGCGTGTCATCCTT-3′. The hybridization chamber was moistened with 2× SSC to prevent evaporation and the sections were further covered with RNase-free plastic coverslips to prevent evaporation (HybriSlip hybridization cover, 22 × 22 mm, Molecular Probes, Invitrogen). Following this step, the slides were washed under stringent conditions as follows: 1) 3 times for 30 min in 50% formamide, 2× SSC; and 2) 5 times for 5 min each in 1× PBS, 0.1% Tween 20 (PBS-T). Subsequently, the slides were blocked with 5% goat serum in 2% BSA/PBS for 1 h at room temperature. Afterward, they were incubated overnight at 4 °C with a 1:50 dilution of sheep anti-digoxigenin peroxidase conjugate (anti-digoxigenin POD Fab fragments, Roche Applied Science) and 1:300 dilution of pan-cytokeratin antibodies (polyclonal rabbit anti-cow Cytokeratin Wide Spectrum Screening, WSS, Dako Labs) in goat serum/BSA/PBS to label bile ducts. Following washing with PBS-T and PBS, the miRNA and U6 signals were then detected with the TSA Plus Signal Amplification Cyanine 5 System (PerkinElmer Life Sciences) following the manufacturer's instructions. The slides were then washed with PBS-T and PBS in the dark. Subsequent incubation was carried out with 1:500 dilution of anti-rabbit Alexa 488 for 1 h in BSA/PBS to detect the cytokeratin signals. The slides were washed with PBS-T and PBS and mounted in Prolong Gold Antifade reagent with DAPI to label nuclei (Molecular Probes, Invitrogen). The sections were imaged on a Leica SP5 confocal microscope using a ×40 1.4NA objective. Fluorescence signals were captured by sequential illumination with a 405-nm laser, 488 and 561 nm. Emission signals were collected between 415 and 475 nm for DAPI, 505 and 550 nm for Alexa 488 (Cytokeratin), and 570 and 650 nm for Cy5 (miR-506 probe). Images were exported as TIFF files and measurements of fluorescence were performed in ImageJ. For quantitation of the miR-506 expression, cyanine 5 signals in the entire bile duct area excluding the lumen (3 bile ducts per section) were quantitated in ImageJ and expressed as pixel intensity/μm.
Statistical Analysis
All experiments were carried out a total of three times, and data are represented as mean ± S.D. In transfection experiments each set was done in triplicate. Two-tailed Student's t tests were used (Microsoft Excel or Prism version 6) to determine whether the means from experimental groups compared with control groups (negative control miR-treated) were significantly different. p values were as indicated in the figures as follows: *, 0.05; **, 0.001; ***, 0.0001.
RESULTS
Human InsP3R3 Contains Two Binding Sites for miR-506 in Its 3′-UTR
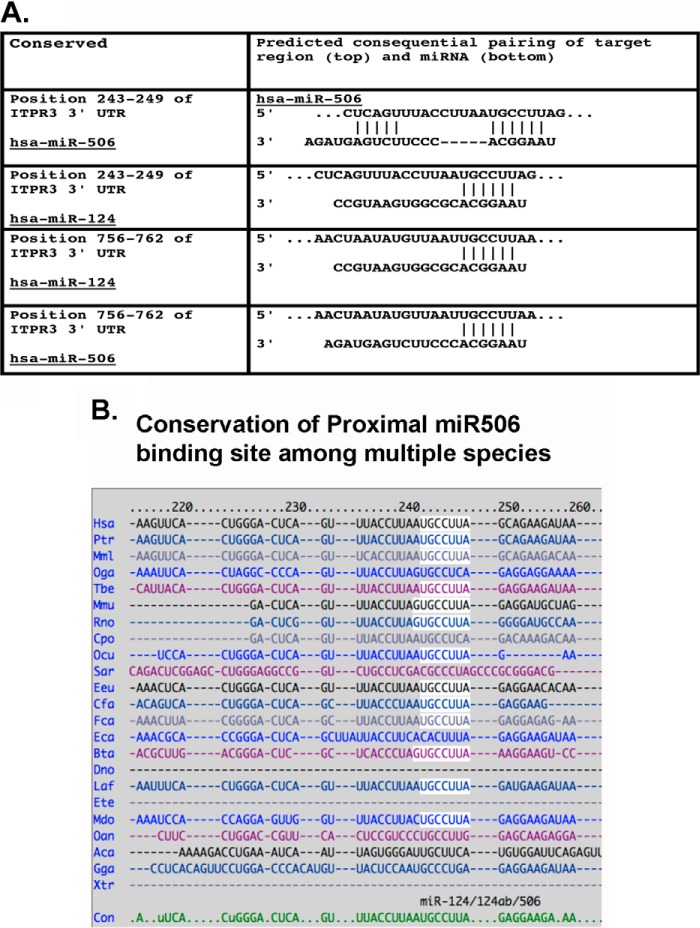
As a first step toward defining the role of epigenetic mechanisms of InsP3R3 regulation, the 3′-UTR of InsP3R3 mRNA (NCBI accession number NM_002224) was analyzed for microRNA binding sites using the TargetScan algorithm. As shown in Fig. 1A, InsP3R3 mRNA 3′-UTR had two binding sites for hsa-miR-506–3p, the proximal at 243–249 bp and the distal at 756–762 bp. Both sites had complete homology to the miR-506 seed sequence of 6 bp. Similar results were also obtained using the “Microcosm” algorithm. The miR-506 binding sites are highly conserved across multiple species suggesting an important function for this miR-mediated regulation of InsP3R3 (Fig. 1B).
FIGURE 1.
In silico analysis of InsP3R3 3′-UTR shows two binding sites for miR-506 and miR-124 (A) and the sites highly conserved across multiple species (B). A, potential miR-binding sites in the 3′-UTR of InsP3R3 mRNA were analyzed using the TargetScan algorithm. The table shows the alignment of the InsP3R3 mRNA 3′-UTR sequence to the recognition sequence of miR-506. A proximal site at position 243–249 bp and a distal site at 756–762 bp were identified. At both binding sites, there was perfect alignment in the leader sequence (base pair positions 2–8), although the proximal binding site had further homology at the upstream region. Although the same binding sites are also recognized by miR-124, functional analysis (see Fig. 2B) did not validate this result. miR-506 binding sites were also identified when a second algorithm (Microcosm) was used for analysis. B, the figure shows the alignment among multiple species (using Targetscan) in the miR-506 binding seed sequence of the proximal site suggesting an important function for this microRNA. A similar degree of conservation was also observed for the distal site (not shown).
InsP3R3 miR-506 Binding Sites Are Functional but Those for miR-124 Are Not
To evaluate whether the miR-506 binding sites are functional, we cloned the entire 3′-UTR of InsP3R3 mRNA downstream of the luciferase reporter gene as described under “Experimental Procedures.” The 3′-UTR-Luc reporter gene constructs were transfected into HEK293 cells and co-transfected with miR-506 mimic (50 nm) alone or miR-506 mimic and miR-506 inhibitor together. A negative control non-targeting miR sequence was used to rule out nonspecific effects. The reporter gene activities were compared with similarly transfected empty vector (pMIR-Reporter) and the results are shown in Fig. 2A. Cotransfections with miR-506 mimic alone or with miR-506 inhibitor did not have any significant effect on the empty vector. However, the miR-506 mimic down-regulated luciferase activity of the InsP3R3–3′UTR-Luc by 35% compared with negative control miR (n = 9, p = 0.007). Furthermore, addition of the miR-506 inhibitor together with miR-506 mimic rescued the inhibitory effect of the miR-506 mimic (n = 9, p = 0.015). As the in silico analysis indicated that miR-124 can bind to the same seed sequence (Fig. 1, A and B), we carried out the same transfection experiments with the miR-124 mimic and miR-124 inhibitor overexpression with the 3′-UTR-luc plasmids. The data in Fig. 2B show that the miR-124 mimic did not decrease the reporter activity suggesting that miR-124 does not bind to the InsP3R3 3′-UTR. The reason for the significant increase in activity with both miR-124 mimic and miR-124 inhibitor is probably due to nonspecific effects because both reagents increased the reporter activity. We investigated whether this down-regulation of mRNA (as shown by the luciferase assays) is reflected at the protein levels. Western blotting of the H69 normal human cholangiocyte cell line protein extract was performed after transfection with 50 or 100 nm miR-506 mimic or inhibitors and compared with untreated or negative control miR-transfected cells. A representative blot of such an experiment is shown in Fig. 3A and a quantitation of the InsP3R3 protein levels in Fig. 3B. Consistent with data on the reporter gene activity, InsP3R3 protein levels were decreased by miR-506 overexpression to 64 and 73% of negative control miR-transfected cells (n = 3, p = 0.02 and 0.03 for 50 and 100 nm, respectively). Again, transfection of the 50 and 100 nm miR-506 inhibitor led to a significant increase in InsP3R3 protein levels (185 and 137% of negative control respectively, n = 3, p = 0.005 and 0.04 for 50 and 100 nm). Taken together, these data establish that miR-506 is a post-transcriptional regulator of InsP3R3.
FIGURE 2.
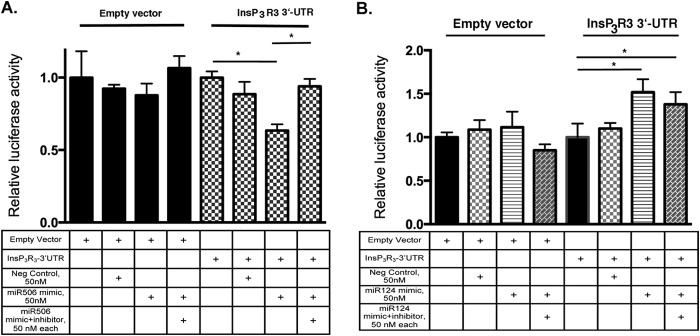
InsP3R3–3′-UTR-Luciferase reporter activity is inhibited by miR-506 mimics (A) but not by miR-124 in HEK293 cells (B). A, HEK293 cells were transiently transfected with InsP3R3–3′-UTR-Luc or a control vector and co-transfected with 50 nm miR-506 mimic or mimic and inhibitor. Luciferase activity after 48 h was assayed as described under “Experimental Procedures.” miR-506 mimic inhibited reporter activity, which was abrogated by inhibitor coexpression. B, under the same conditions as in A, miR-124 mimic or mimic + inhibitor expression had no specific effects on the reporter activity suggesting a specific effect of miR-506 on InsP3R3 mRNA.
FIGURE 3.
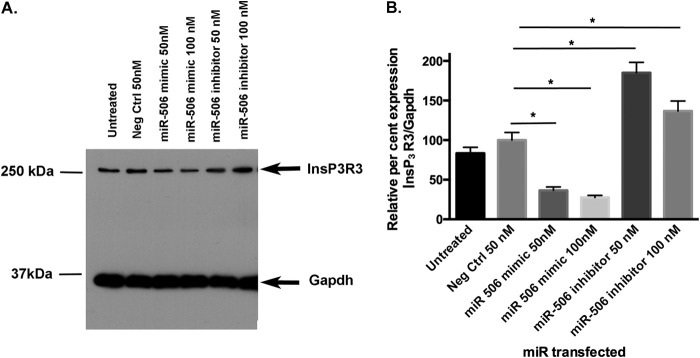
InsP3R3 protein levels are down-regulated in H69 cells by miR-506 mimics, whereas anti-miR-506 increases protein. A, Western blotting of protein extracts of H69 cells after transient overexpression of miR-506 mimic and inhibitor (50 and 100 nm) with antibodies against InsP3R3 and Gapdh (loading control) as described under “Experimental Procedures.” A representative blot is shown. B, quantitative analysis of InsP3R3 protein levels in H69 cells after miR-506-3p mimic and inhibitor overexpression (n = 3). Band intensities of scanned blots were analyzed by ImageJ, normalized to gapdh levels, and expressed as percent of untreated and negative controls.
Mutagenesis of Both Proximal and Distal Binding Sites Abolishes the Inhibitory Effect of miR-506
To verify specificity of the effect of miR-506 on the InsP3R3 3′-UTR, we next mutagenized the seed sequence of both the proximal and distal binding sites. Initial attempts at mutating the binding region in the context of the whole 3′-UTR failed in view of the high frequencies of the AT-rich sequences in the 3′-UTR. Hence the mutated constructs were generated containing isolated binding sites and flanking sequences (see Table 1 for primer sequences used). InsP3R3-Luc plasmids with either the wild-type mutated proximal (PW and PM) or wild-type mutated distal (DW and DM) sites were transfected into HEK293 together with miR-506 mimic or inhibitor sequences. As shown in Fig. 4, A and B, respectively, luciferase activities of the wild-type proximal and distal binding sites were significantly down-regulated by cotransfection with miR-506 mimic. The residual activity in the proximal site-mutated construct in the presence of miR-506 is arising from the activity of vector backbone. Mutagenesis of the seed sequence of both sites abrogated the inhibition indicating that both sites bound to miR-506. Fig. 4C shows a schematic of the miR-506 seed sequence and the alignment of the wild-type and mutant InsP3R3 3′-UTR miR-506 binding sites to pinpoint the mutated bases.
H69 Cells Stably Transfected with miR-506 Show Down-regulation of InsP3R3 mRNA and Protein Levels
We next generated H69 cholangiocyte clones stably expressing a control-miR (H69-Negative) or miR-506 (H69-positive) as described under “Experimental Procedures.” qPCR analysis of the miR-506 levels in the H69-positive clone (Fig. 5A) showed that they expressed miR-506 at 1483-fold higher levels than H69-negative cells (n = 3, p = 0.02, normalized to U6 snoRNA). qPCR analysis of the InsP3R3 mRNA in these cells showed that there was a 44% decrease in message levels (n = 6, p = 0.004) (Fig. 5B). To assess the InsP3R3 protein levels in miR-506 overexpressing stable H69 clones, Western blotting of proteins from Control-miR and miR-506 clones at two different passages (P9 and P15 for control-miR and P6 and P10 for miR-506 clones) were performed. The data in Fig. 5C show that the InsP3R3 protein levels in the miR-506 were at 21 and 15% of the control-miR clones. These data further substantiated our hypothesis that miR-506 is a predominant epigenetic regulator of InsP3R3 expression in cholangiocytes.
FIGURE 5.
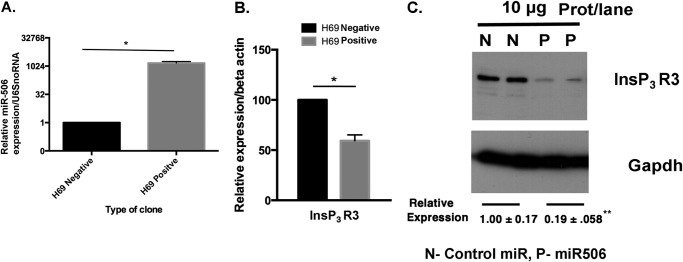
H69 cells stably expressing miR-506 show elevated miR-506 expression (A) and exhibit markedly decreased InsP3R3 mRNA (B) and protein (C) levels. H69 normal cholangiocyte cells stably expressing a negative control miR or miR-506 were generated as described under “Experimental Procedures.” A, mature miR-506 levels in H69-miR-506 cells and control-miR cells were analyzed by TaqMan qPCR and normalized to U6 snoRNA. B, InsP3R3 mRNA levels were analyzed in both cell types by qPCR using TaqMan assay and expressed relative to negative controls after normalization to β-actin. C, InsP3R3 protein levels were examined from protein extracts of negative control-miR and miR-506 H69 at two different passages (two N and P lanes). Gapdh protein levels were used as loading controls. The two lanes for the N (control-miR) and P (H69 miR-506 cells) correspond to passage numbers 9, 15 and 6, 10, respectively. Rel.Exp, relative expression compared with control-miR.
Histamine Receptor-mediated Ca2+ Signaling Is Decreased in miR-506 H69 Cells
Given that InsP3R3 is a major determinant of intracellular Ca2+ signaling (Ca2+i) in cholangiocytes, InsP3-dependent Ca2+ release was evaluated by fluo-4 fluorescence using confocal microscopy in miR-506 positive and H69 negative cells. Cells stimulated with 1 mm histamine displayed typical InsP3-dependent Ca2+ signals characterized by a rapid increase in fluo-4 fluorescence and slow reduction to reach baseline levels over time (data not shown). Quantification of the Ca2+ signaling parameters showed that both amplitude (245.7 ± 27.8%, n = 264 cells in H69-negative versus 134.1 ± 38.7%, n = 118 cells in H69-positive cells, p < 0.05, data not shown) and percentage of responding cells (Fig. 6A, 78.9 ± 8.8%, n = 6 coverslips in H69 negative versus 18.3 ± 9.1%, n = 5 coverslips in H69-positive cells, p < 0.01) were significantly reduced in cells overexpressing miR-506 compared with H69-negative cells. In silico analysis of the 3′-UTR of histamine receptor type 1 (HRH1) (the only isoform expressed in H69 cells) revealed a binding site for miR-506 (Fig. 6B). qPCR evaluation of HRH1 verified that miR-506 overexpressing cells displayed a 46% decrease in HRH1 mRNA compared with the control-miR clone (data not shown). We wanted to further verify that the downstream mediators of histamine receptors are not targets of miR-506. qPCR analysis of Gα subunits (Gαq, Gα11, and GαS) and phospholipase isoforms (PLCβ4 and PLCγ1) indicated no significant changes in expression of these components between the positive and negative clones (data not shown). These data suggested the absence of changes in expression of downstream components of the G-protein coupled receptor pathway. These results together indicate that miR-506 expression leads to a reduction in InsP3-dependent Ca2+ release in this normal cholangiocyte cell line.
FIGURE 6.
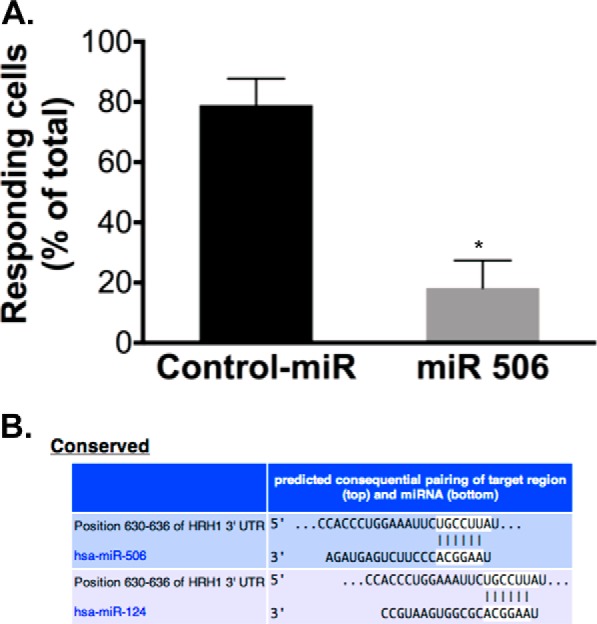
Ca2+ signaling in response to histamine stimulation is decreased in H69 miR-506 cells compared with control-miR cells (A) and HRH1 contains a binding site for miR-506 (B). Intracellular Ca2+ level in response to histamine (1 mm) stimulation was measured by Fluo-4 fluorescence using confocal microscopy. Responding cells in the control-miR clone and miR-506 clone are shown as percent of total. Control-miR, n = 6 coverslips, 264 cells, 3 independent experiments; miR-506, n = 5 coverslips, 118 cells, 3 independent experiments. B, TargetScan analysis of the 3′-UTR of HRH1 mRNA (the only isoform expressed in H69 cells based on qPCR analysis) shows the presence of a binding site for miR-506 at 630–636 bp (which is also recognized by miR-124). This site is highly conserved in HRH1 3′-UTR sequence across multiple species (not shown).
miR-506 Stably Overexpressing H69 Cells Exhibit a Fibrotic Gene Signature
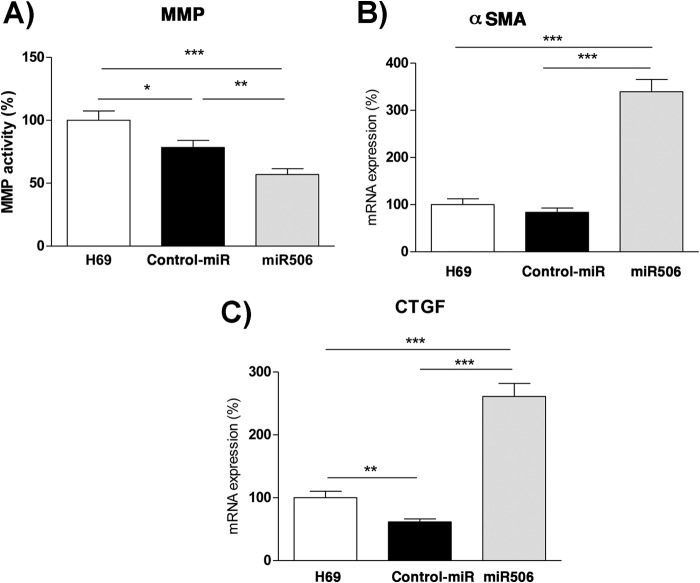
We next wanted to investigate if overexpression of miR-506 in H69 cells led to further genotypic/phenotypic changes suggestive of a fibrotic process. For this purpose, we assayed for 1) MMP enzymatic activity and 2) qPCR analysis (see Table 2 for primer sequences) of expression of (a) αSMA and (b) CTGF and the results are shown in Fig. 7. Fig. 7A shows that the MMP enzymatic activity in miR-506 cells was significantly decreased compared with untreated or control-miR expressing cells (78.4 ± 19.4 and 56.9 ± 16% in control-miR and miR-506, respectively, p < 0.001). There was a modest decrease in activity in control-miR cells attributable to nonspecific effects. Fig. 7B shows the expression data for αSMA wherein there was a 3.4-fold increase in αSMA message levels compared with untransfected H69 cells (1.00 ± 0.4, 0.83 ± 0.3, and 3.4 ± 0.9 in untransfected, control-miR and miR-506 cells, respectively, n = 12, p < 0.0.001). Finally, Fig. 7C shows that miR-506 overexpression led to a 2.6-fold increase in expression of CTGF (1.0 ± 0.3 in controls versus 2.6 ± 0.3 in miR-506 cells, n = 12, p < 0.001 compared with controls). The reason for the slight decrease in CTGF message in control-miR cells is currently unknown. Taken together, our data indicate that the gene/enzyme expression signature characteristics of fibrotic cells are observed in H69 cholangiocytes stably overexpressing miR-506. Thus it is consistent with the idea that overexpression of miR-506 might potentiate the induction of fibrosis in cholangiocytes.
TABLE 2.
qPCR primers used for fibrotic genes
| Gene name | Forward or reverse | Sequence 5′–3′ |
|---|---|---|
| GAPDH | Forward | CCAAGGTCATCCATGACAAC |
| Reverse | TGTCATACCAGGAAATGAGC | |
| αSMA | Forward | CGGGACTAAGACGGGAATCC |
| Reverse | GTCACCCACGTAGCTGTCTT | |
| CTGF | Forward | CAGCATGGACGTTCGTCTG |
| Reverse | AACCACGGTTTGGTCCTTGG |
FIGURE 7.
H69 cholangiocytes stably overexpressing miR-506 exhibit fibrotic gene signatures. A, MMP enzymatic activity was assayed in untransfected, control-miR, and miR-506 stably overexpressing H69 human cholangiocyte cells as previously described (n = 12) (24). Quantitative PCR analysis of expression of (B) αSMA and (C) CTGF in untransfected, control-miR and miR-506 stably expressing H69 cholangiocyte cells using the primers shown in Table 2 (n = 11–12 per gene).
miR-506 Expression Is Elevated in Cholangiocytes of PBC Patients
In an effort to understand the translational relevance of miR-506 expression in vivo, we conducted in situ hybridization analysis of miR-506 expression using a LNA-modified probe on human liver biopsies from 5 normal and PBC patients each. A representative image in Fig. 8A showing cyanine 5 fluorescence (red) as a marker of miR-506 expression was specifically increased in bile ducts (as seen by the green cytokeratin labeling) of the PBC patient (bottom right panel in Fig. 8A) but not in that of a normal control patient (top right panel in Fig. 8A). Under the same hybridization conditions, there was no labeling of the scrambled probe, whereas a U6 snoRNA probe showed labeling of all the cells in liver (data not shown). Quantitation of the cyanine 5 signal as pixel intensities/μm of bile duct in both groups as a scatter plot is shown in Fig. 8B. The data showed that the mean cyanine 5 signal pixel intensity (indicative of miR-506 expression) was 8.4-fold elevated in the PBC patients compared with the controls (19.05 versus 160.6 in controls versus PBC, p = 0.015, Mann-Whitney test). These results provide further evidence that increased expression of miR-506 has relevance in the context of the diseased cholangiocyte in vivo and thus is in part responsible for the decrease in InsP3R3 expression in PBC (21). These data are also consistent with an earlier report by one of us (20) of enhanced cholangiocyte miR-506 expression in a separate cohort of PBC patients although the staining was not quantitated.
FIGURE 8.
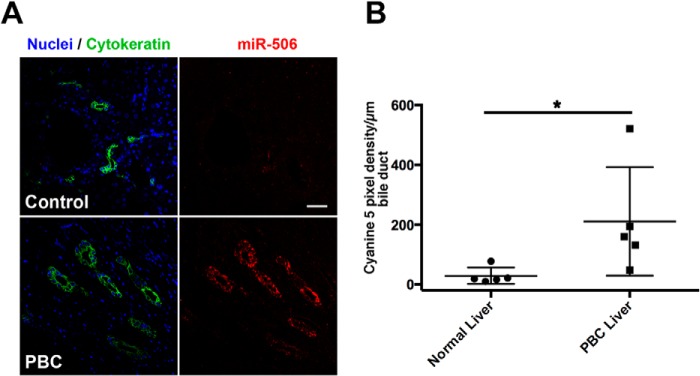
miR-506 expression is elevated in cholangiocytes from patients with PBC. A, in situ hybridization of miR-506 expression using LNA-modified digoxigenin-labeled miR-506 specific or scrambled probes (as controls) was examined using formalin-fixed paraffin-embedded biopsies from normal livers and those of PBC patients. miR-506 was detected using cyanine 5 (red)-labeled peroxidase substrate following incubation with peroxidase-conjugated anti-digoxigenin antibodies. Cholangiocytes (bile ducts) were labeled by immunofluorescent staining using anti-rabbit IgG Alexa-488 (green) with a pan-cytokeratin primary antibody. Nuclei (blue) were labeled with DAPI. Scale bar (top right panel), 50 μm. Hybridization with the scrambled probe failed to show any significant cyanine 5 staining, suggesting specific binding of the miR-506 probe (data not shown). B, panel shows quantitation of the cyanine 5 pixel intensity/μm of bile duct in 5 control and 5 PBC liver sections. p < 0.05 using Mann-Whitney test.
miR-506 Overexpression in IBDUs Leads to Decreased Fluid Secretion in Response to Forskolin Stimulation
Functional significance of the miR-506-induced reduction of InsP3R3 on the secretory activity of biliary cells was examined in rat primary IBDUs. Initially, we wanted to confirm whether miR-506 would inhibit rodent Insp3r3 mRNA as there is no annotation for miR-506 in rodents despite the fact that the miR-506 binding site is conserved across rodent Insp3r3 mRNAs (Fig. 1B). For this purpose, we used the mouse small/medium cholangiocyte cell line (generously provided by Dr. Gianfranco Alpini, Temple, TX). Transfection of this cell line with miR-506 mimic or inhibitor at 50 nm followed by Western blotting showed that Insp3r3 protein levels are decreased/increased, respectively, verifying that miR-506 is effective against rodent Insp3r3 mRNA (Fig. 9A). The preparation of IBDUs consist of primary rat bile duct cells in a short term culture, which form small cell aggregates enclosing a sealed lumen resembling a bile duct. Video microscopic measurements of changes in diameter of this space over time are used as a surrogate measurement of fluid secretion as previously shown (26). After isolation, cells were transfected with a control miRNA or different concentrations of miR-506 mimic and stimulated with 10 μm forskolin, which stimulates an autocrine signaling pathway that results in a cAMP and InsP3R3-mediated increase in fluid secretion (8). As shown in Fig. 9B, mean lumen diameter of non-transfected or control miRNA-transfected IBDUs gradually increased to approximately twice the size of baseline. Conversely, IBDUs transfected with 30, 40, or 50 nm miR-506 mimic showed a significant decrease in lumen expansion after forskolin treatment (55% decrease at 30 min, n = 30, 21 for untreated and negative control-treated miRs and n = 12, 21, and 12 for 50, 40 and 30 nm miR-treated IBDUs, p < 0.05). Because we found that treatment with 50 nm miR-506 resulted in slightly abnormal morphology of the IBDUs in culture, we conducted studies after transfection with 30 and 40 nm in addition to 50 nm. Negative control miR treatment at 50 nm did not result in changes in the morphology similar to that seen with miR-506. These results demonstrate that miR-506 overexpression impairs InsP3R3-mediated fluid secretion in cholangiocytes as assessed by fluid secretion in IBDUs.
FIGURE 9.
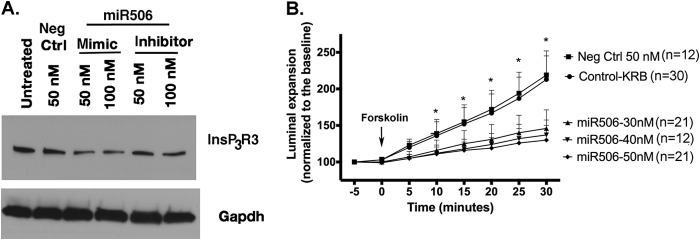
miR-506 overexpression decreases InsP3R3 protein in a mouse cholangiocyte cell line (A) and forskolin-stimulated fluid secretion in rat IBDUs is decreased by miR-506 mimic transfection but not negative control-miR transfection (B). A, transient overexpression of a miR-506 mimic or inhibitor (50 and 100 nm) into a mouse small/medium cholangiocyte cell line, MSC, led to down- and up-regulation of InsP3R3 protein levels, respectively. Shown is a representative blot of 3 experiments. These results further support data in B showing decreased forskolin-stimulated fluid secretion in rodent (rat) IBDUs by miR-506 mimics by down-regulation of InsP3R3. Gapdh protein was used as a loading control. B, rat IBDUs were isolated and plated on Matrigel-coated coverslips. Fluid secretion induced by stimulation with 10 μm forskolin was assayed by video microscopic optical planimetry. Luminal expansion as a percent of baseline value is plotted on the y-axis in untreated, 50 nm control miR, 30, 40, and 50 nm miR-506-transfected IBDUs over 30 min following forskolin stimulation.
DISCUSSION
The role of Ca2+i as a main regulator of secretory events in epithelia is well established. However, the mechanisms regulating the expression of major components of the Ca2+ signaling machinery both at the transcriptional and post-transcriptional levels are not well understood. Here the role of microRNAs in the regulation of InsP3R3 in bile duct cells (cholangiocytes) was investigated in an attempt to understand the mechanisms regulating the expression of intracellular Ca2+ release channels in epithelial cells. Increased levels of miR-506 were found to directly down-regulate InsP3R3 expression in a biliary cell line and as a consequence to inhibit fluid secretion by primary cholangiocytes (as assessed in IBDUs).
Epithelial cells appear to follow a general pattern of InsP3R localization/activation, which correlates with its role in regulating fluid secretion and exocytosis. Cholangiocytes, parotid, and pancreatic acinar cells express multiple InsP3Rs isoforms and in each of these cell types InsP3R3 is localized apically. InsP3R3 is the principal isoform in cholangiocytes, where it is responsible for triggering apical to basolateral Ca2+ waves. This polarized pattern of InsP3R expression is also observed in hepatocytes. In these cells, however, InsP3R1 and InsP3R2 are present instead, with the former localizing throughout the cytoplasm and the latter concentrated near the canalicular (apical) membrane where it initiates global Ca2+ waves (11). In this instance, apical Ca2+ signaling modulates secretion of biliary components into the canaliculi (5, 12). Our data suggest that miR-506 regulation of InsP3R3 might constitute a general mechanism controlling secretion in epithelial cells in which this isoform is predominantly expressed; additionally it raises the question of whether other miRNAs might be involved in fluid secretion processes via regulation of other InsP3Rs isoforms. In support of this hypothesis, InsP3R2 was recently shown to be down-regulated by miR-133a in cardiomyocytes during the hypertrophic response after ischemia/reperfusion injury (16). It remains to be determined whether this microRNA also might play a role in the pathogenesis of those types of cholestatic liver injury, which arise from hepatocyte damage such as is observed in bacterial infection or pregnancy.
MicroRNA expression changes in PBC using an miR microarray were first observed by the studies of Padgett et al. (27) who found miR-506 among the miRs up-regulated in this disease. Our studies using in situ hybridization with a miR-506-specific probe revealed that expression of miR-506 is specifically increased in cholangiocytes of PBC patients (Fig. 8). These data thus further support Padgett et al. (27) studies as well as complement the report by one of us (20) using a different cohort. We also provide evidence to suggest that overexpression of miR-506 induces in the H69 cells a fibrotic-like gene signature pattern. MMP activity and αSMA and CTGF expression are decreased and increased, respectively, consistent with a fibrotic pheotype. Examination of the 3-UTR of mRNAs for some of these genes did not reveal the existence of miR-506 binding site(s), suggesting an indirect effect of miR-506 on their altered expression. Induction of miR-506 in cholangiocytes in PBC might therefore potentiate fibrosis although further studies are needed. The effect of miR-506 on the expression of InsP3R3 is predicted to work synergistically with the down-regulation of anion exchanger 2 observed specifically in PBC patients to further decrease fluid secretion in cholangiocytes (20). However, our studies cannot exclude potential effects of miR-506 on additional targets related to electrolyte transport other than InsP3R3 and anion exchanger 2. Further studies need to be conducted to examine whether this miR-506/InsP3R3 axis is important in the pathogenesis of other cholestatic disorders such as biliary atresia and common bile duct obstruction as well (21). It is worth noting that the miR-506 gene is localized to chromosome X and it is well established that the incidence of PBC is higher in females than males (28). Fig. 10 shows a schematic of the potential mechanism for the decreased InsP3R3 expression and fluid secretion in cholestatic liver diseases (21, 8) in cholangiocytes due to miR-506-mediated down-regulation of InsP3R3. Recent studies employing a biliary atresia mouse model and integrative genomics have provided some hints regarding the role of miRNAs in this biliary disease. miR-30b/c, miR-195, miR-200a, miR-320, miR-365, and miR-133a/b were found to be among the principal down-regulated miRNAs (29). Additionally, Glaser et al. (30) showed that secretin regulation of VEGFA and NGF (mediating cholangiocyte proliferation in bile duct ligated mice) occurred through negative regulation of miR-125b and miR-let7a. Although our results indicate that none of these miRNAs would directly regulate InsP3R3, based on the TargetScan algorithm, it is still possible that they regulate InsP3R3 indirectly or the algorithms alone currently cannot precisely predict all the miR targets. This would be analogous to the observation in cardiomyocytes during hypertrophy that InsP3R2 is down-regulated by miR-133a albeit the fact that the common prediction algorithms failed to detect a binding site for this miR in the 3′-UTR sequence of the InsP3R2 (16).
FIGURE 10.
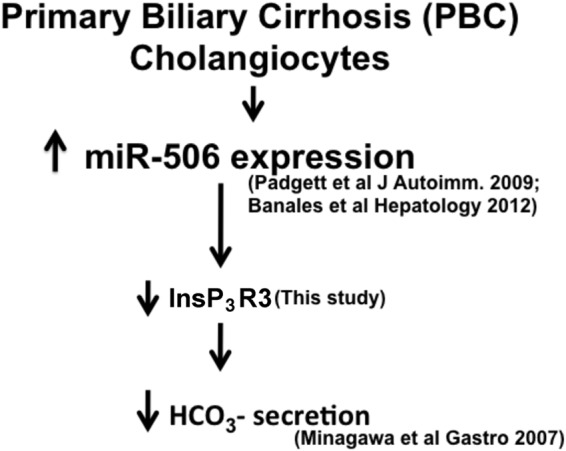
Proposed mechanism for the role of miR-506 in decreased bicarbonate secretion in PBC cholangiocytes via its effect on InsP3R3 expression. miR-506 expression was up-regulated in a PBC liver microRNA profiling (27) and specifically in cholangiocytes (20). This increased expression of miR-506 results in down-regulation of InsP3R3 as shown in this study. This effect thus provides a potential mechanism for the decreased cholangiocyte HCO3− secretion that results from InsP3R3 silencing (8).
In addition to its role in modulating InsP3R3-mediated fluid secretion, one can also speculate a role for miR-506 in the regulation of InsP3R3 as it relates to cellular proliferation. miR-506 has been shown to be beneficial in tumor progression and metastasis in ovarian, lung, and breast cancers by inhibiting epithelial-to-mesenchymal transition (31–33) and higher InsP3R3 expression in colon cancers correlates with poorer prognosis (34). Moreover, histamine-driven cholangiocyte proliferation depends on the InsP3-Ca2+ signaling pathway (35) and we observed a slower growth rate of H69 cells that stably express higher levels of miR-506.4
In summary, this work reveals a new mode of regulation of InsP3R3 expression by miR-506. This regulatory mechanism may be important for regulation of fluid secretion in cholangiocytes. It also identifies InsP3R3 as a potential target for molecular intervention in cholestatic liver diseases.
Acknowledgments
We thank Dr. Douglas Jefferson, Tufts University School of Medicine, Boston, MA, for providing H69 cell lines, Dr. Gianfranco Alpini, Scott & White Digestive Diseases Research Center, Temple, TX, for generously providing the mouse small/medium cholangiocyte cell line, and Kathy Harry and Albert Mennone, Liver Center, Yale University School of Medicine, for help with the isolation of IBDUs and with the confocal microscopy.
This work was supported, in whole or in part, by National Institutes of Health Grants DK045710, DK057751, DK61747, and DK034989 (to M. H. N.), Spanish Ministries of Economy and Competitiveness Grant FIS PI12/00380, a grant from the “Instituto de Salud Carlos III” (Ciberehd), Spain (to J. M. B.), and Department of Industry of the Basque Country Grant SAIO12-PE12BN002 (to J. M. B.).
M. Ananthanarayanan, J. M. Banales, and M. H. Nathanson, unpublished data.
- InsP3R3
- type III inositol trisphosphate receptor
- αSMA
- α-smooth muscle actin
- CTGF
- connective tissue growth factor
- HRH1
- histamine receptor type 1
- IBDU
- isolated bile duct units
- MMP
- matrix metalloproteinase
- PBC
- primary biliary cirrhosis
- miRNA
- microRNA
- qPCR
- quantitative PCR.
REFERENCES
- 1. Rodrigues M. A., Gomes D. A., Leite M. F., Grant W., Zhang L., Lam W., Cheng Y. C., Bennett A. M., Nathanson M. H. (2007) Nucleoplasmic calcium is required for cell proliferation. J. Biol. Chem. 282, 17061–17068 [DOI] [PMC free article] [PubMed] [Google Scholar]
- 2. Pusl T., Wu J. J., Zimmerman T. L., Zhang L., Ehrlich B. E., Berchtold M. W., Hoek J. B., Karpen S. J., Nathanson M. H., Bennett A. M. (2002) Epidermal growth factor-mediated activation of the ETS domain transcription factor Elk-1 requires nuclear calcium. J. Biol. Chem. 277, 27517–27527 [DOI] [PubMed] [Google Scholar]
- 3. Bading H. (2013) Nuclear calcium signalling in the regulation of brain function. Nat. Rev. Neurosci. 14, 593–608 [DOI] [PubMed] [Google Scholar]
- 4. Ozcan L., Wong C. C., Li G., Xu T., Pajvani U., Park S. K., Wronska A., Chen B. X., Marks A. R., Fukamizu A., Backs J., Singer H. A., Yates J. R., 3rd, Accili D., Tabas I. (2012) Calcium signaling through CaMKII regulates hepatic glucose production in fasting and obesity. Cell Metab. 15, 739–751 [DOI] [PMC free article] [PubMed] [Google Scholar]
- 5. Cruz L. N., Guerra M. T., Kruglov E., Mennone A., Garcia C. R., Chen J., Nathanson M. H. (2010) Regulation of multidrug resistance-associated protein 2 by calcium signaling in mouse liver. Hepatology 52, 327–337 [DOI] [PMC free article] [PubMed] [Google Scholar]
- 6. Ito K., Miyashita Y., Kasai H. (1997) Micromolar and submicromolar Ca2+ spikes regulating distinct cellular functions in pancreatic acinar cells. EMBO J. 16, 242–251 [DOI] [PMC free article] [PubMed] [Google Scholar]
- 7. Giovannucci D. R., Bruce J. I., Straub S. V., Arreola J., Sneyd J., Shuttleworth T. J., Yule D. I. (2002) Cytosolic Ca2+ and Ca2+-activated Cl− current dynamics: insights from two functionally distinct mouse exocrine cells. J. Physiol. 540, 469–484 [DOI] [PMC free article] [PubMed] [Google Scholar]
- 8. Minagawa N., Nagata J., Shibao K., Masyuk A. I., Gomes D. A., Rodrigues M. A., Lesage G., Akiba Y., Kaunitz J. D., Ehrlich B. E., Larusso N. F., Nathanson M. H. (2007) Cyclic AMP regulates bicarbonate secretion in cholangiocytes through release of ATP into bile. Gastroenterology 133, 1592–1602 [DOI] [PMC free article] [PubMed] [Google Scholar]
- 9. Berridge M. J., Bootman M. D., Roderick H. L. (2003) Calcium signalling: dynamics, homeostasis and remodelling. Nat. Rev. Mol. Cell Biol. 4, 517–529 [DOI] [PubMed] [Google Scholar]
- 10. Hirata K., Nathanson M. H. (2001) Bile duct epithelia regulate biliary bicarbonate excretion in normal rat liver. Gastroenterology 121, 396–406 [DOI] [PubMed] [Google Scholar]
- 11. Hirata K., Pusl T., O'Neill A. F., Dranoff J. A., Nathanson M. H. (2002) The type II inositol 1,4,5-trisphosphate receptor can trigger Ca2+ waves in rat hepatocytes. Gastroenterology 122, 1088–1100 [DOI] [PubMed] [Google Scholar]
- 12. Kruglov E. A., Gautam S., Guerra M. T., Nathanson M. H. (2011) Type 2 inositol 1,4,5-trisphosphate receptor modulates bile salt export pump activity in rat hepatocytes. Hepatology 54, 1790–1799 [DOI] [PMC free article] [PubMed] [Google Scholar]
- 13. Futatsugi A., Nakamura T., Yamada M. K., Ebisui E., Nakamura K., Uchida K., Kitaguchi T., Takahashi-Iwanaga H., Noda T., Aruga J., Mikoshiba K. (2005) IP3 receptor types 2 and 3 mediate exocrine secretion underlying energy metabolism. Science 309, 2232–2234 [DOI] [PubMed] [Google Scholar]
- 14. Choe C. U., Ehrlich B. E. (2006) The inositol 1,4,5-trisphosphate receptor (IP3R) and its regulators: sometimes good and sometimes bad teamwork. Sci. STKE 2006, re15. [DOI] [PubMed] [Google Scholar]
- 15. Park K. M., Yule D. I., Bowers W. J. (2009) Tumor necrosis factor-α-mediated regulation of the inositol 1,4,5-trisphosphate receptor promoter. J. Biol. Chem. 284, 27557–27566 [DOI] [PMC free article] [PubMed] [Google Scholar]
- 16. Drawnel F. M., Wachten D., Molkentin J. D., Maillet M., Aronsen J. M., Swift F., Sjaastad I., Liu N., Catalucci D., Mikoshiba K., Hisatsune C., Okkenhaug H., Andrews S. R., Bootman M. D., Roderick H. L. (2012) Mutual antagonism between IP3RII and miRNA-133a regulates calcium signals and cardiac hypertrophy. J. Cell Biol. 199, 783–798 [DOI] [PMC free article] [PubMed] [Google Scholar]
- 17. Szabo G., Bala S. (2013) MicroRNAs in liver disease. Nat. Rev. Gastroenterol. Hepatol. 10, 542–552 [DOI] [PMC free article] [PubMed] [Google Scholar]
- 18. Marin J. J., Bujanda L., Banales J. M. (2014) MicroRNAs and cholestatic liver diseases. Curr. Opin. Gastroenterol. 30, 303–309 [DOI] [PubMed] [Google Scholar]
- 19. Allen R. M., Marquart T. J., Albert C. J., Suchy F. J., Wang D. Q., Ananthanarayanan M., Ford D. A., Baldán A. (2012) miR-33 controls the expression of biliary transporters, and mediates statin- and diet-induced hepatotoxicity. EMBO Mol. Med. 4, 882–895 [DOI] [PMC free article] [PubMed] [Google Scholar]
- 20. Banales J. M., Sáez E., Uriz M., Sarvide S., Urribarri A. D., Splinter P., Tietz Bogert P. S., Bujanda L., Prieto J., Medina J. F., LaRusso N. F. (2012) Up-regulation of microRNA 506 leads to decreased Cl−/HCO3− anion exchanger 2 expression in biliary epithelium of patients with primary biliary cirrhosis. Hepatology 56, 687–697 [DOI] [PMC free article] [PubMed] [Google Scholar]
- 21. Shibao K., Hirata K., Robert M. E., Nathanson M. H. (2003) Loss of inositol 1,4,5-trisphosphate receptors from bile duct epithelia is a common event in cholestasis. Gastroenterology 125, 1175–1187 [DOI] [PMC free article] [PubMed] [Google Scholar]
- 22. Cazanave S. C., Mott J. L., Elmi N. A., Bronk S. F., Masuoka H. C., Charlton M. R., Gores G. J. (2011) A role for miR-296 in the regulation of lipoapoptosis by targeting PUMA. J. Lipid Res. 52, 1517–1525 [DOI] [PMC free article] [PubMed] [Google Scholar]
- 23. Nathanson M. H., Burgstahler A. D., Mennone A., Dranoff J. A., Rios-Velez L. (1998) Stimulation of bile duct epithelial secretion by glybenclamide in normal and cholestatic rat liver. J. Clin. Invest. 101, 2665–2676 [DOI] [PMC free article] [PubMed] [Google Scholar]
- 24. Urribarri A. D., Munoz-Garrido P., Perugorria M. J., Erice O., Merino-Azpitarte M., Arbelaiz A., Lozano E., Hijona E., Jiménez-Agüero R., Fernandez-Barrena M. G., Jimeno J. P., Marzioni M., Marin J. J., Masyuk T. V., LaRusso N. F., Prieto J., Bujanda L., Banales J. M. (2014) Inhibition of metalloprotease hyperactivity in cystic cholangiocytes halts the development of polycystic liver diseases. Gut 63, 1658–1667 [DOI] [PMC free article] [PubMed] [Google Scholar]
- 25. Hanna J. A., Hahn L., Agarwal S., Rimm D. L. (2012) In situ measurement of miR-205 in malignant melanoma tissue supports its role as a tumor suppressor microRNA. Lab. Investig. 92, 1390–1397 [DOI] [PMC free article] [PubMed] [Google Scholar]
- 26. Mennone A., Alvaro D., Cho W., Boyer J. L. (1995) Isolation of small polarized bile duct units. Proc. Natl. Acad. Sci. U.S.A. 92, 6527–6531 [DOI] [PMC free article] [PubMed] [Google Scholar]
- 27. Padgett K. A., Lan R. Y., Leung P. C., Lleo A., Dawson K., Pfeiff J., Mao T. K., Coppel R. L., Ansari A. A., Gershwin M. E. (2009) Primary biliary cirrhosis is associated with altered hepatic microRNA expression. J. Autoimmun. 32, 246–253 [DOI] [PMC free article] [PubMed] [Google Scholar]
- 28. Hirschfield G. M., Gershwin M. E. (2013) The immunobiology and pathophysiology of primary biliary cirrhosis. Annu. Rev. Pathol. 8, 303–330 [DOI] [PubMed] [Google Scholar]
- 29. Bessho K., Shanmukhappa K., Sheridan R., Shivakumar P., Mourya R., Walters S., Kaimal V., Dilbone E., Jegga A. G., Bezerra J. A. (2013) Integrative genomics identifies candidate microRNAs for pathogenesis of experimental biliary atresia. BMC Syst. Biol. 7, 104. [DOI] [PMC free article] [PubMed] [Google Scholar]
- 30. Glaser S., Meng F., Han Y., Onori P., Chow B. K., Francis H., Venter J., McDaniel K., Marzioni M., Invernizzi P., Ueno Y., Lai J. M., Huang L., Standeford H., Alvaro D., Gaudio E., Franchitto A., Alpini G. (2014) Secretin stimulates biliary cell proliferation by regulating expression of microRNA 125b and microRNA let7a in mice. Gastroenterology 146, 1795–808.e12 [DOI] [PMC free article] [PubMed] [Google Scholar]
- 31. Yang D., Sun Y., Hu L., Zheng H., Ji P., Pecot C. V., Zhao Y., Reynolds S., Cheng H., Rupaimoole R., Cogdell D., Nykter M., Broaddus R., Rodriguez-Aguayo C., Lopez-Berestein G., Liu J., Shmulevich I., Sood A. K., Chen K., Zhang W. (2013) Integrated analyses identify a master microRNA regulatory network for the mesenchymal subtype in serous ovarian cancer. Cancer Cell 23, 186–199 [DOI] [PMC free article] [PubMed] [Google Scholar]
- 32. Yin M., Ren X., Zhang X., Luo Y., Wang G., Huang K., Feng S., Bao X., Huang K., He X., Liang P., Wang Z., Tang H., He J., Zhang B. (2014) Selective killing of lung cancer cells by miRNA-506 molecule through inhibiting NF-κB p65 to evoke reactive oxygen species generation and p53 activation. Oncogene 10.1038/onc.2013.597 [DOI] [PubMed] [Google Scholar]
- 33. Arora H., Qureshi R., Park W. Y. (2013) miR-506 regulates epithelial mesenchymal transition in breast cancer cell lines. PloS One 8, e64273. [DOI] [PMC free article] [PubMed] [Google Scholar]
- 34. Shibao K., Fiedler M. J., Nagata J., Minagawa N., Hirata K., Nakayama Y., Iwakiri Y., Nathanson M. H., Yamaguchi K. (2010) The type III inositol 1,4,5-trisphosphate receptor is associated with aggressiveness of colorectal carcinoma. Cell Calcium 48, 315–323 [DOI] [PMC free article] [PubMed] [Google Scholar]
- 35. Francis H., Glaser S., Demorrow S., Gaudio E., Ueno Y., Venter J., Dostal D., Onori P., Franchitto A., Marzioni M., Vaculin S., Vaculin B., Katki K., Stutes M., Savage J., Alpini G. (2008) Small mouse cholangiocytes proliferate in response to H1 histamine receptor stimulation by activation of the IP3/CaMKI/CREB pathway. Am. J. Physiol. Cell Physiol. 295, C499–C513 [DOI] [PMC free article] [PubMed] [Google Scholar]


