

Key Points
Mitochondrial dysfunction in aged mtDNA-mutator mice is associated with activation of mechanistic target of rapamycin and suppression of autophagy in erythroid cells.
Autophagy maintains mitochondrial function in erythroid progenitors of mtDNA-mutator mice, and disrupting it accelerates onset of anemia.
Abstract
Somatic mitochondrial DNA (mtDNA) mutations contribute to the pathogenesis of age-related disorders, including myelodysplastic syndromes (MDS). The accumulation of mitochondria harboring mtDNA mutations in patients with these disorders suggests a failure of normal mitochondrial quality-control systems. The mtDNA-mutator mice acquire somatic mtDNA mutations via a targeted defect in the proofreading function of the mtDNA polymerase, PolgA, and develop macrocytic anemia similar to that of patients with MDS. We observed an unexpected defect in clearance of dysfunctional mitochondria at specific stages during erythroid maturation in hematopoietic cells from aged mtDNA-mutator mice. Mechanistically, aberrant activation of mechanistic target of rapamycin signaling and phosphorylation of uncoordinated 51-like kinase (ULK) 1 in mtDNA-mutator mice resulted in proteasome-mediated degradation of ULK1 and inhibition of autophagy in erythroid cells. To directly evaluate the consequence of inhibiting autophagy on mitochondrial function in erythroid cells harboring mtDNA mutations in vivo, we deleted Atg7 from erythroid progenitors of wild-type and mtDNA-mutator mice. Genetic disruption of autophagy did not cause anemia in wild-type mice but accelerated the decline in mitochondrial respiration and development of macrocytic anemia in mtDNA-mutator mice. These findings highlight a pathological feedback loop that explains how dysfunctional mitochondria can escape autophagy-mediated degradation and propagate in cells predisposed to somatic mtDNA mutations, leading to disease.
Introduction
Myelodysplastic syndromes (MDS) encompass a group of clonal stem cell disorders characterized by ineffective hematopoiesis with dysplastic changes that lead to cytopenias (often including a macrocytic anemia) and increased risk of transformation to AML. Although recent studies have identified several recurrent mutations in patients with MDS,1 these mutations alone do not recapitulate the complete MDS phenotype in mice,2 suggesting that additional pathways are dysregulated in patients with MDS. Several lines of evidence, including the similarity between the progressive macrocytic anemia that develops in mitochondrial DNA (mtDNA)–mutator mice and that observed in patients with MDS, suggest that mitochondrial dysfunction contributes to the pathogenesis of MDS.3-16
The mtDNA-mutator (PolgAmt/mt) mice are homozygous for a D257A mutation that inactivates the proofreading function of the nuclear DNA–encoded mitochondrial polymerase, PolgA.17,18 The proofreading defect in PolgAmt/mt mice results in mtDNA mutation frequencies that are ∼10-fold higher than normal in multiple tissues and a progressive decline in respiratory function of mtDNA-encoded complexes that is evident by 3 months of age.17,18 In addition to developing macrocytic anemia and erythroid dysplasia similar to that observed in patients with MDS,4 mtDNA-mutator mice also show an accelerated onset of other ageing-associated disorders, including cardiomyopathy, diabetes, alopecia, and osteoporosis.17,18 The spectrum of diseases that develops in mtDNA-mutator mice makes these animals a useful model for investigating the pathophysiology of diseases associated with an increased burden of somatic mtDNA mutations.
Mitochondrial quality control involves cycles of fusion, fission, and autophagy-mediated degradation of depolarized fragments of the organelle.19 Autophagy is a catabolic process through which damaged or superfluous organelles and long-lived or misfolded proteins are sequestered within double membrane–bound vesicles known as autophagosomes, delivered to lysosomes, and therein degraded.20 This process helps to replenish pools of free amino acids and other metabolites recycled from breakdown products and is essential for survival under starvation conditions.21 The molecular basis of autophagy has been well-characterized using autophagy-defective mutant yeast strains and is carried out by more than 30 autophagy-related (ATG) proteins that are conserved from yeast to mammals.22 Canonical autophagy relies on 2 ubiquitin-like conjugation pathways, which are involved in conjugating ATG8/microtubule-associated protein 1 light chain 3 (LC3) to phosphatidylethanolamine, and ATG5 to ATG12. Both pathways require the E1-like activity of ATG7.20 The serine-threonine kinase ATG1/uncoordinated 51-like kinase (ULK) 1 facilitates conventional autophagy23 but also serves as an essential trigger for an alternative (ATG5/ATG7-independent) form of autophagy that promotes clearance of mitochondria during terminal stages of erythroid maturation.21,24,25
Disrupting autophagy in mice leads to the accumulation of abnormal mitochondria in many cell types.3 Interestingly, conditional disruption of autophagy in murine hematopoietic stem cells (HSCs) leads to the accumulation of abnormal mitochondria in stem/progenitor cells and the development of an MDS-like phenotype characterized by bone marrow failure and an atypical myelomonocytic infiltrate in peripheral organs.26 Autophagy is clearly involved in eliminating depolarized mitochondria27 and mitochondria with mtDNA mutations from cells maintained in culture28,29; yet, the role of autophagy in eliminating mitochondria with mtDNA mutations in vivo has not been established. Moreover, the propagation of mitochondria harboring mtDNA mutations in patients with primary or age-related mitochondrial diseases (eg, MDS) suggests that mitochondria harboring mtDNA mutations may not be efficiently eliminated in vivo. Therefore, we exploited the progressive accumulation of mtDNA mutations in mtDNA-mutator mice to evaluate the relationship between autophagy and mtDNA mutation–associated mitochondrial dysfunction in erythroid cells in vivo.
Materials and methods
Mice
PolgAD257A heterozygous mice (PolgAwt/mt)17 were interbred to generate PolgAmt/mt and wild-type littermate siblings as controls. Eporwt/GFPCreAtg7flox/floxPolgAmt/mt mice and littermate controls were created by interbreeding PolgAwt/mt, Eporwt/GFPCre (generous gift from Dr Ursula Klingmüller, German Cancer Research Center),30 and Atg7flox/flox mice (generous gift from Dr Masaaki Komatsu, Tokyo Metropolitan Institute of Medical Science).31 All animal experiments were approved by and performed in accordance with guidelines provided by the Institutional Animal Care and Use Committee at St. Jude Children’s Research Hospital. Additional details regarding mouse tissue collection and other experimental procedures are provided in the supplemental Materials and methods (see the Blood Web site).
Results
Defective clearance of mitochondria and ribosomes during the terminal stages of erythroid maturation in mtDNA-mutator mice
Committed erythroid progenitors typically undergo several rounds of mitotic cell division as the cells progress through several morpholgically and immunophenotypically distinct stages of differentiation prior to enucleation and subsequent loss of remaining organelles (supplemental Figure 1A).32 During our characterization of erythropoiesis in mtDNA-mutator (PolgAmt/mt) mice, we observed an age-dependent accumulation of cells at the pre–colony forming unit erythroid (CFUE) stage in bone marrow of PolgAmt/mt mice (supplemental Figure 1B-F), consistent with previously published results.33 The immunophenotypic shift in early erythroid progenitors was recapitulated in phlebotomized34 PolgAmt/mt mice (supplemental Figure 1G). Although suggesting a block in differentiation, the relationship between the accumulation of cells at the PreCFUE stage and the macrocytic anemia that develops in aged mtDNA-mutator mice remains unclear. To address this gap in knowledge, we characterized the progression of erythroid cells through subsequent stages of differentiation in mtDNA-mutator mice.
Despite the apparent block in differentiation at the PreCFUE stage, we did not observe any significant differences between wild-type and mtDNA-mutator mice in the number of cells expressing the erythroid-specific cell-surface marker Ter119 within the bone marrow (supplemental Figure 1H-I). Nor did we detect any significant changes in the distribution of Ter119+ cells at different stages of maturation based on CD71 expression and forward scatter (supplemental Figure 1J). There was, however, a progressive, age-dependent increase in the number of circulating reticulocytes and of atypical red blood cells (RBCs) that had lost surface CD71 expression but retained polarized mitochondria that took up the fluorescent dye tetramethylrhodamine (TMRM) (Figure 1A-B). This abnormal pattern of reticulocyte maturation in the PB was not observed in wild-type animals (Figure 1A-B).
Figure 1.

mtDNA-mutator mice show a defect in the clearance of mitochondria and ribosomes during terminal stages of erythroid maturation. (A-D) Peripheral blood (PB) RBCs were gated based on characteristic forward and side scatter properties and analyzed by fluorescence-activated cell sorting (FACS) for surface CD71 expression and TMRM staining. (A) Representative FACS plots showing the distribution of cells in the R1 and R2 gates from 12-month-old mice. The R2 gate consists of reticulocytes that are positive for CD71 and contain mitochondria. The R1 gate contains an abnormal population of cells that have lost surface CD71 expression but retain mitochondria (red arrow). (B) Percentage of PB RBCs (mean ± standard error of the mean [SEM]) within the R1 and R2 gates from mice at different ages. n ≥ 4 mice per genotype per time point. *P < .001 (1-way analysis of variance followed by Holm-Sidak post hoc analysis). (C) Percentage of PB RBCs (mean ± SEM) within the R1 and R2 gates from mice before (day “0”) and on the indicated days after completion of the 5-day phlebotomy protocol (“postphlebotomy”) used to induce stress erythropoiesis. n = 3 mice per genotype. (D) Representative FACS plots showing the distribution of cells in the R1 and R2 gates from mice 7 days postphlebotomy. The R1 gate contains an abnormal population of cells that have lost surface CD71 expression but retain mitochondria (red arrow). (E) Representative images from fluorescence and differential interference contrast microscopy of PB RBCs collected 5 days postphlebotomy and stained with MG and TMRM. Scale bar represents 10 μM. (F) Representative FACS plots showing the profile of CD71 expression and MitoTracker Red staining in PB RBCs collected 7 days postphlebotomy. Cells were gated based on CD71 expression and analyzed for thiazole orange staining. The retention of RNA and ribosomes in CD71low/med cells from mtDNA-mutator mice is highlighted by the red arrows.
To minimize the differences in the reticulocyte-maturation profile that may be caused by the increased level of extramedullary stress erythropoiesis in PolgAmt/mt mice at steady state,4 PolgAmt/mt and wild-type littermates were subjected to a 5-day phlebotomy protocol.34 FACS analyses performed on PB samples collected on days 1, 3, 5, and 7 postphlebotomy allowed us to monitor the maturation profile of PB erythrocytes in vivo and highlighted a profound defect in mitochondrial clearance in PolgAmt/mt animals (Figure 1C-D). Confocal microscopy of PB collected 5 days postphlebotomy and stained with MitoTracker Green (MG) and TMRM confirmed that polarized mitochondria were retained in the RBCs of PolgAmt/mt animals (Figure 1E). Light microscopy of sorted circulating erythroid populations and FACS analyses of Hoechst-stained PB collected 5 days postphlebotomy confirmed that the erythroid cells that retained mitochondria were enucleated and contained no appreciable amounts of DNA (supplemental Figure 2A-E). The retention of mitochondria decreases the life span of RBCs35; therefore, this defect may contribute to the age-dependent anemia in mtDNA-mutator mice.
We next sought to determine whether the defect in clearance was specific for mitochondria or also affected ribosomes. Thiazole orange is commonly used to distinguish reticulocytes from mature RBCs because it stains the residual ribosome-associated RNA in reticulocytes and can, therefore, serve as a surrogate marker of ribosomal content in cells lacking nuclei.36 Thiazole orange staining was examined in PB erythroid cells staged based on CD71 expression at various time points after phlebotomy. The increased thiazole orange staining in RBCs of phlebotomized PolgAmt/mt animals (Figure 1F) was consistent with defective clearance of ribosomes.
Erythroid cells from mtDNA-mutator mice harbor dysfunctional mitochondria with mtDNA mutations
Because the mitochondria in the RBCs from mtDNA-mutator mice retained their membrane potential, we wondered if the Ter119+ cells undergoing terminal differentiation in mtDNA-mutator mice may have selectively cleared mitochondria with mtDNA mutations. Therefore, we isolated Ter119+ erythroid cells from phlebotomized wild-type and mtDNA-mutator mice and performed next-generation sequencing on a polymerase chain reaction (PCR)–amplified fragment of mtDNA to estimate mtDNA mutation frequency.33 Consistent with the proofreading defect in PolgA, Ter119+ erythroid cells isolated from bone marrow or spleens of phlebotomized mtDNA-mutator mice showed a higher frequency of mtDNA mutations than did those of wild-type mice (Figure 2A).
Figure 2.
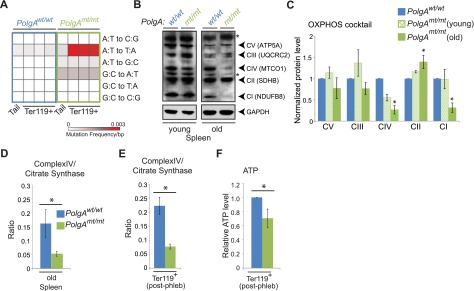
mtDNA mutation–associated decline in mitochondrial respiration in erythroid cells from mtDNA-mutator mice. (A) DNA isolated from tails (at weaning) and Ter119+ erythroid cells from bone marrow (total Ter119+) and spleens (Ter119+ populations A and B) of 8-month-old phlebotomized mtDNA-mutator mice and wild-type littermate controls was assayed via PCR with primers directed against a portion of mtDNA. Calculated mutation frequencies from a representative experiment (tail and Ter119+ populations from littermates) are shown in the heat map. (B-C) Representative immunoblots and graphs (mean ± SEM) showing age-dependent changes in steady-state levels of labile components of the mitochondrial electron transport complexes (CI-CV). n = 2 mice per genotype (young) or 3 mice per genotype (old). Asterisk in panel B denotes nonspecific band. (D) Total spleen from old animals was used for analysis of CS and CIV. Graph (mean ± standard deviation) shows ratio of CIV to CS activities. n = 2 mice per genotype. (E) Ter119+ erythroid cells were positively selected from spleens of phlebotomized mice by using magnetic beads and used for analysis of CS and CIV activities. Graph (mean ± SEM) shows ratio of CIV to CS activities. n = 4 mice per genotype. (F) Ter119+ erythroid cells were positively selected from bone marrow of phlebotomized mice by using magnetic beads and used for ATP analysis. Values were normalized to that of Ter119+ population “A” in wild-type mice for each experiment. n = 5 mice per genotype.
Increased mtDNA mutation frequency can lead to inefficient production of the mtDNA-encoded oxidative phosphorylation (OXPHOS) components, with improper assembly and destabilization of 1 or more of the 4 OXPHOS complexes containing mtDNA-encoded subunits. Consistent with the accumulation of mtDNA mutations in the mtDNA-mutator mice, we observed an age-dependent decrease in steady-state levels of labile components of complex I (CI) and complex IV (CIV) in extracts from spleens of mtDNA-mutator mice (Figure 2B-C). The decline in steady-state levels of CIV components in spleens from old mtDNA-mutator mice was accompanied by a significant reduction in the ratio of CIV activity to that of citrate synthase (CS; a reliable indicator of intact mitochondria37) (Figure 2D). CIV is particularly sensitive to mutations in mtDNA because its 3 large catalytic subunits are encoded by mtDNA. We also detected lower CIV activity levels in Ter119+ cells isolated from phlebotomized PolgAmt/mt mice than in those from wild-type mice 0 (Figure 2E), with an accompanying reduction in cellular adenosine triphosphate (ATP) levels (Figure 2F). These findings indicated that the progressive defect in reticulocyte maturation in mtDNA-mutator mice was associated with accumulation of mtDNA mutations and dysfunctional, but polarized, mitochondria in Ter119+ erythroid cells. We speculate that the F1-ATPase and adenine nucleotide translocator may contribute to maintenance of mitochondrial membrane potential in Ter119+ erythroid cells harboring mtDNA mutations, as they do in ρ° cells depleted of mtDNA.38
Increased expression of genes involved in oxidative phosphorylation and translation in PolgAmt/mt erythroid cells with mitochondrial dysfunction
To gain more insight into the molecular basis of the defect in clearance of mitochondria and ribosomes from RBCs in mtDNA-mutator mice, we compared gene-expression profiles in Ter119+ erythroid cells from the bone marrow of phlebotomized wild-type (n = 2) and PolgAmt/mt (n = 3) littermates. A 1.5-fold threshold was used to identify differentially expressed genes in wild-type and PolgAmt/mt cells (supplemental Table 1). The gene set was submitted for Ingenuity Pathway Analysis (supplemental Tables 2 and 3), gene ontology analysis (supplemental Table 4), and gene set–enrichment analysis (supplemental Table 5).39 Erythroid progenitors from mtDNA-mutator mice showed significant upregulation of gene sets related to ribosomal proteins, translation, and OXPHOS, as well as gene sets comprising v-myc avian myelocytomatosis viral oncogene homolog (Myc) targets40 and RNAs that are translationally regulated by serum and rapamycin (ie, those regulated by mechanistic target of rapamycin [mTOR]41) (Figure 3A-C). Myc promotes oxidative phosphorylation by regulating transcription of nuclear DNA–encoded genes involved in OXPHOS.42 By phosphorylating and inhibiting eukaryotic translation initiation factor 4E–binding proteins (4EBPs), mTOR increases the translation of an overlapping cohort of nucleus-encoded mitochondria-related genes (ie, CII-succinate dehydrogenase complex, subunit B [SDHB]).43 The phosphorylation of 4EBP1 and p70S6K by mTOR also promotes the translation of genes encoding ribosomal subunits, many of which are regulated at the transcriptional level by Myc (ie, RPS19 and RPL5).44 Therefore, the increase in mTOR activity may represent 1 component of a compensatory mechanism aimed at increasing mitochondrial activity and translation in erythroid cells from PolgAmt/mt mice.
Figure 3.
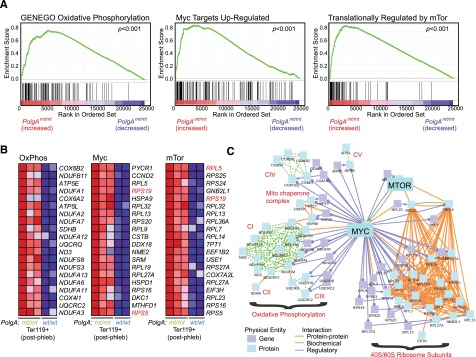
Erythroid cells from mtDNA-mutator mice show increased expression of genes involved in OXPHOS and ribosomal subunits. (A-C) RNA was extracted from Ter119+ erythroid cells positively selected from the bone marrow of phlebotomized mice by using magnetic beads and used for expression profile analyses. Results of gene set–enrichment analysis are shown in supplemental Table 5. Enrichment plots and heat maps for the top 20 genes contributing to the enrichment scores for 3 selected gene sets are shown in panels A and B, respectively. A diagram of established interactions (physical, biochemical, and regulatory) among these 60 genes was generated by using ConsensusPathDB (induced network model) maintained by the Max Plank Institute and is shown in panel C.
Increased activation of mTOR signaling and suppression of autophagy in PolgAmt/mt erythroid cells with mitochondrial dysfunction
In addition to regulating translation and mitochondrial activity, mTOR activation suppresses autophagy by phosphorylating and inhibiting ULK1.45,46 To explore the possibility that activation of mTOR in erythroid cells of mtDNA-mutator mice may contribute to the defect in clearance of mitochondria and ribosomes from RBCs, we examined mTOR activity, autophagy, and mitochondrial content in erythroid cells at different stages of maturation. We detected increased levels of phosphorylated 4EBP1 by immunofluorescence confocal microscopy in early erythroid progenitors (eg, P1 + PreCFUE) sorted from phlebotomized wild-type and mtDNA-mutator mice (Figure 4A,C), consistent with an increase in mTOR activity. We also observed a decrease in the number of LC3+ puncta (eg, autophagosomes) in early erythroid progenitors (Figure 4B,D). Although we did not observe a difference in MG staining in early erythroid progenitors from phlebotomized wild-type and mtDNA-mutator mice (Figure 4E, left), there was a relative increase in mitochondrial content in erythroid cells from mtDNA-mutator mice at the next stage of maturation (eg, Ter119+ population “A”) (Figure 4E, right). Given the dynamic nature of erythroid differentiation, where there is a rapid and dramatic reduction in cell size and mitochondrial content because of cell divisions with shortened G1 phase,47 it is possible that the increase in mitochondrial content resulting from reduced flux through the autophagy pathway represents only a small proportion of the total mitochondrial content in early progenitors and therefore is only apparent after the cell division–associated reduction in mitochondrial mass (Figure 4F).
Figure 4.

Increased mTOR signaling and decreased autophagy in early erythroid progenitors from phlebotomized mtDNA-mutator mice. (A-D) Early erythroid progenitors were sorted from the bone marrow of phlebotomized animals. Cytospins were prepared from the sorted cells and stained with antibodies against phosphorylated 4EBP and LC3. Representative confocal images of phosphorylated 4EBP1 and LC3 staining are shown in panels A and B, respectively. Scale bar represents 2 μM. (C) Mean fluorescence intensity (MFI) of phosphorylated 4EBP1 staining within 4,6-diamidino-2-phenylindole (DAPI)–positive nuclei was calculated for each cell. Graph shows mean MFI ± SEM. n > 15 images per genotype from 3 independent experiments. (D) The number of punctate LC3+ structures per cell was counted visually by an observer blinded to the experimental conditions. Graph shows the number of LC3 puncta per cell (circles) and mean value (black line) from a representative experiment. n > 30 cells per genotype. (E) MG staining was analyzed by FACS in the indicated populations of erythroid cells. MFI was normalized to that of Ter119+ population “A” in wild-type mice for each experiment. Graphs show mean ± SEM. n = 4 mice per genotype. (F) Schematic diagram highlighting the increase in mTOR activity and decrease in autophagy in early erythroid progenitors from phlebotomized mtDNA-mutator mice. We speculate that the increase in mitochondrial mass in Ter119+ population “A” results from the defect in autophagy in early erythroid progenitors.
Within the Ter119+ erythroid cell population isolated from phlebotomized animals, we detected increased levels of phosphorylated 4EBP1 by immunofluorescence confocal microscopy in Ter119+ population A cells (supplemental Figure 3A,C). Although we did not detect increased levels of phosphorylated 4EBP1 in Ter119+ population B cells (supplemental Figure 3B-C), we observed a significant (P < .05) increase in phosphorylation of ribosomal protein S6 in those cells (Figure 5A-B). In vitro translation assays using whole-cell extracts prepared from Ter119+ erythroid cells or population B showed marked increases in the translation of a 15-kDa protein predicted to be hemoglobin subunit α (Figure 5C-D). These results indicate that mTOR activity is increased in Ter119+ erythroid cells, but that the substrate specificity may vary depending on the maturation stage.
Figure 5.

Increased mTOR signaling and decreased autophagy at late stages of erythroid maturation in phlebotomized mtDNA-mutator mice. (A-F) Ter119+ erythroid cells were positively selected from spleens of phlebotomized mice by using magnetic beads and sorted by FACS based on CD71 expression and forward scatter. (A-B) Extracts prepared from sorted populations were subjected to immunoblot analyses using antibodies against phosphorylated S6 (pS6), total S6 (S6), and glyceraldehyde-3-phosphate dehydrogenase (GAPDH). Representative immunoblots and graphs (B) show higher phosphorylation of ribosomal protein S6 in Ter119+ erythroid population “B” (CD71+ FSClow) from mtDNA-mutator mice than from wild-type littermates. n = 2 (wild-type) or 3 (PolgAmt/mt) mice. (C-D) Sorted populations of erythroid cells were incubated in media containing 35S-labeled amino acids to assess translation. Representative autoradiographs (C) and graphs (D) show higher levels of translation of a 15-kDa protein (consistent with hemoglobin subunit α) in cells from mtDNA-mutator mice. n = 2 (wild-type) or 3 (PolgAmt/mt) mice. (E-H) Extracts prepared from the sorted populations were subjected to immunoblot analyses using antibodies against LC3 and GAPDH. Representative immunoblots (E,G) and graphs (F,H) show lower LC3 conversion in Ter119+ erythroid populations “B” (CD71+ FSClow) and “C” (CD71−FSClow) from mtDNA-mutator mice than in those from wild-type littermates. n = 4 mice per genotype. (I-J) Extracts prepared from Ter119+ erythroid population “C” were subjected to immunoblot analyses using antibodies against P62 and GAPDH. Representative immunoblots (I) and graph (J) show increased steady-state levels of P62 in erythroid cells from mtDNA-mutator mice. (K) MG staining was analyzed by FACS in Ter119+ erythroid population “C.” MFI was normalized to that of Ter119+ population “A” in wild-type mice for each experiment (see Figure 4E). n = 4 mice per genotype. The graph shows the increased mitochondrial content in erythroid cells from mtDNA-mutator mice. Graphs in panels B, D, F, and G show mean ± SEM. P < .05. (L) Schematic diagram highlighting increase in mTOR activity and translation and decrease in autophagy in late erythroid progenitors (Ter119+ population “B” or “C”) of aged or phlebotomized mtDNA-mutator mice.
We also detected lower levels of conversion of soluble LC3I to lipid-bound LC3II in Ter119+ population B cells from PolgAmt/mt mice. The increase in mTOR activity and decrease in LC3 conversion in Ter119+ population B was associated with an increase in steady-state levels of P62 and mitochondrial content at the subsequent stage of erythroid maturation (eg, Ter119+ population “C”) (Figure 5I-K). P62 is an ubiquitin-binding scaffold protein that is degraded by autophagy and accumulates when autophagy is inhibited48,49; therefore, the decreased LC3 conversion and accumulation of P62 and mitochondria are consistent with a defect in autophagy in mature RBCs from mtDNA-mutator mice.
Suppression of autophagy in PolgAmt/mt cells with mitochondrial dysfunction is not restricted to the erythroid lineage
To determine whether the suppression of autophagy was restricted to erythroid cells, we performed a series of experiments using primary or SV40-transformed murine embryonic fibroblasts (MEFs) and other tissues derived from mtDNA-mutator mice. SV40 transformation of primary MEFs recapitulated the age-dependent accumulation of somatic mtDNA mutations and mitochondrial dysfunction (supplemental Figure 4A-D) observed in aged PolgAmt/mt mice. Similar to what we observed in PolgAmt/mt erythroid cells, the mitochondrial dysfunction in transformed PolgAmt/mt MEFs was accompanied by an aberrant increase in mTOR signaling (supplemental Figure 4E-F) and suppression of autophagy (supplemental Figure 4G-I), which were not detected in primary MEFs (supplemental Figure 4F-I). Similarly, the decline in mitochondrial function detected in the spleens of old mtDNA-mutator mice (Figure 2B-D) was accompanied by higher levels of mTOR activity, as evidenced by the increase in 4EBP phosphorylation (Figure 6A-B) and higher levels of ribosomal subunits (Figure 6C-D). The corresponding increase in steady-state levels of P62 (Figure 6E-F) was consistent with a defect in autophagy. We also observed increased levels of P62 in kidneys and hearts (supplemental Figure 4I-J) from old (12 months of age) PolgAmt/mt mice but not in those organs from younger (2 to 4 months of age) animals. Together, these results demonstrate that the accumulation of somatic mtDNA mutations and associated defects in mitochondrial respiration may lead to the aberrant activation of mTOR and suppress flux through the autophagy pathway in both erythroid and nonerythroid cells.
Figure 6.
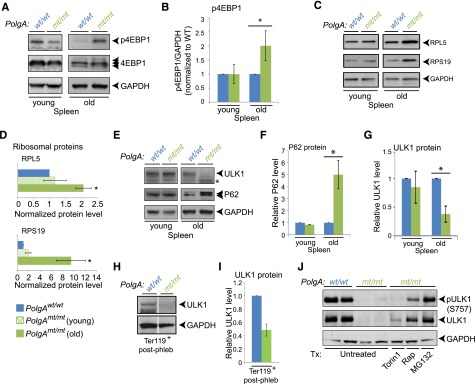
Posttranslational regulation of ULK1 levels in erythroid cells and splenocytes from mtDNA-mutator mice. Representative immunoblots (A) and graphs (B) showing the steady-state levels of p4EBP1, total 4EBP1, and GAPDH in young (2-month-old) and old (8- to 12-month-old) mice. The ratio of phosphorylation to total 4EBP1 was normalized to that of wild-type animals for each set of mice. Representative immunoblots (C) and graphs (D) showing the steady-state levels of ribosomal proteins RPL5 and RPS19 in spleens of young and old mice. n = 2 mice per genotype (young) or 3 mice per genotype (old). (E-G) Representative immunoblots and graphs (mean ± standard deviation) showing steady-state levels of P62 (E-F) and ULK1 (E,G) in spleens of young and old mice. n = 2 mice per genotype per time point. (H-I) Lin−/Ter119+ erythroid cells were selected from bone marrow of phlebotomized mice by using magnetic beads. Extracts prepared from sorted populations were subjected to immunoblot analyses using antibodies against ULK1 and GAPDH. The wild-type and Polgmt/mt lanes in the representative immunoblots (H) are separated by white lines to indicate juxtaposition of 2 nonadjacent from the same gel. The graph (mean ± SEM) shows reduced ULK1 levels (normalized to GAPDH) in erythroid cells of mtDNA-mutator mice. n = 3 (wild-type) or 4 (PolgAmt/mt) mice. P < .01. (J) Splenocytes were isolated from spleens of old mtDNA-mutator mice and incubated with or without the indicated drugs for 3 hours: 250 nM Torin1, 25 nM rapamycin (Rap), or 25 nM MG132. ULK1 immunoprecipitates were analyzed by immunoblot analyses for ULK1 phosphorylated at serine 757 (by using 4/5 of the immunoprecipitate) and total ULK1 (by using 1/5 of the immunoprecipitate). The experiment was performed 3 times; a representative experiment is shown.
Activation of mTOR in PolgAmt/mt mice facilitates proteasome-mediated degradation of ULK1 in a cell-type–specific manner
We observed increased levels of serine 757–phosphorylated ULK1 in transformed PolgAmt/mt MEFs and old PolgAmt/mt hearts (supplemental Figure 4K), consistent with mTOR activation suppressing autophagy by phosphorylating ULK1 at serine residue 757 and inhibiting its autophagy-inducing function.46 By contrast, mTOR activation in the spleens of old mtDNA-mutator mice was accompanied by an unexpected decrease in ULK1 levels (Figure 6E,G). The difference in steady-state levels of ULK1 protein between wild-type and mtDNA-mutator mice was also observed in the spleens of phlebotomized mice (supplemental Figure 5A), in which Ter119+ erythroid cells account for >40% of cellularity (supplemental Figure 5C), and in Ter119+ cells isolated from the bone marrow of phlebotomized mice (Figure 6H-I). The loss of ULK1 protein in phlebotomized spleens could not be fully accounted for by the reduction in ULK1 messenger RNA (supplemental Figure 5B), raising the possibility of altered posttranscriptional regulation of ULK1 in splenocytes and erythroid cells with mtDNA mutation–associated mitochondrial dysfunction.
To gain insight into the mechanism(s) responsible for the loss of ULK1 protein in PolgAmt/mt cells, we treated splenocytes isolated from old mtDNA-mutator mice with various drugs targeting lysosomes (eg, bafilomycin A1), proteasomes (eg, MG132), and mTOR signaling (eg, Torin1, rapamycin). Although these drugs had minimal effects on ULK1 protein levels in wild-type splenocytes (supplemental Figure 5D), treating PolgAmt/mt splenocytes with MG132 resulted in ULK1 being restored to a level similar to that in wild-type cells (supplemental Figure 5D and Figure 6J), consistent with proteasome-dependent degradation of ULK1. Treatment of PolgAmt/mt splenocytes with Torin1 or rapamycin also restored ULK1 levels to varying degrees and suppressed phosphorylation of ULK1 at serine 757 (Figure 6J), suggesting that the aberrant activation of mTOR contributes to proteasome-mediated degradation of ULK1, at least in certain cell types.
ULK1-deficiency results in RBC macrocytosis and a defect in clearance of organelles from reticulocytes21 that can be recapitulated in lethally irradiated wild-type animals by adoptive transfer of ULK1-deficient bone marrow cells (supplemental Figure 6A-E). Therefore, the aberrant activation of mTOR in PolgAmt/mt erythroid progenitors with dysfunctional mitochondria and associated loss of ULK1 in erythroid cells may contribute to the defect in clearance of mitochondria and ribosomes in RBCs and the development of macrocytic anemia in old mtDNA-mutator mice.
Disrupting autophagy in PolgAmt/mt erythroid progenitors accelerates the onset and progression of anemia
During the course of our studies examining autophagy and mitochondrial content in erythroid cells, a few studies suggested that autophagy was not suppressed in young mtDNA-mutator mice as it was in older mice. For example, we did not detect any significant retention of mitochondria in PolgAmt/mt circulating RBCs until after 4 months of age (Figure 1B). Indeed, there was no significant difference in mitochondrial content in bone marrow–derived cells from young (2- to 4-month-old) wild-type or mtDNA-mutator mice at any stage of erythroid maturation (supplemental Figure 7A). Additionally, we detected more LC3+ puncta (eg, autophagosomes) in early erythroid progenitors isolated from young (2- to 4-month-old) mtDNA-mutator mice than from wild-type littermates (supplemental Figure 7B), in contrast to the decrease in LC3+ puncta observed in early progenitors from phlebotomized mtDNA-mutator mice (Figure 4B,D). These findings raised the possibility that autophagy may be induced in cells from young mtDNA-mutator mice. Because autophagy can reduce the mtDNA-mutation burden in cultured cells containing a mixture of normal and mutated mtDNA,28,29 we used a genetic approach to investigate the in vivo consequence of inhibiting autophagy on mitochondrial function and disease progression in mtDNA-mutator mice.
Although Ulk1 alone is overexpressed during terminal stages of murine erythroid differentiation, both Ulk1 and Ulk2 are expressed at comparable levels in early erythroid progenitors (supplemental Figure 8). Because ULK1 and ULK2 share overlapping functions in regulating autophagy,50 we decided to target the expression of Atg7, a nonredundant E1-like enzyme, which is essential for autophagosome biogenesis via the canonical pathway20 and expressed in erythroid progenitors (supplemental Figure 8). Therefore, to disrupt autophagy in erythroid progenitors in wild-type and mtDNA-mutator mice, we interbred PolgAwt/mt17 with Atg7flox/flox31 and Eporwt/GFPCre30 mice. EporGFPCre is selectively expressed in early erythroid progenitors30 beginning at the PreCFUE stage (supplemental Figure 9A-D).
We observed the appropriate cell-type–specific appearance of the Atg7 knockout allele in Ter119+ erythroid cells from the bone marrow and spleens (supplemental Figure 9E) of mice expressing EpoGFPCre, and a corresponding reduction in the expression of Atg7 messenger RNA (supplemental Figure 9F-G). In contrast to the adverse effects of deleting Atg7 in HSCs,51 selectively deleting Atg7 in erythroid progenitors of otherwise normal mice caused no significant decrease in morbidity/mortality (Figure 7A) relative to wild-type littermates. We detected a small, albeit statistically significant (P < .02), difference in hemoglobin levels between wild-type (13.7 + 0.1 g/dL) and Atg7flox/flox EpoR+/GFPCre (13.1 + 0.2 g/dL) mice at 4 months of age (Figure 7 and supplemental Table 6); however, this minimal difference did not persist as the animals aged (Figure 7) and was not accompanied by a significant difference in spleen weights in 8-month-old animals (supplemental Figure 9H, compare “W” and “A”). Autophagy-mediated clearance of mitochondria from reticulocytes in adult mice relies primarily on a ULK1-dependent, Atg5/7-independent (noncanonical) autophagy pathway.21,25,52 Therefore, it was not surprising that deleting Atg7 from wild-type erythroid progenitors did not affect the ability of reticulocytes to eliminate mitochondria in vivo at baseline (Figure 7E-F) and only minimally affected reticulocyte maturation after phlebotomy (supplemental Figure 10A-C). Of note, disrupting Atg7 expression in erythroid progenitors of otherwise wild-type mice did not significantly affect CIV activity (relative to CS activity), ATP levels, mtDNA copy number, or oxygen consumption (Figure 7G-J) in Ter119+ erythroid cells.
Figure 7.

Disruption of autophagy in erythroid progenitors of mtDNA-mutator mice accelerates the onset and progression of anemia. (A) Survival curve showing percent survival at different time points. W: Atg7f/f Eporwt/wt PolgAwt/wt; A: Atg7f/f Eporwt /GFPCre PolgAwt/wt; P: Atg7f/f Eporwt/wt PolgAmt/mt; and D: Atg7f/f Eporwt/GFPCre PolgAmt/mt. (B) Femurs isolated from 11-month-old mice at necropsy. Note the pallor in the double-mutant animals (“D”, arrow). (C-D) Graphs (mean ± SEM) showing hemoglobin (HGB) and mean corpuscular volume (MCV) values in mice at different ages. Summary of statistical analyses for panels C-E are shown in supplemental Table 6. (E-F) PB RBCs were gated based on characteristic forward and side scatter properties and analyzed by FACS for surface CD71 expression and TMRM staining. (E) Graphs showing the percentage of PB RBCs within the R1 and R2 gates from mice at different ages. (F) Representative FACS plots showing the distribution of cells in the R1 and R2 gates from 11-month-old mice. The R2 gate consists of reticulocytes that are positive for CD71 and contain mitochondria. The R1 gate contains an abnormal population of cells that have lost surface CD71 expression but retain mitochondria. (G-J) Ter119+ erythroid cells were positively selected from spleens or bone marrows of phlebotomized mice by using magnetic beads. (G) CIV and CS activities were measured and their ratios calculated. n = 5 (W), 4 (A), 4 (P), or 3 (D) mice. (H) Values obtained from ATP analysis were normalized to that of wild-type or PolgAmt/mt mice for each set of animals. n = 6 (W), 6 (A), 4 (P), or 4 (D) mice. (I) The oxygen consumption rate (OCR) was analyzed by using the Seahorse XF-24 Extracellular Flux Analyzer. Values were normalized to that of wild-type or PolgAmt/mt mice for each set of animals. n = 3 (W), 2 (A), 6 (P), or 5 (D) mice per genotype. (J) Quantitative PCR analysis was used to determine the ratio of ND2 (mtDNA) to 18S (mtDNA) (an estimate of mtDNA copy numbers per genome). This ratio was normalized to that of wild-type or PolgAmt/mt mice for each set of animals. n = 4 (W), 4 (A), 6 (P), or 6 (D) mice.
In contrast, deleting Atg7 from PolgAmt/mt erythroid progenitors accelerated the onset of macrocytic anemia and morbidity of mtDNA-mutator mice (Figure 7A-D). The spleens of 8-month-old Atg7-deleted mtDNA-mutator mice were comparable in size to PolgAmt/mt littermates (supplemental Figure 9H), whereas the femurs from 11-month-old Atg7-deleted mtDNA-mutator mice had greater pallor (Figure 7B, arrow) than did those of littermate controls, including PolgAmt/mt mice. Erythroid-specific deletion of Atg7 in PolgAmt/mt mice resulted in a more severe defect in the clearance of mitochondria during reticulocyte maturation in PB than in PolgAmt/mt mice (Figure 7E-F) and was accompanied by worsening of mitochondrial function (Figure 7G-J). Specifically, we observed a significant decline in the CIV:CS ratio (Figure 7G), ATP levels (Figure 7H), and oxygen consumption (Figure 7I) after Atg7 deletion in PolgAmt/mt mice. The decline in oxygen consumption was accompanied by an increase in mtDNA copy number (Figure 7J), further highlighting the degree of mitochondrial dysfunction resulting from the deletion of Atg7 in mtDNA-mutator mice. The increased phosphorylated S6 levels detected in Ter119+ erythroid cells from PolgAmt/mt mice were also observed in Atg7-deleted PolgAmt/mt mice (supplemental Figure 9I). Together, these data indicate that Atg7 helps to maintain mitochondrial function in erythroid cells harboring mtDNA mutations.
Discussion
Herein we establish that the canonical Atg7-dependent autophagy pathway plays an important role in maintaining mitochondrial function in vivo in erythroid cells harboring mtDNA mutations and delays the onset of anemia in mtDNA-mutator mice. We also demonstrate that the progressive increase in mtDNA-mutation frequency and mitochondrial dysfunction driven by the targeted disruption of PolgA proofreading activity in HSCs of mtDNA-mutator mice eventually leads to a paradoxical increase in mTOR activity and suppression of the mito-protective autophagy response in early erythroid progenitors. The aberrant activation of mTOR in erythroid cells also contributes to proteasome-mediated degradation of ULK1. ULK1 deficiency causes RBC macrocytosis and a defect in clearance of mitochondria,21 which can reduce the life span of RBCs.35 Therefore, our results suggest that the aberrant activation of mTOR in differentiating erythroid cells contributes the development of macrocytic anemia in mtDNA-mutator mice by suppressing the mito-protective autophagy response in early erythroid progenitors and the clearance of mitochondria in mature RBCs.
The findings described in this manuscript are significant for several reasons. First, we provide definitive evidence that autophagy helps to maintain mitochondrial function in cells with mtDNA mutations in vivo. Because promoting autophagy reduces the mtDNA-mutation burden in human cytoplasmic hybrid cell lines carrying pathogenic mtDNA mutations,28,29 autophagy most likely maintains mitochondrial function by facilitating the removal of the most dysfunctional components of the mitochondrial network in mtDNA-mutator mice, at least before mTOR is upregulated and a feedback loop that suppresses autophagy is initiated (supplemental Figure 11). These findings provide scientific rationale for examining the efficacy of autophagy-inducing drugs in improving mitochondrial function in animal models and patients with heteroplasmic mtDNA mutations.
Our studies also highlight the paradoxical activation of mTOR and suppression of autophagy in multiple cell types with mtDNA mutations and associated defects in mitochondrial respiration. The activation of mTOR in cells with mitochondrial respiratory defects is paradoxical because the associated reduction in cellular ATP levels is predicted to activate the energy-sensing adenosine 5′-monophosphate–activated protein kinase, which coordinates the suppression of anabolic pathways (including mTOR-mediated cell growth) and upregulation of catabolic pathways (including autophagy) in response to ATP depletion. Yet, the activation of mTOR in cells with mitochondrial dysfunction is not unique to the mtDNA-mutator mouse model. For example, mTOR signaling is increased in Ndufs4−/− mice, which have a defect in the assembly of complex I of the mitochondrial electron transport chain.53 Pharmacologic inhibition of mTOR alleviates many symptoms associated with NADH dehydrogenase (ubiquinone) Fe-S protein 4 deficiency,53 supporting the notion that excessive mTOR activation contributes to the pathogenesis of diseases associated with mitochondrial dysfunction. Increased mTOR signaling also shortens the life span of yeast mutants with various mitochondrial defects, suggesting that this adaptive (or maladaptive) response may be evolutionarily conserved.54,55 Although increased mTOR signaling may initially help boost cellular respiratory capacity and maintain hemoglobin production in erythroid cells with dysfunctional mitochondria, excessive mTOR activity may ultimately accelerate the decline in mitochondrial function and onset of mtDNA mutation–associated morbidity and mortality by handicapping one of the cells’ major quality-control pathways (supplemental Figure 11). Therefore, elucidating the mechanism by which mTOR activity becomes uncoupled from signals associated with low energy stores in cells with mitochondrial respiratory defects may reveal new therapeutic strategies for treating patients with mitochondrial disorders.
Finally, our findings may be relevant for patients with MDS. Ultrastructural studies have shown increased numbers of autophagosomes and lysosomes containing mitochondria in early erythroblasts of patients with low-risk MDS and enlarged, abnormal mitochondria with iron accumulation in patients with high-risk disease and transfusion dependency.56 These observations indicate an inverse correlation between the presence of autophagosomes and the accumulation of abnormal mitochondria in patients with MDS. Because autophagy plays a role in mitochondrial quality control in erythroid progenitors with mtDNA mutations, the autophagy in patients with low-risk MDS may represent an appropriate response to low levels of mtDNA mutations that arise with age. In patients with high-risk MDS, mTOR and its downstream targets are activated.57 It is possible that activation of mTOR in HSCs (eg, from mutations in the phosphatase and tensin homolog/v-akt murine thymoma viral oncogene homolog pathway) suppresses autophagy in HSCs and progenitors and facilitates the accumulation of abnormal mitochondria in progenitors, either of which may lead to MDS-like symptoms.3,4,26 However, in light of our findings, it is also possible that mitochondrial dysfunction (beyond a certain threshold) in HSCs leads to the activation of mTOR and suppression of autophagy in progenitor cells, at least in those patients without a genetic cause for mTOR activation (ie, loss of phosphatase and tensin homolog). Results from a small clinical trial suggest that rapamycin (sirolimus) has activity in a subset of patients with more advanced MDS.58 By inhibiting the uncoupled mTOR response and activating autophagy in erythroid progenitors, rapamycin may mitigate symptoms by inhibiting the vicious cycle of mitochondrial dysfunction and mTOR activation in patients with MDS.
Acknowledgments
The authors thank Dr Masaaki Komatsu (Tokyo Metropolitan Institute of Medical Science) for the Atg7flox/flox mice and Dr Ursula Klingmüller (German Cancer Research Center) for the Eporwt/GFPCre mice; Angela McArthur, Cherise Guess, and Vani Shanker for editing the manuscript; Rechel Geiger for technical assistance; David Finkelstein for Ingenuity Pathway Analysis; and the Cell and Tissue Imaging Center, the Flow Cytometry and Cell Sorting Shared Resource, the Immunology Flow Cytometry Core, and the Hartwell Center for Bioinformatics and Biotechnology at St. Jude Children’s Research Hospital for experimental assistance.
This work was supported in part by grants from the National Institutes of Health, National Heart, Lung, and Blood Institute (R01HL114697) (M.K.), the Burroughs Welcome Fund (M.K.), the American Society of Hematology (M.K.), and the American Lebanese Syrian Associated Charities (D.R.G., J.T.O., J.S., and M.K.).
Footnotes
The online version of this article contains a data supplement.
The publication costs of this article were defrayed in part by page charge payment. Therefore, and solely to indicate this fact, this article is hereby marked “advertisement” in accordance with 18 USC section 1734.
Authorship
Contribution: X.L.-H. designed experiments, performed experiments, analyzed and organized data, and contributed to manuscript preparation; S.M., J.L., C.W., A.J., R.I., and X.W. performed experiments and analyzed data; G.N. and Y.-D.W. performed bioinformatics analyses of data sets and contributed to manuscript preparation; T.A.P., J.E.T., J.T.O., D.R.G., and J.S. contributed valuable reagents, analyzed data, and/or edited the manuscript; and M.K. designed experiments, analyzed data, and prepared the manuscript.
Conflict-of-interest disclosure: The authors have no competing financial interests.
Correspondence: Mondira Kundu, St. Jude Children’s Research Hospital, 262 Danny Thomas Place, Mail Stop 343, Memphis, TN 38105; e-mail: mondira.kundu@stjude.org.
References
- 1.Cazzola M, Della Porta MG, Malcovati L. The genetic basis of myelodysplasia and its clinical relevance. Blood. 2013;122(25):4021–4034. doi: 10.1182/blood-2013-09-381665. [DOI] [PMC free article] [PubMed] [Google Scholar]
- 2.Wegrzyn J, Lam JC, Karsan A. Mouse models of myelodysplastic syndromes. Leuk Res. 2011;35(7):853–862. doi: 10.1016/j.leukres.2011.03.007. [DOI] [PubMed] [Google Scholar]
- 3.Joshi A, Kundu M. Mitophagy in hematopoietic stem cells: the case for exploration. Autophagy. 2013;9(11):1737–1749. doi: 10.4161/auto.26681. [DOI] [PMC free article] [PubMed] [Google Scholar]
- 4.Chen ML, Logan TD, Hochberg ML, et al. Erythroid dysplasia, megaloblastic anemia, and impaired lymphopoiesis arising from mitochondrial dysfunction. Blood. 2009;114(19):4045–4053. doi: 10.1182/blood-2008-08-169474. [DOI] [PMC free article] [PubMed] [Google Scholar]
- 5.Thompson JE, Conlon JP, Yang X, Sanchez PV, Carroll M. Enhanced growth of myelodysplastic colonies in hypoxic conditions. Exp Hematol. 2007;35(1):21–31. doi: 10.1016/j.exphem.2006.08.017. [DOI] [PMC free article] [PubMed] [Google Scholar]
- 6.Schildgen V, Wulfert M, Gattermann N. Impaired mitochondrial gene transcription in myelodysplastic syndromes and acute myeloid leukemia with myelodysplasia-related changes. Exp Hematol. 2011;39(6):666–675. doi: 10.1016/j.exphem.2011.03.007. [DOI] [PubMed] [Google Scholar]
- 7.Cano KE, Li L, Bhatia S, Bhatia R, Forman SJ, Chen Y. NMR-based metabolomic analysis of the molecular pathogenesis of therapy-related myelodysplasia/acute myeloid leukemia. J Proteome Res. 2011;10(6):2873–2881. doi: 10.1021/pr200200y. [DOI] [PMC free article] [PubMed] [Google Scholar]
- 8.Li L, Li M, Sun C, et al. Altered hematopoietic cell gene expression precedes development of therapy-related myelodysplasia/acute myeloid leukemia and identifies patients at risk. Cancer Cell. 2011;20(5):591–605. doi: 10.1016/j.ccr.2011.09.011. [DOI] [PMC free article] [PubMed] [Google Scholar]
- 9.Yunis AA, Smith US, Restrepo A. Reversible bone marrow suppression from chloramphenicol. A consequence of mitochondrial injury. Arch Intern Med. 1970;126(2):272–275. [PubMed] [Google Scholar]
- 10.Dawson MA, Davis A, Elliott P, Cole-Sinclair M. Linezolid-induced dyserythropoiesis: chloramphenicol toxicity revisited. Intern Med J. 2005;35(10):626–628. doi: 10.1111/j.1445-5994.2005.00912.x. [DOI] [PubMed] [Google Scholar]
- 11.Fleming MD. Congenital sideroblastic anemias: iron and heme lost in mitochondrial translation. Hematology Am Soc Hematol Educ Program. 2011;2011(1):525–531. doi: 10.1182/asheducation-2011.1.525. [DOI] [PubMed] [Google Scholar]
- 12.Wulfert M, Küpper AC, Tapprich C, et al. Analysis of mitochondrial DNA in 104 patients with myelodysplastic syndromes. Exp Hematol. 2008;36(5):577–586. doi: 10.1016/j.exphem.2008.01.004. [DOI] [PubMed] [Google Scholar]
- 13.Linnartz B, Anglmayer R, Zanssen S. Comprehensive scanning of somatic mitochondrial DNA alterations in acute leukemia developing from myelodysplastic syndromes. Cancer Res. 2004;64(6):1966–1971. doi: 10.1158/0008-5472.can-03-2956. [DOI] [PubMed] [Google Scholar]
- 14.Gattermann N. From sideroblastic anemia to the role of mitochondrial DNA mutations in myelodysplastic syndromes. Leuk Res. 2000;24(2):141–151. doi: 10.1016/s0145-2126(99)00160-5. [DOI] [PubMed] [Google Scholar]
- 15.Zamzami MA, Duley JA, Price GR, et al. Inosine triphosphate pyrophosphohydrolase (ITPA) polymorphic sequence variants in adult hematological malignancy patients and possible association with mitochondrial DNA defects. J Hematol Oncol. 2013;6:24. doi: 10.1186/1756-8722-6-24. [DOI] [PMC free article] [PubMed] [Google Scholar]
- 16.Parker JE, Mufti GJ. The role of apoptosis in the pathogenesis of the myelodysplastic syndromes. Int J Hematol. 2001;73(4):416–428. doi: 10.1007/BF02994003. [DOI] [PubMed] [Google Scholar]
- 17.Kujoth GC, Hiona A, Pugh TD, et al. Mitochondrial DNA mutations, oxidative stress, and apoptosis in mammalian aging. Science. 2005;309(5733):481–484. doi: 10.1126/science.1112125. [DOI] [PubMed] [Google Scholar]
- 18.Trifunovic A, Wredenberg A, Falkenberg M, et al. Premature ageing in mice expressing defective mitochondrial DNA polymerase. Nature. 2004;429(6990):417–423. doi: 10.1038/nature02517. [DOI] [PubMed] [Google Scholar]
- 19.Twig G, Elorza A, Molina AJ, et al. Fission and selective fusion govern mitochondrial segregation and elimination by autophagy. EMBO J. 2008;27(2):433–446. doi: 10.1038/sj.emboj.7601963. [DOI] [PMC free article] [PubMed] [Google Scholar]
- 20.Hurley JH, Schulman BA. Atomistic autophagy: the structures of cellular self-digestion. Cell. 2014;157(2):300–311. doi: 10.1016/j.cell.2014.01.070. [DOI] [PMC free article] [PubMed] [Google Scholar]
- 21.Kundu M, Lindsten T, Yang CY, et al. Ulk1 plays a critical role in the autophagic clearance of mitochondria and ribosomes during reticulocyte maturation. Blood. 2008;112(4):1493–1502. doi: 10.1182/blood-2008-02-137398. [DOI] [PMC free article] [PubMed] [Google Scholar]
- 22.Feng Y, He D, Yao Z, Klionsky DJ. The machinery of macroautophagy. Cell Res. 2014;24(1):24–41. doi: 10.1038/cr.2013.168. [DOI] [PMC free article] [PubMed] [Google Scholar]
- 23.Chan EY, Kir S, Tooze SA. siRNA screening of the kinome identifies ULK1 as a multidomain modulator of autophagy. J Biol Chem. 2007;282(35):25464–25474. doi: 10.1074/jbc.M703663200. [DOI] [PubMed] [Google Scholar]
- 24.Honda S, Arakawa S, Nishida Y, Yamaguchi H, Ishii E, Shimizu S. Ulk1-mediated Atg5-independent macroautophagy mediates elimination of mitochondria from embryonic reticulocytes. Nat Commun. 2014;5:4004. doi: 10.1038/ncomms5004. [DOI] [PubMed] [Google Scholar]
- 25.Zhang J, Randall MS, Loyd MR, et al. Mitochondrial clearance is regulated by Atg7-dependent and -independent mechanisms during reticulocyte maturation. Blood. 2009;114(1):157–164. doi: 10.1182/blood-2008-04-151639. [DOI] [PMC free article] [PubMed] [Google Scholar]
- 26.Mortensen M, Ferguson DJ, Edelmann M, et al. Loss of autophagy in erythroid cells leads to defective removal of mitochondria and severe anemia in vivo. Proc Natl Acad Sci USA. 2010;107(2):832–837. doi: 10.1073/pnas.0913170107. [DOI] [PMC free article] [PubMed] [Google Scholar]
- 27.Winklhofer KF. Parkin and mitochondrial quality control: toward assembling the puzzle. Trends Cell Biol. 2014;24(6):332–341. doi: 10.1016/j.tcb.2014.01.001. [DOI] [PubMed] [Google Scholar]
- 28.Gilkerson RW, De Vries RL, Lebot P, et al. Mitochondrial autophagy in cells with mtDNA mutations results from synergistic loss of transmembrane potential and mTORC1 inhibition. Hum Mol Genet. 2012;21(5):978–990. doi: 10.1093/hmg/ddr529. [DOI] [PMC free article] [PubMed] [Google Scholar]
- 29.Dai Y, Zheng K, Clark J, et al. Rapamycin drives selection against a pathogenic heteroplasmic mitochondrial DNA mutation. Hum Mol Genet. 2014;23(3):637–647. doi: 10.1093/hmg/ddt450. [DOI] [PMC free article] [PubMed] [Google Scholar]
- 30.Heinrich AC, Pelanda R, Klingmüller U. A mouse model for visualization and conditional mutations in the erythroid lineage. Blood. 2004;104(3):659–666. doi: 10.1182/blood-2003-05-1442. [DOI] [PubMed] [Google Scholar]
- 31.Komatsu M, Waguri S, Ueno T, et al. Impairment of starvation-induced and constitutive autophagy in Atg7-deficient mice. J Cell Biol. 2005;169(3):425–434. doi: 10.1083/jcb.200412022. [DOI] [PMC free article] [PubMed] [Google Scholar]
- 32.Dzierzak E, Philipsen S. Erythropoiesis: development and differentiation. Cold Spring Harb Perspect Med. 2013;3(4):a011601. doi: 10.1101/cshperspect.a011601. [DOI] [PMC free article] [PubMed] [Google Scholar]
- 33.Norddahl GL, Pronk CJ, Wahlestedt M, et al. Accumulating mitochondrial DNA mutations drive premature hematopoietic aging phenotypes distinct from physiological stem cell aging. Cell Stem Cell. 2011;8(5):499–510. doi: 10.1016/j.stem.2011.03.009. [DOI] [PubMed] [Google Scholar]
- 34.Zhang J, Kundu M, Ney PA. Mitophagy in mammalian cells: the reticulocyte model. Methods Enzymol. 2009;452:227–245. doi: 10.1016/S0076-6879(08)03615-X. [DOI] [PubMed] [Google Scholar]
- 35.Sandoval H, Thiagarajan P, Dasgupta SK, et al. Essential role for Nix in autophagic maturation of erythroid cells. Nature. 2008;454(7201):232–235. doi: 10.1038/nature07006. [DOI] [PMC free article] [PubMed] [Google Scholar]
- 36.Lee LG, Chen CH, Chiu LA. Thiazole orange: a new dye for reticulocyte analysis. Cytometry. 1986;7(6):508–517. doi: 10.1002/cyto.990070603. [DOI] [PubMed] [Google Scholar]
- 37.Larsen S, Nielsen J, Hansen CN, et al. Biomarkers of mitochondrial content in skeletal muscle of healthy young human subjects. J Physiol. 2012;590(pt 14):3349–3360. doi: 10.1113/jphysiol.2012.230185. [DOI] [PMC free article] [PubMed] [Google Scholar]
- 38.Buchet K, Godinot C. Functional F1-ATPase essential in maintaining growth and membrane potential of human mitochondrial DNA-depleted rho degrees cells. J Biol Chem. 1998;273(36):22983–22989. doi: 10.1074/jbc.273.36.22983. [DOI] [PubMed] [Google Scholar]
- 39.Subramanian A, Tamayo P, Mootha VK, et al. Gene set enrichment analysis: a knowledge-based approach for interpreting genome-wide expression profiles. Proc Natl Acad Sci USA. 2005;102(43):15545–15550. doi: 10.1073/pnas.0506580102. [DOI] [PMC free article] [PubMed] [Google Scholar]
- 40.Zeller KI, Jegga AG, Aronow BJ, O’Donnell KA, Dang CV. An integrated database of genes responsive to the Myc oncogenic transcription factor: identification of direct genomic targets. Genome Biol. 2003;4(10):R69. doi: 10.1186/gb-2003-4-10-r69. [DOI] [PMC free article] [PubMed] [Google Scholar]
- 41.Bilanges B, Argonza-Barrett R, Kolesnichenko M, et al. Tuberous sclerosis complex proteins 1 and 2 control serum-dependent translation in a TOP-dependent and -independent manner. Mol Cell Biol. 2007;27(16):5746–5764. doi: 10.1128/MCB.02136-06. [DOI] [PMC free article] [PubMed] [Google Scholar]
- 42.Dang CV. MYC, metabolism, cell growth, and tumorigenesis. Cold Spring Harbor Perspectives in Medicine. 2013;3(8) doi: 10.1101/cshperspect.a014217. [DOI] [PMC free article] [PubMed] [Google Scholar]
- 43.Morita M, Gravel SP, Chénard V, et al. mTORC1 controls mitochondrial activity and biogenesis through 4E-BP-dependent translational regulation. Cell Metab. 2013;18(5):698–711. doi: 10.1016/j.cmet.2013.10.001. [DOI] [PubMed] [Google Scholar]
- 44.Proud CG. mTORC1 regulates the efficiency and cellular capacity for protein synthesis. Biochem Soc Trans. 2013;41(4):923–926. doi: 10.1042/BST20130036. [DOI] [PubMed] [Google Scholar]
- 45.Jung CH, Jun CB, Ro SH, et al. ULK-Atg13-FIP200 complexes mediate mTOR signaling to the autophagy machinery. Mol Biol Cell. 2009;20(7):1992–2003. doi: 10.1091/mbc.E08-12-1249. [DOI] [PMC free article] [PubMed] [Google Scholar]
- 46.Kim J, Kundu M, Viollet B, Guan KL. AMPK and mTOR regulate autophagy through direct phosphorylation of Ulk1. Nat Cell Biol. 2011;13(2):132–141. doi: 10.1038/ncb2152. [DOI] [PMC free article] [PubMed] [Google Scholar]
- 47.Dolznig H, Bartunek P, Nasmyth K, Mullner EW, Beug H. Terminal differentiation of normal chicken erythroid progenitors: shortening of G1 correlates with loss of D-cyclin/cdk4 expression and altered cell size control. Cell Growth Differ. 1995;6(11):1341–1352. [PubMed] [Google Scholar]
- 48.Bjørkøy G, Lamark T, Pankiv S, Øvervatn A, Brech A, Johansen T. Monitoring autophagic degradation of p62/SQSTM1. Methods Enzymol. 2009;452:181–197. doi: 10.1016/S0076-6879(08)03612-4. [DOI] [PubMed] [Google Scholar]
- 49.Klionsky DJ, Abdalla FC, Abeliovich H, et al. Guidelines for the use and interpretation of assays for monitoring autophagy. Autophagy. 2012;8(4):445–544. doi: 10.4161/auto.19496. [DOI] [PMC free article] [PubMed] [Google Scholar]
- 50.Lee EJ, Tournier C. The requirement of uncoordinated 51-like kinase 1 (ULK1) and ULK2 in the regulation of autophagy. Autophagy. 2011;7(7):689–695. doi: 10.4161/auto.7.7.15450. [DOI] [PMC free article] [PubMed] [Google Scholar]
- 51.Mortensen M, Soilleux EJ, Djordjevic G, et al. The autophagy protein Atg7 is essential for hematopoietic stem cell maintenance. J Exp Med. 2011;208(3):455–467. doi: 10.1084/jem.20101145. [DOI] [PMC free article] [PubMed] [Google Scholar]
- 52.Nishida Y, Arakawa S, Fujitani K, et al. Discovery of Atg5/Atg7-independent alternative macroautophagy. Nature. 2009;461(7264):654–658. doi: 10.1038/nature08455. [DOI] [PubMed] [Google Scholar]
- 53.Johnson SC, Yanos ME, Kayser EB, et al. mTOR inhibition alleviates mitochondrial disease in a mouse model of Leigh syndrome. Science. 2013;342(6165):1524–1528. doi: 10.1126/science.1244360. [DOI] [PMC free article] [PubMed] [Google Scholar]
- 54.Heeren G, Rinnerthaler M, Laun P, et al. The mitochondrial ribosomal protein of the large subunit, Afo1p, determines cellular longevity through mitochondrial back-signaling via TOR1. Aging (Albany, NY Online) 2009;1(7):622–636. doi: 10.18632/aging.100065. [DOI] [PMC free article] [PubMed] [Google Scholar]
- 55.Schleit J, Johnson SC, Bennett CF, et al. Molecular mechanisms underlying genotype-dependent responses to dietary restriction. Aging Cell. 2013;12(6):1050–1061. doi: 10.1111/acel.12130. [DOI] [PMC free article] [PubMed] [Google Scholar]
- 56.Houwerzijl EJ, Pol HW, Blom NR, van der Want JJ, de Wolf JT, Vellenga E. Erythroid precursors from patients with low-risk myelodysplasia demonstrate ultrastructural features of enhanced autophagy of mitochondria. Leukemia. 2009;23(5):886–891. doi: 10.1038/leu.2008.389. [DOI] [PubMed] [Google Scholar]
- 57.Follo MY, Mongiorgi S, Bosi C, et al. The Akt/mammalian target of rapamycin signal transduction pathway is activated in high-risk myelodysplastic syndromes and influences cell survival and proliferation. Cancer Res. 2007;67(9):4287–4294. doi: 10.1158/0008-5472.CAN-06-4409. [DOI] [PubMed] [Google Scholar]
- 58.Platzbecker U, Haase M, Herbst R, et al. Activity of sirolimus in patients with myelodysplastic syndrome—results of a pilot study. Br J Haematol. 2005;128(5):625–630. doi: 10.1111/j.1365-2141.2005.05360.x. [DOI] [PubMed] [Google Scholar]