

Abstract
Aims: Peroxisomes are highly adaptable and dynamic organelles, adjusting their size, number, and enzyme composition to changing environmental and metabolic demands. We determined whether peroxisomes respond to ischemia, and whether peroxisomal biogenesis is an adaptive response to cerebral ischemia. Results: Focal cerebral ischemia induced peroxisomal biogenesis in peri-infarct neurons, which was associated with a corresponding increase in peroxisomal antioxidant enzyme catalase. Peroxisomal biogenesis was also observed in primary cultured cortical neurons subjected to ischemic insult induced by oxygen-glucose deprivation (OGD). A catalase inhibitor increased OGD-induced neuronal death. Moreover, preventing peroxisomal proliferation by knocking down dynamin-related protein 1 (Drp1) exacerbated neuronal death induced by OGD, whereas enhancing peroxisomal biogenesis pharmacologically using a peroxisome proliferator-activated receptor-alpha agonist protected against neuronal death induced by OGD. Innovation: This is the first documentation of ischemia-induced peroxisomal biogenesis in mammalian brain using a combined in vivo and in vitro approach, electron microscopy, high-resolution laser-scanning confocal microscopy, and super-resolution structured illumination microscopy. Conclusion: Our findings suggest that neurons respond to ischemic injury by increasing peroxisome biogenesis, which serves a protective function, likely mediated by enhanced antioxidant capacity of neurons. Antioxid. Redox Signal. 22, 109–120.
Introduction
Peroxisomes are important oxidative organelles, containing not only several free radical-generating and anti-oxidant enzymes, primarily catalase, a classic marker for peroxisome identification, but also glutathione peroxidase, superoxide dismutase (SOD, both Mn and Cu/Zn), and peroxiredoxin I. Peroxisomes are highly adaptable and dynamic organelles, adjusting their number, size, and enzyme composition to changing environment and metabolic demands. In a classic example of peroxisomal adaptation to the changing environment, when yeast are grown in a medium with a fatty acid source of energy, peroxisomes rapidly and markedly proliferate, presumably to upregulate fatty acid-metabolizing enzymes. On the other hand, switching to a glucose source of energy induces rapid loss of peroxisomes (10).
Innovation.
Our study is the first to document ischemia-induced peroxisomal biogenesis, and suggests that peroxisomes undergo biogenesis in response to metabolic stress and oxidative ischemic injury, as an endogenous mechanism of neuroprotection. Clinically, peroxisome-proliferator-activated receptor agonists are already in clinical use for diabetes and hypercholesterolemia. Whether their benefits are mediated by peroxisomal proliferation is not clear. Understanding the molecular events underlying peroxisomal biogenesis may lead to the development of new therapeutic agents for vascular ischemic disease in general, and for brain protection in particular, aimed at enhancing peroxisomal biogenesis in the brain after stroke.
The number of peroxisomes is determined by the balance between peroxisomal biogenesis (15, 24, 34) and their degradation (called pexophagy) (10, 27). Similar changes take place in mammalian tissues. For example, peroxisomes proliferate during fasting, hibernation, and diabetes (3, 41), when fatty acid metabolism predominates as a source of energy. Peroxisomes have also been shown to proliferate in regenerating liver after hepatectomy, and in cultured cells after exposure to 99% oxygen, UV light, hydrogen peroxide (H2O2), and other oxidizing agents (33, 39).
Finally, peroxisomes proliferate in response to peroxisome proliferator-activated receptor-alpha (PPARα) agonists, which at least in liver, protects against ischemia reperfusion injury (37). In neurons, PPARα agonists have been shown to play a neuroprotective role against β-amyloid toxicity (7, 28). On the other hand, downregulation of PPARα contributes to the microvascular dysfunction in diabetic retinopathy (16). Whether peroxisomes proliferate in mammalian brain after oxidative injury, such as results from cerebral ischemia, remains unknown.
Therefore, in this study, we examined peroxisome morphology, volume density, and enzyme content in the brain in vivo after focal cerebral ischemia induced by middle cerebral artery occlusion (MCAO). Using electron microscopy (EM) and high-resolution laser-scanning fluorescent microscopy, we observed changes in size and shape of peroxisomes in neurons consistent with peroxisomal biogenesis in the ischemic brain. Similar changes were observed in vitro in primary cultured neurons.
We further explored the functional role of postischemic induction of peroxisomal biogenesis by examining the effects of pharmacological proliferation of peroxisomes, and of catalase inhibition and prevention of peroxisomal division by knockdown of dynamin-related protein 1 (Drp1), an essential factor in peroxisomal division, on neuronal survival after ischemic injury induced in vitro by oxygen-glucose deprivation (OGD). Our findings suggest that peroxisomal biogenesis plays a protective role against ischemic neuronal injury, likely mediated by enhanced antioxidant capacity.
Results
To determine whether ischemia induces peroxisomal proliferation in brain in vivo, anesthetized mice were subjected to 1-h focal cerebral ischemia induced by MCAO (using the intraluminal filament occlusion method) or sham surgery. At 3, 12, and 24 h after MCAO, mice were anesthetized, perfusion fixed, and brains were removed, sectioned, and processed for immunohistochemistry with an antibody against peroxisomal membrane protein 70 (PMP70). The secondary antibody was labeled with Cy2 (green in Figs. 1 and 3), and visualized on a Zeiss 710 LSM laser-scanning confocal microscope. Sections were costained with an antibody against microtubule-associated protein 2 (MAP2), a well-documented early and sensitive marker of neuronal injury (labeled with Cy3; red florescence in Figs. 1 and 3), to delineate infarct boundaries (infarct areas outlined in Fig. 1A with yellow dotted lines). Indeed, Figure 1A shows that loss of MAP2 immunoreactivity faithfully depicts areas of infarction, as identified by 2,3,5-triphenyltetrazolium chloride (TTC) staining at 24 h after MCAO (lower panel). The figure also shows that PMP70 immunoreactivity is increased in the peri-infarct region (white arrowheads, Fig. 1A), and decreased in regions with reduced MAP2 staining.
FIG. 1.

Macroscopic peroxisome dynamics after ischemia. (A) Representative images taken after sham surgery or after 1-h middle cerebral artery occlusion (MCAO) at 3, 12, or 24 h of reperfusion. Brain slices were labeled with microtubule-associated protein 2 (MAP2) (red in merge) and peroxisome marker peroxisomal membrane protein 70 (PMP70) (green in merge). Separate brains were labeled with 2,3,5-triphenyltetrazolium chloride (TTC) to show regions of ischemic damage (white). The developing infarct zone is outlined with a yellow dotted line. Yellow arrows point to incomplete infarction at 12 h, as indicated by retention of MAP2 labeling. Development of edema in the ipsilateral side can be seen by the narrowing of ventricular space (white star). Starting at 12 h of reperfusion, there is an increase in PMP70 in the ipsilateral cortical penumbra compared with the contralateral side (white arrowhead). White scale bar is 1 mm. (B) Same brain image from (A) at higher magnification with highlighted cortical section. Three fields of view (small squares) were imaged from the contralateral, peri-infarct, and ischemic core with a high-resolution deconvolution microscope. White scale bar is 1 mm. To see this illustration in color, the reader is referred to the web version of this article at www.liebertpub.com/ars
FIG. 3.

Ultrastructural characterization of peroxisomal morphology in ischemic brain. Transmission electron microscopy (EM) of mouse cerebral cortex at 24 h after MCAO after staining with 3,3′-diaminobenzidine. Black/yellow arrows point to peroxisomes. Upper images are from sham animals and contralateral cortex; lower images from ischemic core and peri-infarct region. N: nucleus, m: mitochondria; dotted yellow line is plasma membrane. Details in the lower images are enlarged in insets to show vacuoles (“v”) attached to swollen peroxisomes. To see this illustration in color, the reader is referred to the web version of this article at www.liebertpub.com/ars
To quantify peroxisomal changes in the ischemia injured brain over time, we used the IMARIS software to measure peroxisomal volume density within infarct core, peri-infarct region, and contralateral cerebral cortex at 3, 12, and 24 h after MCAO. Volumes occupied by peroxisomes (voxels) were measured in three predetermined areas (each representing one visual field using 60× objective) at each side of the cortical peri-infarct boundary (dotted line in Fig. 1B) and in the corresponding contralateral cerebral cortex. The peri-infarct boundaries were identified by MAP2 staining of 6-μm coronal sections selected at 1-mm intervals throughout the brain (the three areas where peroxisomes were evaluated in the peri-infarct region are illustrated by white squares in Fig. 1B). Confocal images representing the middle 2 μm of slice thickness (z-stack) were acquired in each one of three adjacent brain slices.
Therefore, each data point in Figure 2 represents an average of nine measurements (three small squares in Fig. 1B in three adjacent coronal brain slices separated by 1-mm intervals) for each one of three regions (ischemic core, peri-infarct, and contralateral) and at each time point (3, 12, and 24 h after MCAO, n=5–7 at each time point). As indicated by PMP70 staining (white dots in Fig. 2A), the peri-infarct region had a higher density of peroxisomes, while peroxisomes in ischemic core and contralateral cortex are relatively sparse. Quantitative analysis presented in Figure 2B demonstrates that peroxisomal volume density in the contralateral side is comparable to that seen in the sham brain over a 24-h period (Fig. 2B, left graph). However, peroxisome volume density increased in the peri-infarct compared with the contralateral cortex after MCAO. The increase started at 12 h and continued to reach a statistically significant increase at 24 of reperfusion (Fig. 2B, middle graph; p<0.05). Changes in peroxisome volume density in the ischemic core were not statistically significant at any time point (Fig. 2B, right graph). The increase in peroxisome volume density was primarily attributed to an increase in size (volume per peroxisome; data not shown), suggesting peroxisomal biogenesis.
FIG. 2.

Dynamic changes in peroxisome morphology after ischemia. (A) 60× high-resolution raw images and surface renderings (IMARIS) used in calculating peroxisome volumes in the contralateral, peri-infarct, and ischemic core. Scale bar: 1 mm. (B) Quantification of peroxisome volume densities in sham (S), contralateral, peri-infarct, and ischemic core. Each data point represents an average of nine measurements (three small squares in Fig. 1B in three adjacent coronal brain slices separated by 1-mm intervals) for each one of three regions (ischemic core, peri-infarct, and contralateral) and each time point (3, 12, and 24 h after MCAO). Each of the three coronal slices is 6-μm thick, but data were collected from the middle 2 μm (z-stack). *A statistically significant difference compared with 3 and 12 h by one-way analysis of variance (ANOVA). Number of animals for each group and time point was between 5 and 7.
These dynamic changes in peroxisomes have not previously been seen in the brain or any ischemic tissue; therefore, we further investigated peroxisomal biogenesis using super-resolution structured illumination microscopy (SR-SIM) (29) and EM. Supplementary Figure S1A and B (Supplementary Data are available online at www.liebertpub.com/ars) depict low-magnification images of two coronal brain slices, one from a sham animal (Supplementary Fig. S1A) and one taken at 24 h after MCAO (Supplementary Fig. S1B) to show the sites where ultrastructural, high-resolution (SR-SIM and EM) images were taken (yellow rectangles). The yellow line in Supplementary Figure S1B delineates the infarcted region and separates the ischemic core from the peri-infarct region. Supplementary Figure S1C shows SR-SIM images of neurons within the peri-infarct (left) and contralateral (upper) regions after double immunofluorescent labeling with neuronal marker MAP2 (red) and the peroxisomal marker PMP70 (green). The SR-SIM images show that peroxisomes in the peri-infarct region undergo changes in size and morphology consistent with biogenesis. Figure 3 shows representative EM images from different brain regions after cytochemical staining using the alkaline 3,3′-diaminobenzidine (DAB) method, which labels peroxisomes based on the peroxidase activity of peroxisomal catalase (13). The images show that peroxisomes from sham animals (upper left) are small, round with regular boundaries, and a relatively low signal intensity (yellow/black arrows). At 24 h after MCAO, peroxisomal morphology does not seem to be altered in the contralateral cortex (upper right). In contrast, in the peri-infarct region (lower right), peroxisomes are enlarged and fused, with evidence of budding, suggestive of peroxisomal biogenesis. Finally, in the ischemic core, peroxisomes are large, swollen, irregular in shape, with vacuoles attached to their membranes (enlarged images in insets), suggestive of peroxisomal autophagy (Fig. 3, autophagic vacuoles, “v”).
To determine whether changes in peroxisome morphology and density were associated with changes in antioxidant enzyme content, we used Western blot to examine protein expression of catalase, a major peroxisomal antioxidant enzyme. Catalase expression was higher in the peri-infarct region at 24 h after MCAO compared with the contralateral cerebral cortex (Fig. 4, n=4, p<0.05). Catalase expression in the ischemic core was reduced compared with the contralateral cerebral cortex (data not shown).
FIG. 4.
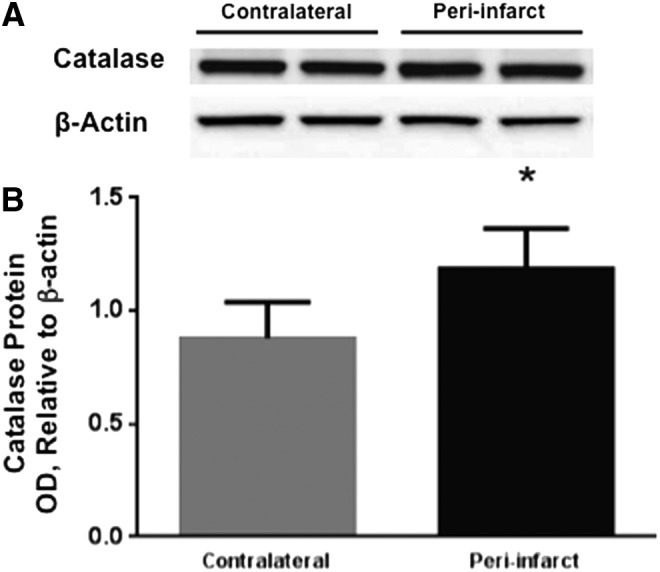
Increased catalase protein expression in peri-infarct cortex in postischemic mouse brain. (A) Representative image of catalase Western blot from the contralateral and peri-infarct cerebral cortex at 24 h of reperfusion, along with beta-actin bands. (B) Quantification of Western blot bands shows that catalase expression was increased in peri-infarct compared with the contralateral cerebral cortex at 24 h after MCAO (*p<0.05, n=4).
Next, we determined whether similar changes in peroxisomes take place in primary cultured neurons in response to ischemic injury induced in vitro by OGD. Figure 5 confirms in primary cultured neurons the observation made in vivo in Figures 1–3 that ischemia induces peroxisomal biogenesis in neurons. Specifically, Figure 5A depicts PMP70 immunoreactivity in primary cultured cortical neurons both at baseline and after OGD. The images illustrate the increase in volume density at 3 h after OGD, before neuronal cell death can be detected. Quantification of peroxisome volume density in seven independent cultures demonstrated a 38% increase after 3 h of OGD compared with control cultures (n=7, p<0.05). To determine whether peroxisomal biogenesis plays a protective role against OGD-induced cell death by increasing catalase activity, we used the catalase inhibitor 3-amino-1,2,4-triazole (ATZ) (21). Figure 6 shows that ATZ induces cell death in cultured neurons at baseline, and exacerbates OGD-induced cell death, suggesting that catalase plays an important role in neuronal survival both at baseline and after OGD. To confirm the protective role of peroxisomal biogenesis in neuronal survival after OGD, we knocked down Drp1, which is necessary for peroxisomal division (fission). We infected primary neurons with lentiviral vectors harboring either a short hairpin RNA (shRNA) against Drp1 (shRNA Drp1-1 or Drp1-2) or a nontargeting sequence, as a negative control. Figure 7 shows that cultures infected with lentivirus expressing Drp1 shRNA, indeed, have less, albeit larger peroxisomes. Specifically, Figure 7A validates Drp1 knockdown by showing that two independent Drp1 shRNA constructs (Drp1-1 and -2) reduce Drp1 protein expression. Figure 7B shows that peroxisomes are larger, more elongated, and fused in cultures infected with Drp1-1 shRNA compared with cultures expressing a nontargeting control shRNA. These parameters are quantified in Figure 7C, which demonstrates that Drp1 knockdown decreases the number of peroxisomes and their sphericity index, yet increases the size of individual peroxisomes (data presented only for Drp1-1 shRNA, but both constructs were equally effective). Furthermore, Figure 7D shows that Drp1-1 and Drp1-2 shRNA had no effect on basal survival of primary neurons. However, neuronal cell death at 24 h after OGD was increased by 46% and 37% in cultures treated with Drp1-1 and Drp1-2 shRNA, respectively, compared with cultures treated with control shRNA (Fig. 7E, n=6, p<0.05). Finally, to further confirm that peroxisomes play a neuroprotective role, we induced peroxisomal proliferation pharmacologically using PPARα agonist clofibrate. Figure 8A and B show that clofibrate increases peroxisome number, and protects primary cultured neurons from ODG-induced cell death (Fig. 8C, n=8, p<0.05).
FIG. 5.

Peroxisomal proliferation in primary mouse cultured cortical neurons after oxygen glucose deprivation (OGD). (A) Neurons were subjected to 2 h of OGD; peroxisomes were identified by immunofluorescent staining for peroxisomal protein 70 (PMP70, green) and nuclei stained with DAPI (blue). Images were taken in z-stack at 60×magnification. Scale bar is 5 μm. (B) Quantification revealed a 38% increase in peroxisomal volume density after OGD (n=7 separate cultures, p<0.05). To see this illustration in color, the reader is referred to the web version of this article at www.liebertpub.com/ars
FIG. 6.

Catalase inhibition exacerbates OGD-induced neuronal cell death. The catalase inhibitor 3-amino-1,2,4-triazole (ATZ, 40 mM) reduces neuronal survival under baseline condition and exacerbates neuronal cell death at 24 h after OGD (n=5, *p<0.05).
FIG. 7.

Knockdown of dynamin-related protein 1 (Drp1) exacerbates neuronal death after OGD. (A) Lentiviral vector-mediated knockdown of Drp1 using two independent short hairpin RNA (shRNA) constructs (Drp1-1 and 1-2) reduces Drp1 protein in primary neurons. (B, C) Drp1 knockdown inhibits peroxisomal fission. Confocal immunofluorescence of primary mouse cultured cortical neurons on day 10 in vitro, 3 days after infection with lentivirus carrying either Drp1-1 shRNA (right panel) or nontargeting control vector (left). Peroxisomes were identified by PMP70 immunostaining, followed by Cy3. Scale bar is 5 μm (B). Quantification of the effect of Drp1 knockdown on size and number of peroxisomes. By inhibiting their division, Drp1 knockdown with Drp1-1 shRNA decreases peroxisome number but leads to larger, tubular, and elongated peroxisomes (C, increased size with reduced sphericity). (D) Drp1 knockdown had no effect on basal survival of primary neurons (n=6, p>0.05). (E) Drp1 knockdown increases OGD-induced neuronal death (n=6, *p<0.05). Primary cultured cortical neurons were infected on day 7 in vitro with virus containing Drp1-1, Drp1-2, or nontarget shRNA. Cells were subjected to 2 h of OGD on day 10 in vitro. Cell survival was measured based on calcein-AM uptake fluorescence. To see this illustration in color, the reader is referred to the web version of this article at www.liebertpub.com/ars
FIG. 8.

Peroxisome proliferator-activated receptor-alpha agonist clofibrate increases peroxisomal proliferation and protects against OGD-induced neuronal cell death. (A) High-resolution images of primary cortical neurons treated with vehicle (left panel) or clofibrate (right panel). Peroxisomes were identified by PMP70 immunostaining, followed by Cy3 (red). Cells were counter-stained with DAPI. Scale bar is 5 μm. (B) Quantification of PMP70 immunoreactivity shows that clofibrate increases peroxisome number in primary neurons. *p<0.05 compared with vehicle-treated neurons. (C) Clofibrate decreases OGD-induced neuronal cell death (n=8, *p<0.05). Cell death was measured using the lactate dehydrogenase assay. To see this illustration in color, the reader is referred to the web version of this article at www.liebertpub.com/ars
Discussion
We have observed dynamic changes in peroxisome morphology in neurons after ischemia both in vitro and in vivo. Morphological changes in peroxisomes were consistent with their biogenesis, and were associated with increased catalase expression. Inhibiting catalase or preventing peroxisomal fission by Drp1 knockdown exacerbated OGD-induced cell death, whereas enhancing peroxisomal proliferation using a PPARα agonist reduced OGD-induced cell death. Our findings suggest that peroxisomal biogenesis plays a protective role against ischemic cell death in neurons.
This is the first observation of a peroxisomal response in the brain to ischemia, and to our knowledge, the first to describe changes in peroxisomal dynamics in neurons. Work in yeast has demonstrated that peroxisomes are highly adaptable organelles that change their number, size, and morphology in response to the changing environment (31). In yeast, two stimuli have been described that induce similar changes to those observed in our study in neurons: (i) oxidative stress, for example, in response to H2O2, where the peroxisomal response may reflect their antioxidant function, primarily attributed to catalase, and is meant to increase the neurons' antioxidant capacity; (ii) a switch in fuel source from a glucose-containing medium to that containing fatty acids, where the peroxisomal response can be attributed to their fatty acid metabolic function, and is meant to increase beta-oxidation enzymes and function.
Our data is consistent with the first scenario, by which peroxisomes enlarge and proliferate in response to oxidative stress during cerebral ischemia, although we cannot exclude an additional role for an adaptive increase in beta-oxidation to handle the switch to fatty acids as a fuel source in the absence of glucose during ischemia. Irrespective of the reason, peroxisomal proliferation seems to play a protective function. This conclusion is based on at least five observations: (i) data showing that catalase expression is increased in areas where peroxisome density is increased, (ii) the fact that peroxisome volume density is increased in the peri-infarct region, where neurons are still viable, compared with the ischemic core, where neurons are irreversibly injured, (iii) that peroxisomes are increased at an early time point (e.g., 3 h) after OGD and before neuronal cell death is complete, (iv) catalase inhibition exacerbates OGD-induced neuronal cell death, and (v) preventing peroxisomal proliferation by Drp1 knockdown exacerbates OGD-induced neuronal cell death, whereas enhancing peroxisome biogenesis by clofibrate protects against OGD-induced neuronal cell death. One limitation to the last point is that Drp1 is a master regulator of organelle fission, including mitochondria, not exclusive to peroxisomal fission (9). However, the current view of organelle fission, especially after such an intense and all-encompassing stress such as cerebral ischemia, is that it is a part of a global cellular response to ischemia, with common regulators for all organelles (20, 22), making it difficult to study each organelle in isolation.
Peroxisomes are small, single-membrane organelles found in almost every eukaryotic cell. They are spherical or oval in shape with a diameter of 0.5–1.0 μm filled with an electron-dense granular matrix (2). Peroxisomes were discovered only in 1954, and not until recently, we have begun to appreciate their role in normal development and growth, mainly attributed to the recognition that their deficiencies lead to severe and often fatal inherited disorders in humans (30, 31). They are now known to be essential to many vital cellular functions; at least three functions are relevant to ischemic neural injury: (i) oxygen-free radical scavenging (2, 6), (ii) long-chain fatty acid metabolism (β-oxidation) (31, 32), and (iii) biosynthesis of ether lipids, essential components of myelin (17).
Our data suggest that cerebral ischemia also induces peroxisomal proliferation in the brain, which not only may serve as an endogenous neuroprotective mechanism aimed at handling oxidative stress, but also may serve as a mechanism to cope with metabolic stress and loss of nutrients, and to enhance resistance of axons to injury and promote their regeneration.
As illustrated in Figure 9, the number of peroxisomes is determined by their biogenesis (proliferation) and degradation (called peroxisomal autophagy or pexophagy). Similar to mitochondria, peroxisomes are self-replicating; they continue to grow until they divide. Under normal circumstances, the average life span of a peroxisome is approximately 2 days (18, 25). Our data suggest that the balance between peroxisomal biogenesis and pexophagy favors proliferation in the peri-infarct region, while in the ischemic core, autophagic mechanisms may prevail (as suggested by our EM data), although we have not investigated pexophagy in this study. The membrane material required for peroxisomal growth, division, and de novo synthesis is now believed to be obtained either from the endoplasmic reticulum or salvaged from degraded peroxisomes (1, 11, 15). Unlike mitochondria, peroxisomes do not have their own DNA and have to import their fully assembled, folded nuclear-encoded proteins (35). Transport of peroxisomal proteins is carried out by the shuttle proteins PEX5 and PEX7 (also called peroxins), which cycle to and from peroxisomes. PEX5 and PEX7 recognize and bind specific amino-acid (aa) sequences located on peroxisomal proteins, the so-called peroxisomal targeting signal (PTS) (14, 19). Two distinct signals for matrix proteins have been described: PTS1, a tripeptide (3 aa) with the consensus sequence (S/A/C)-(K/H/Q/R)-(L/M) located at the C-terminal end of the protein recognized by PEX5, and PTS2, a nonapeptide (11 aa) with the consensus sequence (R/K)-(L/I/V)-X5-(H/Q)-(L/A/F) located near the N-terminus of the protein, which is recognized by PEX7. Catalase has PTS1 at its C-terminal end and is transported to peroxisomes by PEX5 (26).
FIG. 9.

The life cycle of peroxisomes. Peroxisomes (P) undergo a cycle of formation (biogenesis) and degradation (pexophagy) every 1–2 days. Biogenesis starts with peroxisomal elongation, constriction, Drp1-mediated fission, proliferation, and growth. Bead-like small red circles surrounding constriction sites are Drp1 proteins. Pexophagy starts with an autophagosome (double-membrane red crescent shape structure) engulfing a persoxisome to sequester it, then fusing with a lysosome to complete its digestion. To see this illustration in color, the reader is referred to the web version of this article at www.liebertpub.com/ars
Our conclusion that peroxisomes play a protective role in cerebral ischemia is consistent with clinical and experimental evidence, pointing to the importance of peroxisomes in brain development and disease (5). This is highlighted by the fact that human genetic disorders affecting peroxisomal biogenesis (called peroxisome biogenesis disorders, PBDs, such as Zellweger syndrome) (36) cause severe neurological abnormalities that are often fatal (4). Furthermore, brain-specific gene knockout mouse models of peroxisomal proteins; for example, the peroxin PEX5 (17), exhibit defects in neuronal survival and migration, and suffer axonal degeneration and neuroinflammation (32). Our findings are also consistent with other reports showing that catalase inhibition exacerbates toxicity by amyloid-beta in neuronal NT-2 cell lines (21). Results are also consistent with reports showing that other PPARα agonists are protective against β-amyloid neurotoxicity (7, 28). Finally, the importance of peroxisomes in stroke is highlighted by the fact that agents that increase peroxisomal proliferation (PPAR agonists) are clinically under evaluation for the treatment of stroke risk factors and experimentally as potential neuroprotective agents (8, 23).
In conclusion, we found that peroxisomes undergo biogenesis in neurons after cerebral ischemia, which may serve as a protective mechanism against ischemic injury, and may potentially be targeted as a novel therapy for neuroprotection after stroke.
Materials and Methods
MCAO in mice
Transient focal cerebral ischemia was induced in young adult male C57/Black mice (20–30 g body weight, 2–3 months of age) using the intraluminal MCAO technique. Mice were anesthetized with isoflurane (1.5%–2% by face mask in O2-enriched air; fraction of inspired oxygen=0.34) and kept warm with water pads. A small laser-Doppler probe was affixed to skull to monitor cortical perfusion and verify vascular occlusion and reperfusion. A silicone-coated 6-0 nylon monofilament was advanced into the right internal carotid artery through an incision in the external carotid artery until laser-Doppler signal dropped to less than 30% of baseline. After securing the filament in place, the animal was kept on the surgical station at 1 h of occlusion. The occluding filament was withdrawn to allow reperfusion after 1 h of occlusion. Mice were then allowed to recover and sacrificed at 3, 12, or 24 h.
Immunohistochemistry and quantification of peroxisome morphology in brain slices
Brain tissue was perfused, embedded in paraffin, and cut into 6 μm sections. Brain sections were blocked with 4% normal goat serum, 1% bovine serum albumin, and 0.3% Triton. Brain slices were additionally blocked with M.O.M blocking kit (Vector Laboratories). Brain slices were then labeled for PMP70 (1:600; Abcam) and MAP2 (1:400; Millipore) and stained with Hoechst (1:5000; Life Technologies). The PMP70 signal was amplified using a biotinylated antibody (1:200) followed by a streptavidin-linked Cy2 secondary (1:600), while MAP2 was visualized with a Cy3-conjugated antibody (1:300).
For qualitative analysis of peroxisome staining, brain slices were imaged on a DM4000 epi-fluorescent microscope (Leica) or an LSM710 (laser scanning microscope) confocal microscope (Zeiss). For quantitative analysis of peroxisome morphology after ischemia, brain slices were acquired on a high-resolution wide-field Core DV system (Applied Precision™). This system is an Olympus IX71 inverted microscope with a proprietary XYZ stage and a solid-state module for fluorescence. The camera is a Nikon Coolsnap ES2 HQ. Three images each were obtained for the peri-infarct cortical region and the corresponding contralateral cortex. The boundary between positive and negative MAP2 staining was used to delineate the infarct from the peri-infarct region. Each image was acquired as z-stacks in a 1024×1024 format with a 60×1.42 NA PlanApo through the depth of the slice. Microscope settings were adjusted so that each image would have a maximum of 3000 arbitrary intensity units to ensure consistent imaging. The pixel size was 0.067, 0.067, and 0.200 (x, y, z) μm for each image. The images were deconvolved with the appropriate optical transfer function using an iterative algorithm of 10 iterations. The histogram was optimized for the most positive image and applied to all the other images for consistency before saving the images as a 24-bit merged TIFF. Deconvolved images were then processed and analyzed using IMARIS software (Bitplane). All images were cropped in the z-axis to have a depth of 2 μm. Afterward, a representative image was chosen to optimize the analysis settings in both the “volume” and “spots” software modules. All images were then subsequently batch analyzed using the same analysis settings. Three images from each brain region were averaged to obtain a single value for each animal.
Electron microscopy
Mice were deeply anesthetized with sodium pentobarbital (150 mg/kg) and were perfused transcardially through the ascending aorta with 5 ml of heparinized saline (1000 U/ml), followed by 10 ml of 4% paraformaldehyde/0.05% glutaraldehyde in 0.1 M phosphate buffer (PB), pH 7.4. Immediately after perfusion, brains were removed and blocks of tissue containing the region of interest were postfixed in 1.5% glutaraldehyde in 0.1 M PB for 15 min, then transferred to 0.1 M PB. Blocks of tissue were stabilized in agar and sectioned on a vibrating microtome (Leica Microsystems, Inc.) at 40 μm. Sections were collected in 0.1 M PB and treated in an alkaline DAB procedure, as previously described (12, 13). Briefly, sections were incubated for 45 min at 37°C in 1% DAB in Teo-Sten buffer, pH 10.5, and 0.15% H2O2, followed by sequential rinses in Teo-Sten buffer, 0.2 M citrate buffer, and 0.1 M PB. Tissue sections were then fixed for 15 min in 1% osmium tetroxide, dehydrated in an ethanol series, flat embedded in EMBed-812 (EMS, RT 14120) between two sheets of ACLAR plastic (EMS, 50425), and cured in a 60°C oven for 24–48 h. Regions of interest were identified by light microscopy, cut out of the aclar sheet, and glued section side down onto cured resin blocks. Ultrathin sections were cut at 75 nm on an ultramicrotome (Leica Microsystems, Inc.), picked up on copper grids, counterstained with uranyl acetate and Reynolds lead citrate, and examined in a FEI Tecnai 12 BioTwin electron microscope at 80 kV.
Western blot
Brain tissue was obtained from mice at either 3 or 24 h after MCAO. The peri-infarct cerebral cortices from both the injured and contralateral hemispheres were dissected and flash-frozen in 2-methylbutane on dry ice. Tissue was homogenized using a mechanized homogenizer (Pro Scientifc) in a buffer containing 250 mM sucrose, 60 mM KCl, 15 mM Tris-HCl, 15 mM NaCl, 5 mM EDTA, and 1 mM EGTA, in the presence of protease inhibitors (Roche Applied Science) and 0.5 mM phenylmethanesulfonyl fluoride (PMSF). Tissue homogenates were centrifuged at 2000 g followed by 17,000 g at 4°C to isolate the crude cytosolic fractions. Protein sample concentrations were determined using a BCA protein quantification Assay (Pierce Biotechnologies) and a Lambda 25 UV spectrophotometer (Perkin Elmer). Proteins were separated on a 4%–12% bis-tris acrylamide gel (Life Technologies) and blotted onto a PVDF membrane (Life Technologies). The membrane was incubated with a primary antibody against Catalase (Abcam) at a dilution of 1:1000 in 5% milk/PBS-T overnight at 4°C. Membranes were washed in PBS-T and incubated with HRP-linked secondary antibodies. Protein detection was achieved using detection reagents (Pierce Biotechnology), and images were taken and quantified using a Fluorchem FC2 imager (Protein Simple).
Mouse primary neuronal culture
Mouse primary neuronal cultures were generated from cortical tissue of embryonic mice at gestational day 16. Fetuses were harvested from pregnant female mice via cesarean section under deep isoflurane anesthesia. Cortical tissue was dissected, and neuronal cells were isolated after digestion with Papain (Worthington Biomedical Corp.) at a dilution of 1:100. Cell viability and count was determined via staining with Trypan Blue (Life Technologies). Cells were then plated on Poly-D-Lysine (Sigma Aldrich)-coated 24-well culture plates (Corning) or on coated 1.0 mm glass coverslips (Carolina Biological Supply Co.) at a density of 285,000 cells per well. Cells were maintained in Neurobasal media supplemented with B27, Penicillin/Streptomycin, and Glutamax (Life Technologies) at 37°C and 5% CO2 for 10 days.
OGD and cell viability assay
At day in vitro 10 (DIV 10), cultured neurons were washed with glucose-free Neurobasal A medium (Life Technologies), followed by complete replacement of the normal culture media with glucose-free Neurobasal A. Briefly, cells were placed in a humidified anoxia chamber (Coy Lab Products) at 37°C containing 90% N2, 5% CO2, and 5% H2. After 2 h of OGD, the glucose-free media was replaced with normal culture media. Baseline cultures were subjected to media change only, and remained in normoxic conditions (95% air plus 5% CO2) for the duration of the experiment. To investigate the effects of ATZ and clofibrate on neuronal survival, cells were pretreated with ATZ (40 mM; Sigma) or clofibrate (500 μM) overnight before OGD, and treatment continued throughout OGD and reoxygenation. Cells were returned to normoxia and normal feeding media for either 3 h for immunocytochemistry experiments or 24 h for cell death experiments. Cell death data in Figures 7 and 8 are based on calcein fluorescence, which was measured in an unbiased manner by an automated plate reader. Specifically, 24 h after OGD, cells were incubated with 2 μM Calcein-AM for 30 min at room temperature. Fluorescence was measured in a 3×3 grid in each well, for a total of 9 measurements per well and 3 replicates (27 total measurements per experimental condition) at an excitation wavelength of 485 nm and an emission wavelength at 535 nm with a Victor 3 microplate reader (Perkin Elmer). In each experimental round, the average fluorescence of a control plate (uninfected, without OGD) is designated as “100% Cell Survival” by which the other experimental groups were divided (post-OGD, infected with nontargeting, Drp1-1 or Drp1-2 shRNA) to generate “% Cell Survival.” To calculate “% Cell Death,” “% Cell Survival” is subtracted from 100%. Cell death was calculated by subtracting the cell viability percentage from 100. This assay has been validated against measurements of cell death using propidium iodide (PI) staining and lactate dehydrogenase (LDH) measurement in media, and cell viability was validated using the MTT [3-(4, 5-dimethylthiazol-2-yl)-2,5-diphenyltetrazolium bromide] assay. For PI staining, 0.75 μL of PI is added to each of a 24-well plate (3.75 μg/ml final concentration) and incubated at 37°C for 30 min. Cells are then examined under an inverted microscope, where dead cells are stained red (PI). For MTT assay, 50 μl MTT (5 mg/ml) is added to each well and cells are kept at 37°C under normoxia for 2 h. Media are then aspirated. The dark blue crystals of formazan, which are converted from MTT only in viable cells, are dissolved in 500 μl DMSO. The absorbance is measured at 570 nm. LDH release assay is performed as per the manual provided by the manufacturer (Sigma) using 50 μL of cell culture media. Results are normalized to maximum LDH release when all neurons are killed by triton.
PMP70 immunofluorescence in primary cultured neurons
Neuronal cells at DIV 10 cultured on glass coverslips were washed once with room temperature PBS (Life Technologies), and then fixed in 4% paraformaldehyde (Sigma Aldrich). Cells were repeatedly washed with PBS and then blocked with a blocking solution consisting of 5% serum (Jackson ImmunoResearch Laboratories, Inc.), 1% bovine serum albumin (Sigma Aldrich), 0.1% Triton X-100 (Sigma Aldrich), and 0.2% fish gelatin (Sigma Aldrich). For peroxisomal labeling, cells were incubated with primary antibody against PMP70 (Abcam) at a dilution of 1:600, followed by labeling with Cy-3 (Jackson ImmunoResearch Laboratories, Inc.). For nuclear labeling, cells were washed and labeled with Hoechst (Life Technologies) at a concentration of 1:5000. Coverslips were mounted onto slides using Fluormount G mounting medium (Thermo Fisher Scientific) and allowed to dry before imaging. The volume of peroxisomes was measured using the “volume” module of the image analysis software IMARIS (Bitplane). “Peroxisome Volume Density” was calculated by dividing the total volume of all peroxisomes (PMP70) by the volume of tissue represented by the micrographs.
Lentiviral vector-mediated DRP1 knockdown
The Drp1 shRNA lentivirus was purchased from Sigma (Clone ID: NM_152816.1-1101s1c1), and DNA constructs and lentivirus were produced following a previously published protocol (38, 40). All of the PCR cloned sequences in these vectors were confirmed by DNA sequence analysis. Cells were infected for 3 days in culture before OGD, immunocytochemistry, or Western blotting. Specifically, at DIV 7, mouse primary cortical neurons were infected with Drp1 shRNA lentivirus, a nontarget shRNA control vector, or vector expressing green fluorescent protein (10 multiplicity of infection, at a concentration of 4–6×10⁶ viral particles per ml). The effects of Drp1 knockdown on basal survival of neurons were examined at 3 days after infection by Western blotting.
Quantification of peroxisome morphology after DRP1 knockdown
Images were acquired on a Zeiss Elyra PS.1 system that reconstructs super-resolution images from a series of images acquired under spatially structured illumination. Images were processed for SIM reconstruction in Zen 2010D and Z-planes exported as tiff images. Ten images from two independent cultures were treated with either a control virus or a DRP Knockdown virus. Images were analyzed for number of peroxisomes, volume of peroxisomes, and sphericity of peroxisomes with IMARIS (Bitplane). Peroxisome volume and sphericity were measured using surface rendering based on PMP70 immunofluorescence (IMARIS; Bitplane). To calculate the number of peroxisomes, the “spots” software module was used to count the number of peroxisomes in each field of view throughout the depth of the neurons (z-stack) within that field. The volume in which peroxisomes were counted was similar between “non-targeting” and “Drp1-1 shRNA” groups. “Volume per peroxisome” is the average volume of an individual peroxisome, which is calculated by dividing the total volume of peroxisomes by the number of peroxisomes.
Statistical analysis
Data were presented as mean±SEM. Statistical analysis was performed using Prism 6.0 software (GraphPad Software). One-way analysis of variance (ANOVA), followed by Tukey's post hoc test, was used to evaluate changes in peroxisomal volume density at different times (3, 12, and 24 h) after MCAO, and in evaluating effects of different viral constructs (control, Drp1-1, and Drp1-2) on OGD-induced neuronal cell death. Unpaired t-test was used to evaluate differences in catalase levels between ischemic and contralateral hemispheres in vivo, differences in peroxisome volume density between OGD and baseline (control) neurons in vitro, and to evaluate the effects of clofibrate and Drp1 knockdown on peroxisome morphology and number. Effects of clofibrate versus vehicle on OGD-induced cell death were tested in paired cultures (matched-pair cultures prepared from the same mouse pups, split into two, and simultaneously treated with drug or vehicle and then subjected to OGD in the same chamber simultaneously), and, therefore, were evaluated with a paired t-test. Two-way ANOVA, followed by Holm–Sidak's multiple-comparisons test, was used to evaluate the effects of ATZ or vehicle on baseline versus OGD-induced cell death. Differences were considered significant at p<0.05.
Supplementary Material
Abbreviations Used
- ATZ
3-amino-1,2,4-triazole
- DAB
3,3′-diaminobenzidine
- DIV
days in vitro
- Drp1
dynamin-related protein 1
- EM
electron microscopy
- H2O2
hydrogen peroxide
- LDH
lactate dehydrogenase
- MAP2
microtubule-associated protein 2
- MCAO
middle cerebral artery occlusion
- OGD
oxygen-glucose deprivation
- PI
propidium iodide
- PMP70
peroxisomal membrane protein 70
- PPAR
peroxisome proliferator-activated receptor
- PTS
peroxisomal targeting signal
- shRNA
short hairpin RNA
- SOD
superoxide dismutase
- SR-SIM
super-resolution structured illumination microscopy
- TTC
2,3,5-triphenyltetrazolium chloride
Acknowledgments
This work was supported by National Institutes of Health grant R01 NS44313 (N.J.A.), R01 NS35533 (R.S.M.), and P30 NS061800 (Aicher SA, PI) and NINDS Institutional Center Core Grant to support the viral core facility in the Neuroproteomics Center at the University of Washington (NS055088). The authors thank Drs. Sue Aicher, Robert Kayton, and James Huang for assistance with immunocytochemistry and electron microscopy. They also wish to acknowledge Aurelie Snyder and the Advanced Light Microscopy Core at The Jungers Center for technical assistance. The project described was supported by Shared Instrumentation Grant Number S10-RR023432 from the National Center for Research Resources (NCRR), a component of the National Institutes of Health (NIH), and its contents are solely the responsibility of the authors and do not necessarily represent the official view of NCRR or NIH. The authors would like to thank Professor H. Dariush Fahimi, Department of Anatomy and Cell Biology, University of Heidelberg, Germany, for his help in interpreting the EM images. Elena Varlamov, MD, and Madeline Churchill, BSc, assisted in the image analysis.
Author Disclosure Statement
No competing financial interests exist.
References
- 1.Agrawal G. and Subramani S. Emerging role of the endoplasmic reticulum in peroxisome biogenesis. Front Physiol 4: 286, 2013 [DOI] [PMC free article] [PubMed] [Google Scholar]
- 2.Antonenkov V, Grunau S, Ohlmeier S, and Hiltunen K. Peroxisomes are oxidative organelles. Antioxid Redox Signal 13: 525–537, 2010 [DOI] [PubMed] [Google Scholar]
- 3.Asayama K, Sandhir R, Sheikh FG, Hayashibe H, Nakane T, and Singh I. Increased peroxisomal fatty acid beta-oxidation and enhanced expression of peroxisome proliferator-activated receptor-alpha in diabetic rat liver. Mol Cell Biochem 194: 227–234, 1999 [DOI] [PubMed] [Google Scholar]
- 4.Baes M. and Aubourg P. Peroxisomes, myelination, and axonal integrity in the CNS. Neuroscientist 15: 367–379, 2009 [DOI] [PubMed] [Google Scholar]
- 5.Barry DS. and O'Keeffe GW. Peroxisomes: the neuropathological consequences of peroxisomal dysfunction in the developing brain. Int J Biochem Cell Biol 45: 2012–2015, 2013 [DOI] [PubMed] [Google Scholar]
- 6.Bonekamp NA, Völkl A, Fahimi HD, and Schrader M. Reactive oxygen species and peroxisomes: struggling for balance. Biofactors 35: 346–355, 2009 [DOI] [PubMed] [Google Scholar]
- 7.Cimini A, Benedetti E, D'Angelo B, Cristiano L, Falone S, Di Loreto S, Amicarelli F, and Cerù MP. Neuronal response of peroxisomal and peroxisome-related proteins to chronic and acute Abeta injury. Curr Alzheimer Res 6: 238–251, 2009 [DOI] [PubMed] [Google Scholar]
- 8.Collino M, Patel NS, and Thiemermann C. PPARs as new therapeutic targets for the treatment of cerebral ischemia/reperfusion injury. Ther Adv Cardiovasc Dis 2: 179–197, 2008 [DOI] [PubMed] [Google Scholar]
- 9.Delille HK, Alves R, and Schrader M. Biogenesis of peroxisomes and mitochondria: linked by division. Histochem Cell Biol 131: 441–446, 2009 [DOI] [PubMed] [Google Scholar]
- 10.Dunn WA, Jr., Cregg JM, Kiel JA, van der Klei IJ, Oku M, Sakai Y, Sibirny AA, Stasyk OV, and Veenhuis M. Pexophagy: the selective autophagy of peroxisomes. Autophagy 1: 75–83, 2005 [DOI] [PubMed] [Google Scholar]
- 11.Fagarasanu A, Fagarasanu M, and Rachubinski RA. Maintaining peroxisome populations: a story of division and inheritance. Annu Rev Cell Dev Biol 23: 321–344, 2007 [DOI] [PubMed] [Google Scholar]
- 12.Fahimi HD. Fine structural localization of peroxidatic activity of catalase. In. Techniques of Biochemical and Biophysical Morphology, Vol2, edited by Glick D, Rosenbaum H. New York, John Wiley, 1975, pp. 197–245 [Google Scholar]
- 13.Fahimi HD. Peroxisomes: 40 years of histochemical staining, personal reminiscences. Histochem Cell Biol 131: 437–440, 2009 [DOI] [PubMed] [Google Scholar]
- 14.Hasan S, Platta HW, and Erdmann R. Import of proteins into the peroxisomal matrix. Front Physiol 4: 261, 2013 [DOI] [PMC free article] [PubMed] [Google Scholar]
- 15.Hettema EH. and Motley AM. How peroxisomes multiply. J Cell Sci 122(Pt 14): 2331–2336, 2009 [DOI] [PMC free article] [PubMed] [Google Scholar]
- 16.Hu Y, Chen Y, Ding L, He X, Takahashi Y, Gao Y, Shen W, Cheng R, Chen Q, Qi X, Boulton ME, and Ma JX. Pathogenic role of diabetes-induced PPAR-α down-regulation in microvascular dysfunction. Proc Natl Acad Sci U S A 110: 15401–15406, 2013 [DOI] [PMC free article] [PubMed] [Google Scholar]
- 17.Hulshagen L, Krysko O, Bottelbergs A, Huyghe S, Klein R, Van Veldhoven PP, De Deyn PP, D'Hooge R, Hartmann D, and Baes M. Absence of functional peroxisomes from mouse CNS causes dysmyelination and axon degeneration. J Neurosci 28: 4015–4027, 2008 [DOI] [PMC free article] [PubMed] [Google Scholar]
- 18.Huybrechts SJ, Van Veldhoven PP, Brees C, Mannaerts GP, Los GV, and Fransen M. Peroxisome dynamics in cultured mammalian cells. Traffic 10: 1722–1733, 2009 [DOI] [PubMed] [Google Scholar]
- 19.Lanyon-Hogg T, Warriner SL, and Baker A. Getting a camel through the eye of a needle: the import of folded proteins by peroxisomes. Biol Cell 102: 245–263, 2010 [DOI] [PubMed] [Google Scholar]
- 20.Mohanty A. and McBride HM. Emerging roles of mitochondria in the evolution, biogenesis, and function of peroxisomes. Front Physiol 4: 268, 2013 [DOI] [PMC free article] [PubMed] [Google Scholar]
- 21.Milton NG. Inhibition of catalase activity with 3-amino-triazole enhances the cytotoxicity of the Alzheimer's amyloid-beta peptide. Neurotoxicology 22: 767–774, 2001 [DOI] [PubMed] [Google Scholar]
- 22.Nordgren M. and Fransen M. Peroxisomal metabolism and oxidative stress. Biochimie 98: 56–62, 2014 [DOI] [PubMed] [Google Scholar]
- 23.Ouk T, Gautier S, Pétrault M, Montaigne D, Maréchal X, Masse I, Devedjian JC, Deplanque D, Bastide M, Nevière R, Duriez P, Staels B, Pasquier F, Leys D, and Bordet R. Effects of the PPAR-α agonist fenofibrate on acute and short-term consequences of brain ischemia. J Cereb Blood Flow Metab 34: 542–551, 2014 [DOI] [PMC free article] [PubMed] [Google Scholar]
- 24.Platta HW. and Erdmann R. Peroxisomal dynamics. Trends Cell Biol 17: 474–484, 2007 [DOI] [PubMed] [Google Scholar]
- 25.Poole B, Leighton F, and De Duve C. The synthesis and turnover of rat liver peroxisomes. II. Turnover of peroxisome proteins. J Cell Biol 41: 536–546, 1969 [DOI] [PMC free article] [PubMed] [Google Scholar]
- 26.Purdue PE. and Lazarow PB. Targeting of human catalase to peroxisomes is dependent upon a novel COOH-terminal peroxisomal targeting sequence. J Cell Biol 134: 849–862, 1996 [DOI] [PMC free article] [PubMed] [Google Scholar]
- 27.Sakai Y, Oku M, van der Klei IJ, and Kiel JA. Pexophagy: autophagic degradation of peroxisomes. Biochim Biophys Acta 1763: 1767–1775, 2006 [DOI] [PubMed] [Google Scholar]
- 28.Santos MJ, Quintanilla RA, Toro A, Grandy R, Dinamarca MC, Godoy JA, and Inestrosa NC. Peroxisomal proliferation protects from beta-amyloid neurodegeneration. J Biol Chem 280: 41057–41068, 2005 [DOI] [PubMed] [Google Scholar]
- 29.Schermelleh L, Carlton PM, Haase S, Shao L, Winoto L, Kner P, Burke B, Cardoso MC, Agard DA, Gustafsson MG, Leonhardt H, and Sedat JW. Subdiffraction multicolor imaging of the nuclear periphery with 3D structured illumination microscopy. Science 320: 1332, 2008 [DOI] [PMC free article] [PubMed] [Google Scholar]
- 30.Schlüter A, Real-Chicharro A, Gabaldón T, Sánchez-Jiménez F, and Pujol A. Peroxisome DB 2.0: an integrative view of the global peroxisomal metabolome. Nucleic Acids Res 38 (Database issue): D800–D805, 2010 [DOI] [PMC free article] [PubMed] [Google Scholar]
- 31.Schrader M. and Fahimi HD. Growth and division of peroxisomes. Int Rev Cytol 255: 237–290, 2006 [DOI] [PubMed] [Google Scholar]
- 32.Schrader M. and Fahimi HD. The peroxisome: still a mysterious organelle. Histochem Cell Biol 129: 421–440, 2008 [DOI] [PMC free article] [PubMed] [Google Scholar]
- 33.Schrader M, Wodopia R, and Fahimi HD. Induction of tubular peroxisomes by UV irradiation and reactive oxygen species in HepG2 cells. J Histochem Cytochem 47: 1141–1148, 1999 [DOI] [PubMed] [Google Scholar]
- 34.Smith JJ. and Aitchison JD. Regulation of peroxisome dynamics. Curr Opin Cell Biol 21: 119–126, 2009 [DOI] [PMC free article] [PubMed] [Google Scholar]
- 35.Smith MD. and Schnell DJ. Peroxisomal protein import. the paradigm shifts. Cell 105: 293–296, 2001 [DOI] [PubMed] [Google Scholar]
- 36.Steinberg SJ, Dodt G, Raymond GV, Braverman NE, Moser AB, and Moser HW. Peroxisome biogenesis disorders. Biochim Biophys Acta 1763: 1733–1748, 2006 [DOI] [PubMed] [Google Scholar]
- 37.Teoh NC, Williams J, Hartley J, Yu J, McCuskey RS, and Farrell GC. Short-term therapy with peroxisome proliferation-activator receptor-alpha agonist Wy-14,643 protects murine fatty liver against ischemia-reperfusion injury. Hepatology 51: 996–1006, 2010 [DOI] [PubMed] [Google Scholar]
- 38.Uo T, Dworzak J, Kinoshita C, Inman DM, Kinoshita Y, Horner PJ, and Morrison RS. Drp1 levels constitutively regulate mitochondrial dynamics and cell survival in cortical neurons. Exp Neurol 218: 274–285, 2009 [DOI] [PMC free article] [PubMed] [Google Scholar]
- 39.van der Valk P, Gille JJ, Oostra AB, Roubos EW, Sminia T, and Joenje H. Characterization of an oxygen-tolerant cell line derived from Chinese hamster ovary. Antioxygenic enzyme levels and ultrastructural morphometry of peroxisomes and mitochondria. Cell Tissue Res 239: 61–68, 1985 [DOI] [PubMed] [Google Scholar]
- 40.Wang DB, Garden GA, Kinoshita C, Wyles C, Babazadeh N, Sopher B, Kinoshita Y, and Morrison RS. Declines in Drp1 and parkin expression underlie DNA damage-induced changes in mitochondrial length and neuronal death. J Neurosci 33: 1357–1365, 2013 [DOI] [PMC free article] [PubMed] [Google Scholar]
- 41.Yokota S. and Asayama K. Proliferation of myocardial peroxisomes in experimental rat diabetes: a biochemical and immunocytochemical study. Virchows Arch B Cell Pathol Incl Mol Pathol 63: 43–49, 1992 [DOI] [PubMed] [Google Scholar]
Associated Data
This section collects any data citations, data availability statements, or supplementary materials included in this article.