

Abstract
Trichloroethylene (TCE) is a well-known environmental and occupational toxicant that is classified as carcinogenic to humans based on the epidemiological evidence of an association with higher risk of renal cell carcinoma. A number of scientific issues critical for assessing human health risks from TCE remain unresolved, such as the amount of kidney-toxic glutathione conjugation metabolites formed, inter-species and -individual differences, and the mode of action for kidney carcinogenicity. We hypothesized that TCE metabolite levels in the kidney are associated with kidney-specific toxicity. Oral dosing with TCE was conducted in sub-acute (600 mg/kg/d; 5 days; 7 inbred mouse strains) and sub-chronic (100 or 400 mg/kg/d; 1, 2, or 4 weeks; 2 inbred mouse strains) designs. We evaluated the quantitative relationship between strain-, dose-, and time-dependent formation of TCE metabolites from cytochrome P450-mediated oxidation [trichloroacetic acid (TCA), dichloroacetic acid (DCA), and trichloroethanol] and glutathione conjugation [S-(1,2-dichlorovinyl)-L-cysteine and S-(1,2-dichlorovinyl)glutathione], and various kidney toxicity phenotypes. In sub-acute study, we observed inter-strain differences in TCE metabolite levels in the kidney. In addition, we found that in several strains kidney-specific effects of TCE included induction of peroxisome proliferator-marker genes Cyp4a10 and Acox1, increased cell proliferation, and expression of KIM-1, a marker of tubular damage and regeneration. In sub-chronic study, peroxisome proliferator-marker gene induction and kidney toxicity diminished while cell proliferative response was elevated in a dose-dependent manner in NZW/LacJ, but not C57BL/6J mice. Overall, we show that TCE metabolite levels in the kidney are associated with kidney-specific toxicity and that these effects are strain-dependent.
Introduction
Trichloroethylene (TCE) is classified as ‘group 1 carcinogen’ by IARC (Guha et al. 2012) and as ‘carcinogenic to humans’ by the U.S. EPA (Chiu et al. 2013). These cancer classifications relied on human epidemiologic evidence linking exposures to TCE with renal cell carcinoma (Karami et al. 2012; Scott and Jinot 2011). In addition, the mutagenic mode-of-action (MoA) provides the biological plausibility to the human epidemiological findings (U.S. EPA 2011). The mechanistic and animal data that strengthens human evidence for the increased risk of renal cell carcinoma associated with exposures to TCE includes observations of an increase in kidney cancer incidence in male rats (National Toxicology Program 1988; National Toxicology Program 1990), qualitative similarities in TCE metabolism between rodents and humans (Chiu et al. 2006), genotoxic and mutagenic properties of glutathione (GSH)-conjugated metabolites of TCE (Moore and Harrington-Brock 2000), and nephrotoxicity observed in mice treated with GSH conjugation metabolites (Shirai et al. 2012). Overall, evidence suggests that S-(1,2-dichlorovinyl)-L-cysteine (DCVC), or its downstream reactive electrophile metabolites, may be responsible for kidney tumors in humans by a mutagenic MoA, as well as an MoA that involves cytotoxicity and compensatory cell proliferation (Rusyn et al. 2014).
The key role for GSH conjugation-derived TCE metabolites in the kidney effects of this toxicant is also supported by several mechanistic studies in humans. These include observation of a certain VHL tumor suppressor gene mutation pattern in TCE-exposed renal cell carcinoma cases (Brauch et al. 1999), an association between polymorphisms of GSTM1/GSTT1 and risk of renal cell cancer among workers exposed to TCE (Bruning et al. 1997), and detection of S-(1,2-dichlorovinyl)glutathione (DCVG), a precursor of DCVC (Lash et al. 2014), in the blood of humans exposed to TCE (Lash et al. 1999). However, there are still many unresolved issues and uncertainties that reduce the confidence in these inferences. First, it is still debated whether or not the VHL mutation is an early event leading to TCE carcinogenesis. Induction of VHL mutation by TCE or its metabolites has not been experimentally demonstrated (Mally et al. 2006), and the association between VHL mutation and TCE exposure was not reproduced in similar human studies (Charbotel et al. 2007; Moore et al. 2011). Although additional evidence that the P81S missense mutation in VHL can mediate tumor growth was reported (Desimone et al. 2013), the relevance of VHL to the mechanisms of TCE carcinogenesis remains unclear.
A number of non-genotoxic mechanisms have been suggested as playing a role in TCE-associated kidney cancer, but they lack evidence as strong as that for genotoxicity and mutagenicity of GSH conjugation metabolites of TCE. Proposed non-genotoxic mechanistic events include α2u-globulin-associated nephropathy, cytotoxicity not associated with α2u-globulin-associated nephropathy, and peroxisome proliferator-activated receptor alpha (PPARα) activation (Rusyn et al. 2014). In addition, there is very limited data regarding the formation of GSH conjugation metabolites of TCE in tissues. Quantification of the metabolites is crucial not only for the toxicokinetic model-based extrapolation from rodents to humans, but also for addressing tissue/gender/species-specific toxicity of TCE. Metabolism is closely associated with the mode of action in TCE-induced cancer and non-cancer effects as it was noted that the “knowledge of TCE metabolism is critical for determining susceptibility, target organ specificity and gender and species differences” (National Research Council 2006).
In this study, we tested a hypothesis that levels of GSH conjugation metabolites of TCE in the kidney are associated with kidney-specific toxicity in mice by evaluating the quantitative relationship between strain-, dose-, and time-dependent formation of DCVG and DCVC, as well as various kidney toxicity phenotypes, in a panel of mouse inbred strains.
Materials and Methods
Animals and treatments
Male mice (aged 6–7 weeks) were purchased from the Jackson Laboratory (Bar Harbor, ME) and housed in polycarbonate cages on Sani-Chips (P.J. Murphy Forest Products Corp., Montville, NJ) irradiated hardwood bedding. Animals were fed NTP-2000 (Zeigler Brothers, Inc., Gardners, PA) wafer diet and water ad libitum on a 12 h light-dark cycle. All studies were approved by the UNC Institutional Animal Care and Use Committee.
Two study designs were utilized in this work. First, we performed a sub-acute study where vehicle (10 mL/kg, 5% Alkamuls EL-620 in saline) or TCE (600 mg/kg/d, in vehicle) was administered by gavage to mice from 7 inbred strains (129S1/SvImJ, A/J, BTBR T+tf/J, C57BL/6J, CAST/EiJ, NOD/ShiLtJ, and NZW/LacJ) for 5 consecutive days. These strains were selected to maximize inter-strain differences in metabolism of TCE based on the previous study of TCE metabolism in a panel of inbred strains (Bradford et al. 2011) and the results of the statistical modeling of the effect of time and strain on TCE metabolite concentrations which supports the sample size used in this study (Chiu et al. 2014). Second, based on the data from the sub-acute study, we selected two inbred strains (C57BL/6J and NZW/LacJ) that represented widely varying degrees of formation of oxidative metabolites of TCE for a subsequent sub-chronic study. Specifically, animals of each strain were randomly assigned to one of the three groups (5% Alkamuls EL-620 in saline vehicle, 100, or 400 mg/kg/day of TCE) and were dosed by oral gavage daily for 5 days/week for 1, 2, or 4 weeks.
In all studies, mice were given drinking water containing 0.2 g/L of 5-bromo-2′-deoxyuridine (BrdU) for 72 hrs prior to sacrifice. Blood, kidney and a section of a duodenum were collected 2 hrs after the last treatment. The timing of sacrifice was selected based on previous toxicokinetic studies of TCE in the mouse (Bradford et al. 2011; Kim et al. 2009b) showing that concentrations of both oxidative and glutathione conjugation metabolites of TCE peak around 2 hrs after dosing. Blood was drawn from vena cava and centrifuged to prepare serum using Z-gel tubes (Sarstedt, Germany) according to the manufacturer’s instructions. Blood urea nitrogen (BUN) and serum creatinine were quantified using QuantiChrom Urea Assay (BioAssay Systems, Hayward, CA) and Creatinine (serum) Colorimetric Assay Kit (Cayman Chemical, Ann Arbor, MI), respectively. Body and organ weights were recorded. Kidney and duodenum sections were fixed in neutral buffered formalin for 24 hrs, and the remainder of the kidney tissue was frozen in liquid nitrogen. All serum and tissue samples were stored at −80°C until analyzed.
Quantification of TCE metabolites
Concentrations of trichloroacetic acid (TCA), dichloroacetic acid (DCA), DCVC, and DCVG in kidney were determined using HPLC-ESI-MS/MS as detailed elsewhere (Kim et al. 2009a) with slight modifications. Quantification of trichloroethanol (TCOH) in kidney was performed using a method of (Song and Ho 2003). The configuration of the instruments was identical to that in the above mentioned references, but the extraction methods were optimized for each metabolite as follows.
TCA and DCA
Kidney samples (20 mg) were homogenized in 500 μL of 0.01 M PBS (pH 7.4) with 20 μL of internal standards (difluoroacetic acid and trifluoroacetic acid, 20 nmol/mL each) using Tissuelyser (Qiagen, Valencia, CA) for 1 min. The homogenates were filter-centrifuged (Amicon Ultra Centrifugal Filters 10K; Millipore) at 14,000×g for 1 hr. After the filtrate was acidified with 100 μL of 3% (v/v) sulfuric acid, 2 mL of diethyl ether was added, and solutions were vortexed vigorously for 1 min. The upper ether layer was transferred to another vial, reduced in volume to less than 300 μL under continuous stream of N2, then transferred to a glass vial insert containing 5 μL of double-distilled water and dried completely. The residue was reconstituted in 20 μL of HPLC mobile phase consisting of 70% acetonitrile, 30% 1 mM ammonium citrate in double-distilled water. The lower limit of quantification (LLOQ) was 0.02 nmol/g kidney for DCA and 5 nmol/g kidney for TCA.
DCVG and DCVC
Kidney tissue (50 mg) was homogenized in 500 μL of methanol with 20 μL of internal standards ([13C2,15N]DCVG and [13C3,15N]DCVC, 25 nmol/mL each) using Tissuelyser (Qiagen) for 1 min at 30/s. After adding 200 μL of chloroform, the homogenate was placed in shaker at 300 rpm for 10 min at 4°C, followed by centrifugation at 1,000×g for 5 min. The supernatant was then transferred to a new tube in which 200 μL of chloroform and 200 μL of water were added before centrifugation at 1,000×g for 5 min. From the upper aqueous phase, DCVG and DCVC were extracted using solid phase extraction (SPE) cartridge (StrataTM X-AW, 30mg 96-well plate; Phenomenex, Torrance, CA). After conditioning with 300 μL of methanol, followed by equilibration with 300 μL of water, the samples were loaded, washed with 300 μL of water, and finally eluted with 250 μL of basic methanol (pH adjusted at 10.8 by 29.1% NH4OH). The final eluent was collected into 300 μL glass vial inserts and dried in a Speed Vac Concentrator before reconstitution with 20 μL of 4:1 water/methanol containing 0.1% acetic acid. The LLOQ was 1 pmol/g kidney for DCVG and 10 pmol/g kidney for DCVC.
TCOH
Kidney tissue (30 mg) was homogenized in 500 μL of acetate buffer (pH 4.6) with 1,000 units of β-glucuronidase (cat. #G0751, Sigma, St. Louis, MO) using Tissuelyser (Qiagen) for 1 min, followed by overnight incubation at 37°C. After centrifugation at 14,000×g for 5 min, the supernatant was transferred to a new tube, then mixed with internal standard (DCA, 10 mM in methanol, 20 μL) and 550 μL of water/0.1 M sulfuric acid/methanol (6:5:1). The mixture was heated at 70°C for 20 min. After cooling to room temperature, 2.5 mL of hexane was added, the mixture was vortexed for 10 min and centrifuged at 2,500 g for 2 min. The upper layer was concentrated under N2 to less than 20 μL and used for GC-MS analysis as detailed in (Song and Ho 2003). The LLOQ for TCOH was 15 nmol/g kidney.
Gene expression analysis by real-time PCR
Total RNA was isolated from kidney samples using an RNeasy kit (Qiagen) according to the manufacturer’s instructions. RNA concentration and quality were determined using an ND-1000 spectrophotometer (Nanodrop Technologies, Wilmington, DE) and Agilent 2000 Bioanalyser, respectively. Total RNA was reverse transcribed using random primers and the high capacity complementary DNA archive kit (Applied Biosystems, Foster City, CA) according to the manufacturer’s protocol. The following gene expression assays (Applied Biosystems) were used for quantitative real-time PCR: peroxisome proliferator–activated receptor alpha (Pparα, Mm00440939_m1); palmitoyl acyl-Coenzyme A oxidase 1 (Acox1, Mm01246831_m1); cytochrome P450, family 4, subfamily a, polypeptide 10 (Cyp4a10, Mm01188913_g1); and beta glucuronidase (Gusb, Mm00446953_m1). Reactions were performed in a 96-well plate, and all samples were plated in duplicate using LightCycler® 480 instrument (Roche Applied Science, Indianapolis, IN). The cycle threshold (Ct) for each sample was determined from the linear region of the amplification plot. The ΔCt values for all genes relative to the control gene Gusb were determined. The ΔΔCt were calculated using treated group means relative to strain-matched control group means. Fold change data were calculated from the ΔΔCt values.
Determination of proximal tubule cell proliferation
Deparaffinized and rehydrated kidney sections were immersed in 4N HCl and subsequently pepsin solution (Dako, Carpinteria, CA) for antigen retrieval and then incubated in peroxidase blocking reagent (Dako). Dako EnVision System HRP kit was used for the detection of BrdU-incorporated nuclei (monoclonal anti-bromodeoxyuridine antibody, Dako, 1:200 dilution). Data were presented as a fraction of BrdU staining-positive nuclei in the tubular epithelium of the renal cortex (no fewer than 1,000 nuclei counted per a kidney section).
Determination of KIM-1 expression in kidney
Detection of KIM-1 was accomplished by modifying a published method (Humphreys et al. 2011). Formalin-fixed and paraffin-embedded kidney sections were deparaffinized and rehydrated. Antigens were retrieved by 4N HCl and pepsin solution (Dako) afterward. After peroxidase blocking, immunohistochemical detection was conducted using Dako Liquid DAB Substrate Chromogen System with primary anti KIM-1 antibody (2 ug/mL in PBS) (R&D Systems, Minneapolis, MN) and secondary goat IgG HRP-conjugated Antibody (1:100 in PBS) (R&D Systems). The proportion of positive-stained proximal tubules in outer medulla was determined under light microscopy. Data were presented as a fraction of proximal renal tubules staining positive for KIM-1 (no fewer than 200 proximal renal tubules counted per a kidney section).
Statistical analyses
The significance of inter-strain effect on metabolism was assessed by ANOVA modeling. Given the small sample size, the exact permutation test was used to determine significant differences between control and TCE-treated groups (α=0.05). The Spearman (rank) correlation analysis across all variables was conducted to account for the difference in scale of the variables. In correlation analyses, false discover rate correction (Storey and Tibshirani 2003) was applied to all p-values to correct for multiple comparisons. The resultant significant (<0.1) q-values are reported in the Supplementary Tables. All statistical analyses were performed using SAS software ver. 9.3 (SAS Institute, Cary, NC).
Data availability
Individual animal-level data for all quantitative endpoints is available publicly at the Mouse Phenome Database (http://phenome.jax.org/; accession ID: Rusyn6).
Results
Sub-acute (5 days) study of strain-dependent effects of TCE in mouse kidney
We measured kidney levels of TCE metabolites from CYP450-mediated oxidation (TCA, DCA, TCOH) and GSH conjugation (DCVC and DCVG) in mice from seven inbred strains treated with an aqueous suspension of TCE (600 mg/kg/d) for 5 days (Figure 1). Across all strains, kidney levels of TCA were 100 to 1,000-fold greater than those for DCA, and the amounts of DCA were about 100 to 1,000-fold higher than those of either DCVG or DCVC. Mouse kidney levels of TCOH, also a major oxidative metabolite of TCE, were 2 to 4-fold higher than those of TCA. The concentration of DCVC in kidney was at least 50 to 100-fold higher than that of DCVG, which was below the LLOQ in most samples. We found a significant strain effect (p<0.05) for each metabolite. Liver and serum concentrations of these metabolites are reported in a companion manuscript (Yoo et al. submitted).
Figure 1. Inter-strain variability in TCE metabolism in the kidney of mouse in a sub-acute study.
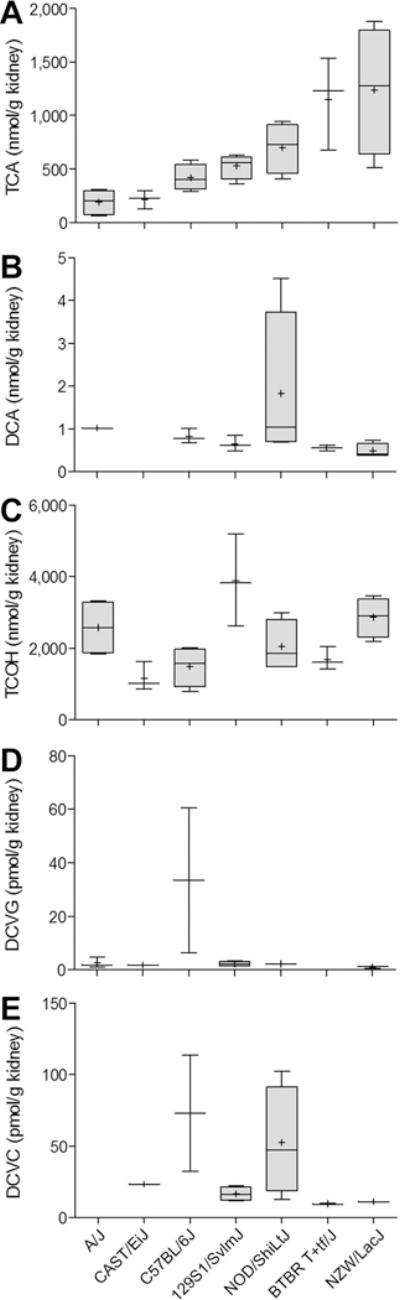
Kidney levels of metabolites were assessed 2 h following the last of 5 daily doses (600 mg/kg/d) of TCE. Box and whisker plots are shown (+, mean; line, median; box, inter-quartile range; whiskers, min to max). When box is shown, 4 animals per group were available. Otherwise, there were 3 animals per group.
We examined the correlation between TCE metabolites in mouse kidney, liver, and serum (Supplementary Table 1). We observed no significant correlation among metabolites in the kidney. However, we found an inter-organ correlation for GSH conjugation-derived TCE metabolites. Although DCVG and DCVC were not correlated with each other in either liver or kidney, we found a significant correlation between liver DCVG, and kidney and serum DCVC, as well as with kidney DCVG, even after correction for multiple comparisons. Liver DCA correlated significantly with serum, liver and kidney TCA.
We examined effects of repeat dosing with TCE on kidney weight (relative to body weight), proximal tubule cell proliferation, and BUN (Figures 2A–C). We observed significant effect on kidney enlargement in response to sub-acute treatment with TCE in 129S1/SvImJ and BTBR T+tf/J strains; however, proximal tubule cell proliferation, as evaluated by BrdU immunohistochemistry, was not affected by TCE in any strain. BUN levels did not change in response to TCE treatment.
Figure 2. Inter-strain differences in kidney toxicity of TCE in a sub-acute study.
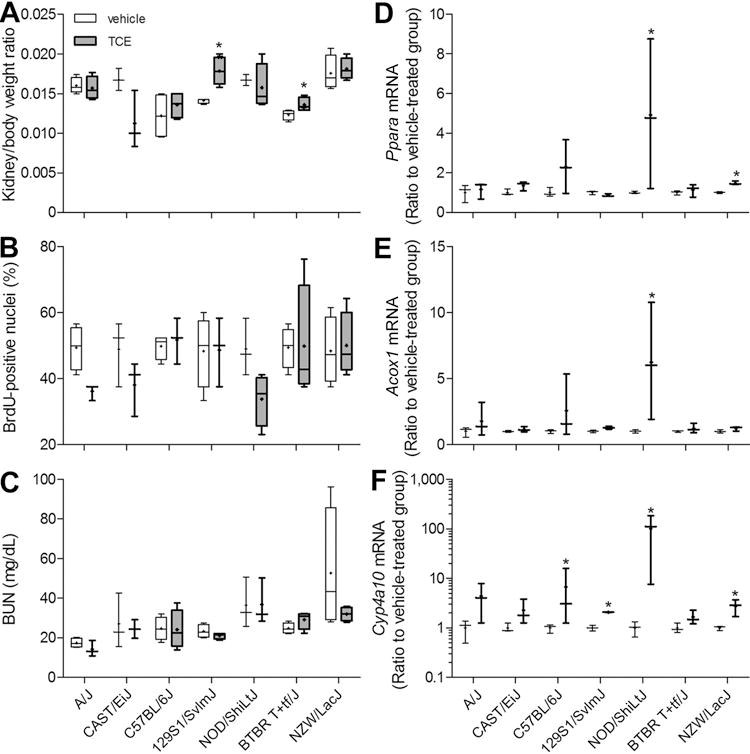
(A) Kidney to body weight ratios, (B) percent BrdU-positive proximal tubule cell nuclei, (C) blood urea nitrogen, and kidney expression of peroxisome proliferation marker genes Ppara (D), Acox1 (E), and Cyp4a10 (F) were evaluated in mice treated with vehicle (white) or TCE (gray; 600 mg/kg) for 5 days. Box and whiskers plots are shown (+, mean; line, median; box, inter-quartile range; whiskers, min to max). Asterisk (*) denotes a significant difference (p<0.05) compared to vehicle-treated group within same strain. When box is shown, 4 animals per group were available. Otherwise, there were 3 animals per group.
Given the large amounts of CYP450-mediated oxidative metabolites and the strain-dependent kidney enlargement, we evaluated kidney expression of Pparα, as well as Cyp4a10 and Acox1, marker genes for PPARα activation (Figures 2D–F). We observed significant exposure-related increases in expression of the transcription factor Pparα in NOD/ShiLtJ and NZW/LacJ strains. TCE had a significant effect of expression of Acox1 only in NOD/ShiLtJ, while expression of Cyp4a10 was significantly elevated in four strains including C57BL/6J, 129S1/SvImJ, NOD/ShiLtJ, and NZW/LacJ. Where induced by TCE, the magnitude of the effect on Cyp4a10 was found to be much greater than that on Acox1.
Histopathological evidence of kidney injury was previously observed in mice exposed to TCE sub-acutely or sub-chronically only at very high doses (in excess of 3,000 mg/kg) (National Cancer Institute 1976; National Toxicology Program 1990). Recently, KIM-1 was qualified as a sensitive and early biomarker of acute kidney injury (Ozer et al. 2010). Therefore, we examined KIM-1 expression and found that TCE significantly induced expression of KIM-1 on the apical membrane of the proximal tubular S3 segment in the outer medulla in 129S1/SvImJ, C57BL/6J, A/J, and BTBR T+tf/J strains (Figure 3).
Figure 3. Inter-strain differences in KIM-1 expression in mouse kidney in a sub-acute study.
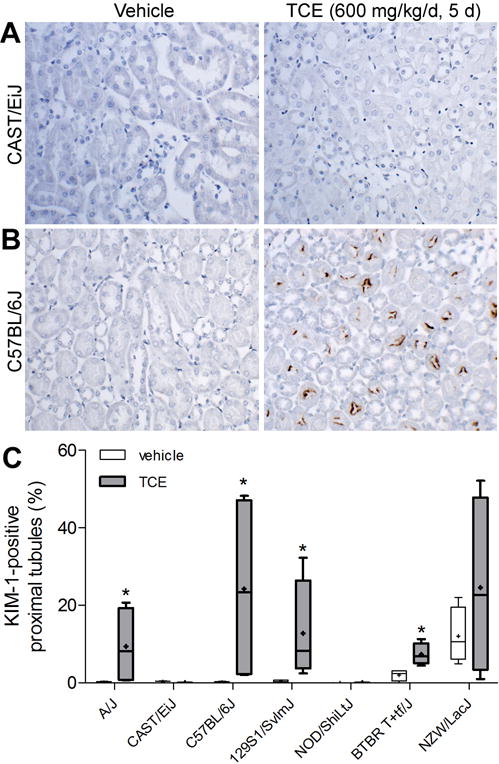
Immuno-histochemical detection of KIM-1 (brown deposits on the apical membrane side of kidney proximal tubules in the outer medulla) was performed. Representative images from vehicle (left) and TCE (600 mg/kg/d for 5 days)-treated CAST/EiJ (A) and C57BL/6J strains are shown. (C) Quantitative analysis of KIM-1-positive proximal tubules in the kidneys of mice treated with vehicle (white) or TCE (gray). Box and whiskers plots are shown (+, mean; line, median; box, inter-quartile range; whiskers, min to max). Asterisk (*) denotes a significant difference (p<0.05) compared to vehicle-treated group within same strain. There were 4 animals per group.
Because inter-strain differences in both TCE metabolism and kidney toxicity were observed in this study, we examined correlations among these endpoints in kidney (Supplementary Table 2). Liver DCVG and kidney DCVC are significantly correlated (Figure 4A). Also, Acox1 and Cyp4a10 were significantly correlated with each other (Figure 4B). We found no significant correlation between kidney levels of DCVC and expression of either Acox1 or Cyp4a10 (Figure 4C). KIM-1 expression was not significantly correlated with any TCE metabolite, including DCVC (Figure 4D), or other endpoints such as markers of PPARα activation.
Figure 4. Correlation among kidney DCVC and toxicity phenotypes in a sub-acute study.
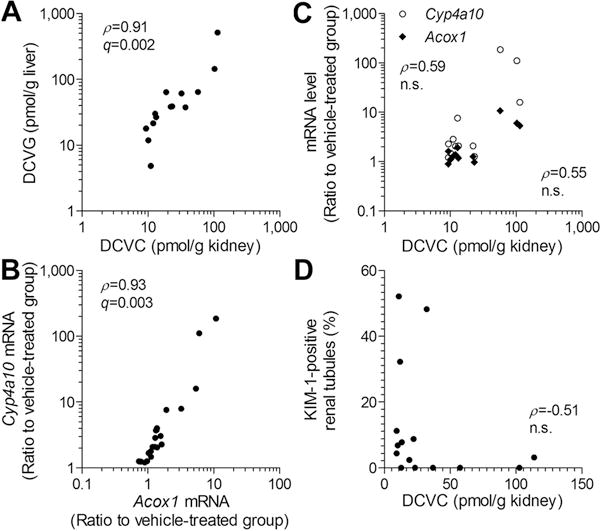
(A) DCVG in the liver was significantly correlated with the kidney levels of DCVC. (B) Kidney expression of Cyp4a10 and Acox1 were significantly correlated. (C) TCE-induced increase in Cyp4a10 (open circle) and Acox1 (filled rhombus) expression in the mouse kidney was not significantly correlated with kidney level of DCVC. (D) No significant correlation was observed between DCVC concentration in the kidney and KIM-1 expression. Each dot represents an individual TCE-treated animal in the study. Spearman rank (ρ) correlations and false discovery rate-corrected significance values (q<0.1) are shown.
Sub-chronic (up to 4 weeks) study of strain-dependent effects of TCE in mouse kidney
Based on the differences in TCE metabolism observed in the sub-acute (5 days) TCE exposure study, we selected C57BL/6J and NZW/LacJ strains to further test our hypothesis that inter-strain differences in formation of GSH-conjugation metabolites of TCE in the kidney are associated with kidney-specific toxicity. We examined time- (1, 2 and 4 weeks) and dose-dependent (100 and 400 mg/kg/d, i.g.) effects of TCE in these two strains.
We found that strain-dependent differences in TCA level in kidney are dose-dependent (Figure 5). Overall, kidney levels of TCA and TCOH were higher in NZW/LacJ mice, similar to the sub-acute study result (Figure 1). Also, concordant with the findings in the sub-acute study, levels of TCA and TCOH in kidney were 100 to 1,000-fold greater than those of DCA. Levels of DCVC and DCVG in kidney were below the LLOQ; however, the doses of TCE used herein were lower than those in the sub-acute study. Amounts of CYP450-depedent oxidative metabolites of TCE in the kidney generally trended downward over time. Specifically, the levels of TCA in kidney decreased over time in both strains, while the level of TCOH in kidney decreased over time only in C57BL/6J strain, which was consistent with the findings in the liver. We found no dose-, time-, or strain-dependent differences in kidney levels of DCA.
Figure 5. Time-course analysis of TCE metabolism in C57BL/6J and NZW/LacJ mice in a sub-chronic study.
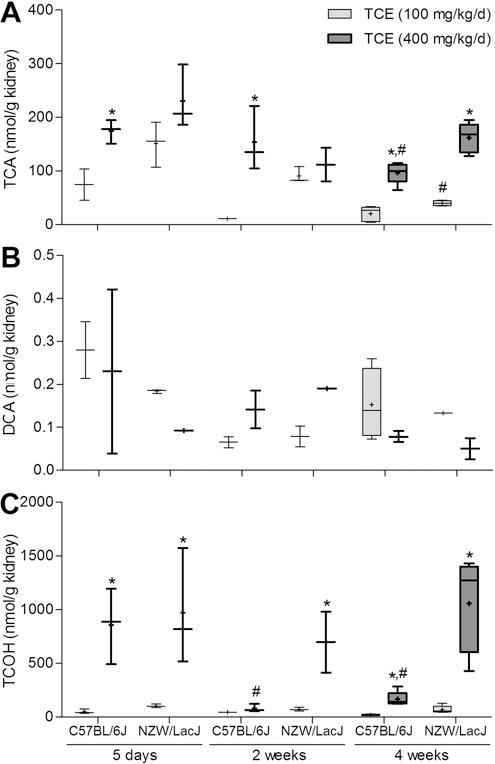
TCA (A), DCA (B), and TCOH (C) levels in the kidney were assessed 2 h following the last dose after 1, 2 or 4 wks (100 or 400 mg/kg/d) of TCE. Box and whiskers plots are shown (+, mean; line, median; box, inter-quartile range; whiskers, min to max). Light-gray, 100 mg/kg/d groups; dark gray, 400 mg/kg/d groups. Asterisks denote a significant (p<0.05) difference as compared to (*) the group dosed with 100 mg/kg/d (same strain and time point), or (#) the 5 day treatment group (same strain and dose). Box and whiskers plots are shown (+, mean; line, median; box, inter-quartile range; whiskers, min to max). When box is shown, 5 animals per group were available. Otherwise, there were 3 animals per group.
Among CYP450-dependent oxidative metabolites that were quantified in this study, kidney levels of TCA and TCOH were highly correlated (Supplemental Table 3) across both strains in the sub-chronic study. Interestingly, kidney levels of TCA and TCOH were significantly correlated with liver levels of TCA, DCA, and TCOH, which may reflect the strong decreasing trend in formation of CYP450-depedent oxidative metabolites of TCE over time that was observed both in the liver and kidney.
We also examined the effects of sub-chronic treatment with TCE on the kidney toxicity markers and the marker genes of PPARα activation. We found no effect of sub-chronic TCE treatment on kidney in terms of traditional biomarkers such as kidney-to-body weight ratio, BUN, and serum creatinine (Figures 6A–C). However, we observed a prominent effect of TCE on the marker genes of PPARα activation in the kidney. Expression of Acox1 and Cyp4a10 significantly increased in a dose-dependent manner in both strains of mice treated with TCE for 5 days (Figures 6E–F). Pparα was also significantly induced by TCE in NZW/LacJ mice at the highest dose at 5 days. Interestingly, the extent of up-regulation of Acox1 and Cyp4a10 by TCE decreased over time. In the 2 and 4 weeks treatment groups, we found little to no differences in gene expression between vehicle and TCE-treated animals, except for significant induction of Pparα and Acox1 in C57BL/6J mice treated with 400 mg/kg/d TCE for 2 weeks.
Figure 6. Differences in kidney toxicity of TCE in C57BL/6J and NZW/LacJ mice in a sub-chronic study.
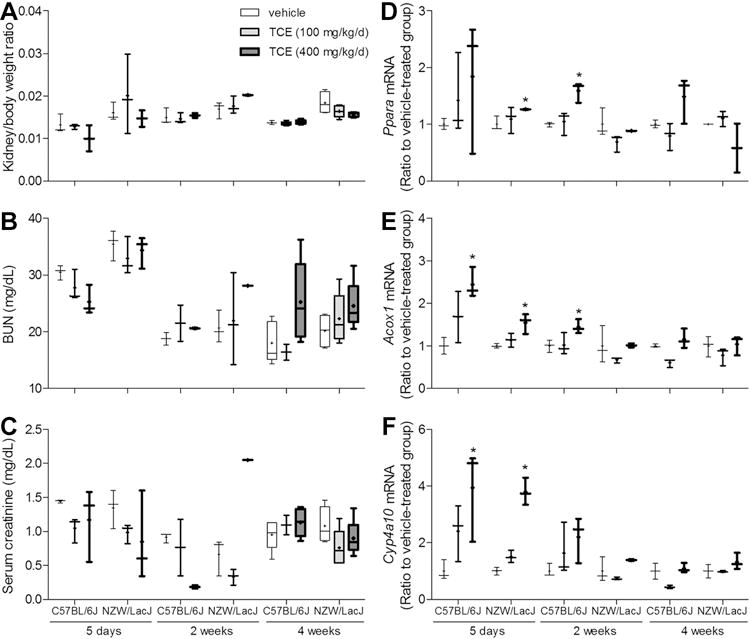
Kidney to body weight ratios (A), blood urea nitrogen (B), serum creatinine (C), and kidney expression of peroxisome proliferation marker genes Ppara (D), Acox1 (E), and Cyp4a10 (F) were evaluated in mice treated with TCE (100 or 400 mg/kg) for 1, 2 or 4 wks. Box and whiskers plots are shown (+, mean; line, median; box, inter-quartile range; whiskers, min to max). White, vehicle-treated groups; light-gray, 100 mg/kg/d groups; dark gray, 400 mg/kg/d groups. Asterisk (*) denotes a significant (p<0.05) difference as compared to vehicle-treated group (same strain and time point). Thickness of the line corresponds to the vehicle, 100 and 400 mg/kg/d groups. Box and whiskers plots are shown (+, mean; line, median; box, inter-quartile range; whiskers, min to max). When box is shown, 5 animals per group were available. Otherwise, there were 3 animals per group.
Furthermore, we observed that effects of TCE on proximal tubule cellular proliferation and KIM-1 expression were treatment-, time- and strain-dependent (Figure 7). Whereas we found that the proximal tubule cellular proliferation was significantly elevated only in NZW/LacJ strain after 4 weeks of treatment with TCE, a significant increase in KIM-1 expression was observed in both strains only after 5 days of treatment with TCE.
Figure 7. Differences in kidney toxicity of TCE in C57BL/6J and NZW/LacJ mice in a sub-chronic study.
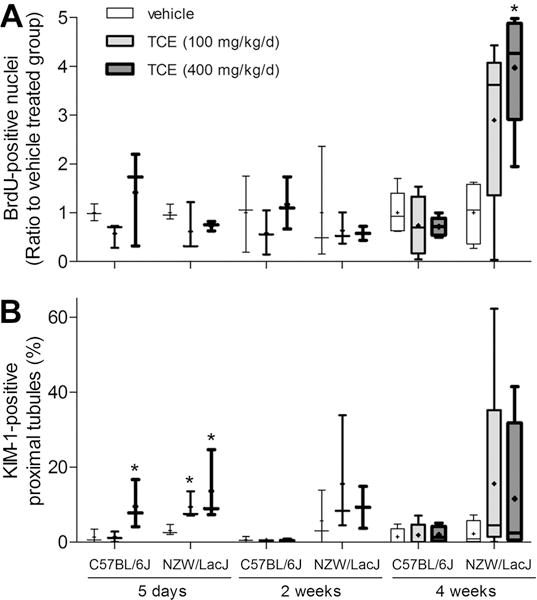
Percent BrdU-positive proximal tubule cell nuclei (A), and kidney expression of KIM-1 (B) were evaluated in mice treated with TCE (100 or 400 mg/kg/d) for 1, 2 or 4 wks. Box and whiskers plots are shown (+, mean; line, median; box, inter-quartile range; whiskers, min to max). White, vehicle-treated groups; light-gray, 100 mg/kg/d groups; dark gray, 400 mg/kg/d groups. Asterisk (*) denotes a significant (p<0.05) difference as compared to vehicle-treated group (same strain and time point). Box and whiskers plots are shown (+, mean; line, median; box, inter-quartile range; whiskers, min to max). When box is shown, 5 animals per group were available. Otherwise, there were 3 animals per group.
We found that kidney levels of TCA were significantly correlated with TCOH (Figure 8A), and Acox1 and Cyp4a10 expression in the kidney regardless of TCE dose or treatment duration (Figure 8B). We also observed that kidney levels of TCA were significantly correlated with expression of KIM-1 (Figure 8C), but not with proximal tubule cellular proliferation (Figure 8D).
Figure 8. Correlation between TCE metabolites and kidney toxicity phenotypes in C57BL/6J and NZW/LacJ mice in a sub-chronic study.
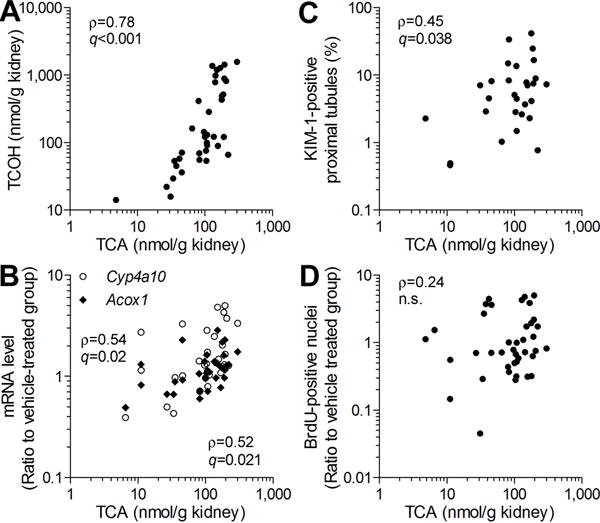
(A) Levels of TCA and TCOH in kidney were significantly correlated with each other. (B) TCE-induced increase in Cyp4a10 (open circle) and Acox1 (filled rhombus) expression in the mouse kidney was significantly correlated with kidney levels of TCA. (C) Levels of TCA in the kidney were significantly correlated with KIM-1 expression in the proximal tubules. (D) No correlation was observed between TCA concentrations in the kidney and proximal tubule cellular proliferation. Each dot represents an individual TCE-treated mouse. Spearman rank (ρ) correlations and false discovery rate-corrected significance values (q<0.1) are shown.
Discussion
This study is first to report the levels of CYP-mediated oxidative and GSH-conjugation metabolites of TCE in the kidney of exposed mice. The estimation of the relative flux to each of these two pathways of TCE metabolism has been subject to debate (Rusyn et al. 2014). Although recent human cancer hazard assessments concluded that GSH conjugation pathway is primarily responsible for TCE-induced kidney effects (Chiu et al. 2013; Guha et al. 2012), there are considerable uncertainties regarding the extent of the flux to GSH conjugation pathway between species and among individuals. Thus, we aimed to provide quantitative estimates of dose-, time-, and strains-specific differences in TCE metabolite burden in the mouse kidney, and to determine whether TCE-associated toxicity phenotypes correlate with TCE metabolite levels. Not only does this study provide for the first time comprehensive quantitative estimates of TCE metabolism and toxicity in kidney of mouse as species, but also it explored inter-strain variability in these phenotypes. Indeed, a mouse model of the human population is an effective tool for understanding the molecular underpinnings of the population variability in response to toxic agents (Rusyn et al. 2010), including studies of adverse health effects of chlorinated solvents (Bradford et al. 2011).
Species comparison of TCE metabolite levels in the kidney
In the sub-acute study, similar with the findings in the liver (Yoo et al, submitted), we found up to 5 orders of magnitude difference in the relative flux of TCE through CYP450-dependent oxidation (primarily TCA) as compared to GSH conjugation in mouse kidney. These findings are consistent with the TCE metabolite data in mouse serum (Kim et al. 2009b; Bradford et al. 2011; Chiu et al. 2014). However, our findings differ from those reported in one rat study where kidney levels of TCE metabolites were evaluated (Lash et al. 2006). Lash et al. (2006) reported kidney levels of DCVG in female rats to be 100-fold higher than those of TCA and TCOH. Furthermore, kidney levels of DCVC in female rats in Lash et al. (2006) were similar to those observed in our study in male mice, but the levels of DCVG reported in female rat kidneys were about 10-fold greater. No DCVG or DCVC were detected in male rat kidneys by Lash et al. (2006).
A criticism of the technical issues that accompany the methodology for detection of GSH conjugation metabolites of TCE used in the studies of Lash and co-workers has been detailed in (U.S. EPA 2011), and it was argued that the technique of (Fariss and Reed 1987) may overestimate the amounts of DCVG. The major differences in the relative flux through the oxidative and GSH conjugation pathways are, however, due to much lower amounts of TCA reported by Lash et al (2006). Furthermore, these results are not in accord with published reports of blood or plasma levels of TCE-derived DCA and TCA in rat and mouse (Kim et al. 2009a; Abbas and Fisher 1997; Merdink et al. 1998; Larson and Bull 1992). Thus, the toxicological implications of the quantitative difference among studies and species should be interpreted with caution. We reason that our results on TCE metabolite levels in mouse kidneys provide valuable new data that fill a gap in organ-specific health assessments of TCE and related solvents.
Intra- and inter-organ metabolism of TCE
We also found that the effect of the first-pass metabolism of TCE in the liver may be still sustained in the kidney. TCA and TCOH are two major TCE metabolites to be excreted, and we found that kidney levels of TCOH were 2 to 3-fold higher than those of TCA, which is in accord with the observation that cumulative urinary excretion of TCOH was about 2-fold higher than that of TCA in humans exposed to chloral hydrate (Merdink et al. 2008). A significant correlation between liver DCVG and kidney DCVC also supports a hypothesis that DCVG is primarily formed in the liver and then translocates to the kidney, where subsequent metabolism to DCVC involves γ-glutamyltransferase and cysteinylglycine dipeptidase (Lash et al. 1998).
With respect to inter-organ differences in CYP450-dependent oxidation, we found no relationship between liver and kidney, other than significant correlation between liver DCA and kidney TCA in a sub-acute study, possibly due to strain-difference in metabolism and transport. However, in a sub-chronic study, liver levels of TCA, DCA, and TCOH were significantly correlated with kidney levels of TCA, DCA, and TCOH. This finding suggests effective inter-organ transport of the oxidative metabolites of TCE. Among GSH conjugation metabolites of TCE, the only significant correlation found was between liver DCVG and kidney DCVC. This correlation, combined with the observations that DCVG is detected in much greater concentrations in the liver than DCVC, and that the opposite is true in the kidney, strongly supports the dependence of the downstream metabolism of DCVG on kidney-specific enzymes (Lash et al. 2000).
For the sub-chronic study, C57BL/6J and NZW/LacJ strains were selected to maximize the strain differences in the extent of TCE metabolism. One of the notable differences between these two strains is the relative difference in flux to each pathway. As expected from the data in the sub-acute study, kidney levels of TCA and TCOH were found to be higher in NZW/LacJ than in C57BL/6J mice. However, DCVC and DCVG, which were expected to be higher in C57BL/6J, were not detected in the sub-chronic study where the doses used were lower than those in the sub-acute study. The sensitivity of the analytical methods, combined with low extraction recoveries, presents a continued limitation to our ability to quantify the levels of these critically important TCE metabolites in studies that use environmentally-relevant exposures to TCE. Therefore, further improvements are needed to fill the data gaps.
TCE-induced kidney toxicity
Our study provides important information on the TCE-associated increase in relative kidney weight and acute kidney injury. The finding that relative kidney weight and KIM-1 expression, an indicator of both damage and regeneration (Ichimura et al. 2004), were increased in response to sub-acute TCE treatment in some, but not all mouse strains, provides additional direct evidence that TCE can cause nephrotoxicity in the mouse, but that this effect is strain-dependent. Another sub-acute (10 days) study with TCE found no significant increases in kidney/body weight ratios in B6C3F1 mice (Goldsworthy and Popp 1987). Depletion of GSH in the renal cortex of NMRI mice treated with a single i.p. dose of TCE was also shown (Cojocel et al. 1989). Mild to moderate cytomegaly and karyomegaly of the renal tubular epithelial cells of the inner cortex were observed in some, but not all, male B6C3F1 mice treated for 13 weeks with 3000 or 6000 mg/kg/d TCE (National Toxicology Program 1990). In our study, an increase in KIM-1 expression was observed in 4 out of 7 strains treated with TCE (600 mg/kg/d) for 5 days, and confirmed in the two strains treated with TCE (400 mg/kg/d) for 5 days in the sub-chronic study. We found no positive KIM-1 signal with or without TCE treatment in NOD/ShiLtJ strain in which relatively higher amount of kidney DCVC was detected; however, NOD/ShiLtJ mice appear to be uniquely resistant to kidney injury as even upon treatment with a known renal toxicant DB289 no increase in urinary KIM-1 was detected, while in C57BL/6J mice a 10-fold increase was observed (Harrill et al. 2012).
Interestingly, at both 2 and 4 week treatment time points, KIM-1 expression was not significantly increased, albeit it was somewhat higher in TCE-treated NZW/lacJ mice. This dampening of the nephrotoxicity under conditions of the continuous exposure may be due to the compensatory responses of the kidney. Indeed, tubular epithelial cells can undergo compensatory proliferation and adaptation following injury (Lin et al. 2005; Duffield et al. 2005).
TCE effects on PPARα-associated pathways
Limited evidence exists to suggest that TCE exposure induces peroxisome proliferation in the kidney of exposed rodents. Peroxisome proliferation in the rat and mouse kidney has been evaluated in only one other study (Goldsworthy and Popp 1987) where animals were exposed to TCE (1000 mg/kg/d) for 10 days. Increases in renal palmitoyl–CoA oxidation activity were observed in both rats and mice treated with TCE. We show that treatment with a comparable dose of TCE (600 mg/kg/d) for 5 days resulted in induction of Cyp4a10 that was significant in 4 out of 7 strains tested. Acox1 and Pparα were also markedly induced in NOD/ShiLtJ strain, in which Cyp4a10 induction was almost 100-fold. Marked strain-dependence of the TCE effect on PPARα-mediated signaling in mouse kidney is similar to that in the liver, as it was found that PPAR-mediated pathway was one of the most pronounced strain-dependent molecular effects of TCE in mouse liver (Bradford et al. 2011).
In the sub-chronic study, not only did we observe dose- and strain-specific effects on the same endpoints, but we also found a decreasing trend of Acox1 and Cyp4a10 expression over time in the kidney. There is a similar observation in a time-course study with a model peroxisome proliferator di-2-ethylhexyl phthalate (Ohno et al. 1982). The authors counted the number of peroxisomes in the kidney cortex of rats exposed to DEHP and found that the number of peroxisomes peaked at 1 week and decreased at 2 and 4 weeks. Similar to the effects of TCE in the liver, it is likely that this dampening of an effect is related to a decrease in the amount of CYP450-mediated oxidative metabolites of TCE. Indeed, there was a significant correlation among kidney levels of TCA and expression of both Acox1 and Cyp4a10.
TCE metabolite levels and kidney toxicity phenotypes
In addition, the data collected in this study allows for a detailed quantitative investigation of the relationships between TCE metabolite levels and kidney toxicity phenotypes. While CYP450-mediated oxidative metabolites of TCE are known to activate PPARα signaling, and the GSH conjugation metabolite, DCVC has been shown to be nephrotoxic in mice (Jaffe et al. 1985; Darnerud et al. 1989), no previous study examined the correlation between metabolism and toxicity. Indeed, a number of confirmatory and novel observations were drawn from such comparisons in the work presented herein.
In the sub-acute study, the strain-dependent minimal to mild nephrotoxicity, as evidenced by KIM-1 immunohistochemistry, did not correlate with any measured TCE metabolites, including DCVC. In the sub-chronic study, KIM-1 staining in proximal tubules, a marker of both cytotoxicity and regeneration was correlated with kidney amounts of TCA. These findings suggest that multiple metabolites and/or pathways are likely to be involved in TCE-induced kidney cytotoxicity in mice. In fact, evidence of cytotoxicity in the rat kidney was observed not only in animals treated with DCVC, but also those treated with TCA and TCOH (Green et al. 2003; Dow and Green 2000). Renal toxicity in long-term studies in rats has been attributed to stimulation of formic acid excretion by oxidative metabolites of TCE (Green et al. 1998). The reported connection between formic acid excretion, acidosis, renal toxicity and renal cancer in rats exposed to trichloroethylene for 2 years has not been explored yet in mice and our data suggest that this mechanism may also be plausible.
In the sub-acute study, we did find a similar strain- and treatment-dependent pattern between the level of DCVC and expression of Cyp4a10, although the correlation was not significant in part due to the small number of data points. This is a noteworthy finding because CYP450-mediated oxidative, but not GSH conjugation, metabolites are regarded as responsible for PPARα activation, although the data in the kidney is limited. TCA, but not DCVC, was strongly correlated with Acox1 and Cyp4a10 in the sub-chronic study; however, this correlation may primarily reflect the decreasing trend over time observed simultaneously in the levels of metabolites and the extent of PPARα activation. When the data is stratified by strain, the levels of TCA and TCOH were higher in NZW/LacJ, while the extent of PPARα target gene expression was higher in C57BL/6J in both sub-acute and sub-chronic studies. This result questions a direct relationship between formation of oxidative metabolites and PPARα activation in the mouse kidney. PPARα activation has important roles in renal function, such as maintenance of energy balance through regulating β-oxidation of fatty acids (Portilla et al. 2000), blood pressure regulation linked with CYP450 4A enzyme (Guan and Breyer 2001), and peroxisomal respiration associated with oxidative stress (Zaar 1992). Just as the perturbation of PPARα activity may result in various adverse effects, so a number of endogenous and exogenous factors can induce PPARα activation (Peters et al. 2012).
We also note that the correlation analyses performed herein, while highly informative, have limitations as they do not take into consideration potential differences in clearance between the different metabolites, across strains, and effects of TCE treatment. In addition, the concentration-time profiles of different metabolites in serum vary greatly (Kim et al 2009b) and our study collected metabolite data only at one time point, two hours prior to sample collection, whereas the toxicity effects are likely to be the cumulative result of treatments on the previous days, as well as that prior to sample collection.
Supplementary Material
Acknowledgments
Funding
This work was supported, in part, by grants from NIEHS (P42 ES005948 and P30 ES010126) and AstraZeneca (Bioscience PhD Studentship to HSY). The authors are grateful to Dr. Gary Boorman for his advice on the histopathology endpoints in this study. The authors also thank Dr. Sungkyoon Kim (Seoul National University) for useful discussions of the study design and results.
List of Abbreviations
- BrdU
5-bromo-2′-deoxyuridine
- DCA
Dichloroacetic acid
- DCVC
S-(1,2-dichlorovinyl)-L-cysteine
- DCVG
S-(1,2-dichlorovinyl)glutathione
- DFA
Difluoroacetic acid
- GSH
Glutathione
- LLOQ
Lower limit of quantification
- NADPH
Nicotinamide adenine dinucleotide phosphate
- PPARα
Peroxisome proliferator-activated receptor alpha
- TCA
Trichloroacetic acid
- TCE
Trichloroethylene
- TCOH
Trichloroethanol
- TFA
Trifluoroacetic acid
Footnotes
Previous publication
Partially presented at the Society of Toxicology annual meeting, San Antonio, TX, March 2013.
References
- Abbas R, Fisher JW. A physiologically based pharmacokinetic model for trichloroethylene and its metabolites, chloral hydrate, trichloroacetate, dichloroacetate, trichloroethanol, and trichloroethanol glucuronide in B6C3F1 mice. Toxicol Appl Pharmacol. 1997;147(1):15–30. doi: 10.1006/taap.1997.8190. [DOI] [PubMed] [Google Scholar]
- Bradford BU, Lock EF, Kosyk O, Kim S, Uehara T, Harbourt D, DeSimone M, Threadgill DW, Tryndyak V, Pogribny IP, Bleyle L, Koop DR, Rusyn I. Interstrain differences in the liver effects of trichloroethylene in a multistrain panel of inbred mice. Toxicol Sci. 2011;120(1):206–17. doi: 10.1093/toxsci/kfq362. [DOI] [PMC free article] [PubMed] [Google Scholar]
- Brauch H, Weirich G, Hornauer MA, Storkel S, Wohl T, Bruning T. Trichloroethylene exposure and specific somatic mutations in patients with renal cell carcinoma. J Natl Cancer Inst. 1999;91(10):854–61. doi: 10.1093/jnci/91.10.854. [DOI] [PubMed] [Google Scholar]
- Bruning T, Lammert M, Kempkes M, Thier R, Golka K, Bolt HM. Influence of polymorphisms of GSTM1 and GSTT1 for risk of renal cell cancer in workers with long-term high occupational exposure to trichloroethene. Arch Toxicol. 1997;71(9):596–599. doi: 10.1007/s002040050432. [DOI] [PubMed] [Google Scholar]
- Charbotel B, Gad S, Caiola D, Beroud C, Fevotte J, Bergeret A, Ferlicot S, Richard S. Trichloroethylene exposure and somatic mutations of the VHL gene in patients with Renal Cell Carcinoma. J Occup Med Toxicol. 2007;2:13. doi: 10.1186/1745-6673-2-13. [DOI] [PMC free article] [PubMed] [Google Scholar]
- Chiu WA, Campbell JL, Clewell HJ, Zhou YH, Wright FA, Guyton KZ, Rusyn I. Physiologically-Based Pharmacokinetic (PBPK) Modeling of Inter-strain Variability in Trichloroethylene Metabolism in the Mouse. Environ Health Perspect. 2014;122(5):456–463. doi: 10.1289/ehp.1307623. [DOI] [PMC free article] [PubMed] [Google Scholar]
- Chiu WA, Jinot J, Scott CS, Makris SL, Cooper GS, Dzubow RC, Bale AS, Evans MV, Guyton KZ, Keshava N, Lipscomb JC, Barone S, Fox JF, Gwinn MR, Schaum J, Caldwell JC. Human health effects of trichloroethylene: key findings and scientific issues. Environ Health Perspect. 2013;121(3):303–11. doi: 10.1289/ehp.1205879. [DOI] [PMC free article] [PubMed] [Google Scholar]
- Chiu WA, Okino MS, Lipscomb JC, Evans MV. Issues in the pharmacokinetics of trichloroethylene and its metabolites. Environ Health Perspect. 2006;114(9):1450–1456. doi: 10.1289/ehp.8691. [DOI] [PMC free article] [PubMed] [Google Scholar]
- Cojocel C, Beuter W, Muller W, Mayer D. Lipid peroxidation: a possible mechanism of trichloroethylene-induced nephrotoxicity. Toxicology. 1989;55(1–2):131–41. doi: 10.1016/0300-483x(89)90180-7. [DOI] [PubMed] [Google Scholar]
- Darnerud PO, Brandt I, Feil VJ, Bakke JE. Dichlorovinyl cysteine (DCVC) in the mouse kidney: tissue-binding and toxicity after glutathione depletion and probenecid treatment. Arch Toxicol. 1989;63(5):345–50. doi: 10.1007/BF00303121. [DOI] [PubMed] [Google Scholar]
- Desimone MC, Rathmell WK, Threadgill DW. Pleiotropic effects of the trichloroethylene-associated P81S VHL mutation on metabolism, apoptosis, and ATM-mediated DNA damage response. J Natl Cancer Inst. 2013;105(18):1355–64. doi: 10.1093/jnci/djt226. [DOI] [PMC free article] [PubMed] [Google Scholar]
- Dow JL, Green T. Trichloroethylene induced vitamin B(12) and folate deficiency leads to increased formic acid excretion in the rat. Toxicology. 2000;146(2–3):123–36. doi: 10.1016/s0300-483x(00)00156-6. [DOI] [PubMed] [Google Scholar]
- Duffield JS, Park KM, Hsiao LL, Kelley VR, Scadden DT, Ichimura T, Bonventre JV. Restoration of tubular epithelial cells during repair of the postischemic kidney occurs independently of bone marrow-derived stem cells. J Clin Invest. 2005;115(7):1743–55. doi: 10.1172/JCI22593. [DOI] [PMC free article] [PubMed] [Google Scholar]
- Fariss MW, Reed DJ. High-performance liquid chromatography of thiols and disulfides: dinitrophenol derivatives. Methods Enzymol. 1987;143:101–109. doi: 10.1016/0076-6879(87)43018-8. [DOI] [PubMed] [Google Scholar]
- Goldsworthy TL, Popp JA. Chlorinated hydrocarbon-induced peroxisomal enzyme activity in relation to species and organ carcinogenicity. Toxicol Appl Pharmacol. 1987;88(2):225–33. doi: 10.1016/0041-008x(87)90008-1. [DOI] [PubMed] [Google Scholar]
- Green T, Dow J, Foster JR, Hext PM. Formic acid excretion in rats exposed to trichloroethylene: a possible explanation for renal toxicity in long-term studies. Toxicology. 1998;127(1–3):39–47. doi: 10.1016/s0300-483x(98)00020-1. [DOI] [PubMed] [Google Scholar]
- Green T, Dow J, Foster J. Increased formic acid excretion and the development of kidney toxicity in rats following chronic dosing with trichloroethanol, a major metabolite of trichloroethylene. Toxicology. 2003;191(2–3):109–19. doi: 10.1016/s0300-483x(03)00206-3. [DOI] [PubMed] [Google Scholar]
- Guan Y, Breyer MD. Peroxisome proliferator-activated receptors (PPARs): novel therapeutic targets in renal disease. Kidney Int. 2001;60(1):14–30. doi: 10.1046/j.1523-1755.2001.00766.x. [DOI] [PubMed] [Google Scholar]
- Guha N, Loomis D, Grosse Y, Lauby-Secretan B, El Ghissassi F, Bouvard V, Benbrahim-Tallaa L, Baan R, Mattock H, Straif K, International Agency for Research on Cancer Monograph Working Group Carcinogenicity of trichloroethylene, tetrachloroethylene, some other chlorinated solvents, and their metabolites. Lancet Oncol. 2012;13(12):1192–3. doi: 10.1016/s1470-2045(12)70485-0. [DOI] [PubMed] [Google Scholar]
- Harrill AH, Desmet KD, Wolf KK, Bridges AS, Eaddy JS, Kurtz CL, Hall JE, Paine MF, Tidwell RR, Watkins PB. A mouse diversity panel approach reveals the potential for clinical kidney injury due to DB289 not predicted by classical rodent models. Toxicol Sci. 2012;130(2):416–26. doi: 10.1093/toxsci/kfs238. [DOI] [PMC free article] [PubMed] [Google Scholar]
- Humphreys BD, Czerniak S, DiRocco DP, Hasnain W, Cheema R, Bonventre JV. Repair of injured proximal tubule does not involve specialized progenitors. Proc Natl Acad Sci USA. 2011;108(22):9226–31. doi: 10.1073/pnas.1100629108. [DOI] [PMC free article] [PubMed] [Google Scholar]
- Ichimura T, Hung CC, Yang SA, Stevens JL, Bonventre JV. Kidney injury molecule-1: a tissue and urinary biomarker for nephrotoxicant-induced renal injury. Am J Physiol Renal Physiol. 2004;286(3):F552–63. doi: 10.1152/ajprenal.00285.2002. [DOI] [PubMed] [Google Scholar]
- Jaffe DR, Hassall CD, Gandolfi AJ, Brendel K. Production of DNA single strand breaks in rabbit renal tissue after exposure to 1,2-dichlorovinylcysteine. Toxicology. 1985;35(1):25–33. doi: 10.1016/0300-483x(85)90129-5. [DOI] [PubMed] [Google Scholar]
- Karami S, Lan Q, Rothman N, Stewart PA, Lee KM, Vermeulen R, Moore LE. Occupational trichloroethylene exposure and kidney cancer risk: a meta-analysis. Occup Environ Med. 2012;69(12):858–67. doi: 10.1136/oemed-2012-100932. [DOI] [PubMed] [Google Scholar]
- Kim S, Collins LB, Boysen G, Swenberg JA, Gold A, Ball LM, Bradford BU, Rusyn I. Liquid chromatography electrospray ionization tandem mass spectrometry analysis method for simultaneous detection of trichloroacetic acid, dichloroacetic acid, S-(1,2-dichlorovinyl)glutathione and S-(1,2-dichlorovinyl)-L-cysteine. Toxicology. 2009a;262(3):230–8. doi: 10.1016/j.tox.2009.06.013. [DOI] [PMC free article] [PubMed] [Google Scholar]
- Kim S, Kim D, Pollack GM, Collins LB, Rusyn I. Pharmacokinetic analysis of trichloroethylene metabolism in male B6C3F1 mice: Formation and disposition of trichloroacetic acid, dichloroacetic acid, S-(1,2-dichlorovinyl)glutathione and S-(1,2-dichlorovinyl)-L-cysteine. Toxicol Appl Pharmacol. 2009b;238(1):90–9. doi: 10.1016/j.taap.2009.04.019. [DOI] [PMC free article] [PubMed] [Google Scholar]
- Larson JL, Bull RJ. Species differences in the metabolism of trichloroethylene to the carcinogenic metabolites trichloroacetate and dichloroacetate. Toxicol Appl Pharmacol. 1992;115(2):278–285. doi: 10.1016/0041-008x(92)90333-n. [DOI] [PubMed] [Google Scholar]
- Lash LH, Chiu WA, Guyton KZ, Rusyn I. Trichloroethylene biotransformation and its role in mutagenicity, carcinogenicity and target organ toxicity. Mutat Res. 2014 doi: 10.1016/j.mrrev.2014.04.003. in press. [DOI] [PMC free article] [PubMed] [Google Scholar]
- Lash LH, Fisher JW, Lipscomb JC, Parker JC. Metabolism of trichloroethylene. Environ Health Perspect. 2000;108(Suppl 2):177–200. doi: 10.1289/ehp.00108s2177. [DOI] [PMC free article] [PubMed] [Google Scholar]
- Lash LH, Putt DA, Brashear WT, Abbas R, Parker JC, Fisher JW. Identification of S-(1,2-dichlorovinyl)glutathione in the blood of human volunteers exposed to trichloroethylene. J Toxicol Environ Health A. 1999;56(1):1–21. doi: 10.1080/009841099158204. [DOI] [PubMed] [Google Scholar]
- Lash LH, Putt DA, Parker JC. Metabolism and tissue distribution of orally administered trichloroethylene in male and female rats: identification of glutathione- and cytochrome P-450-derived metabolites in liver, kidney, blood, and urine. J Toxicol Environ Health A. 2006;69(13):1285–1309. doi: 10.1080/15287390500360133. [DOI] [PMC free article] [PubMed] [Google Scholar]
- Lash LH, Qian W, Putt DA, Jacobs K, Elfarra AA, Krause RJ, Parker JC. Glutathione conjugation of trichloroethylene in rats and mice: sex-, species-, and tissue-dependent differences. Drug Metab Dispos. 1998;26(1):12–9. [PubMed] [Google Scholar]
- Lin F, Moran A, Igarashi P. Intrarenal cells, not bone marrow-derived cells, are the major source for regeneration in postischemic kidney. J Clin Invest. 2005;115(7):1756–64. doi: 10.1172/JCI23015. [DOI] [PMC free article] [PubMed] [Google Scholar]
- Mally A, Walker CL, Everitt JI, Dekant W, Vamvakas S. Analysis of renal cell transformation following exposure to trichloroethene in vivo and its metabolite S-(dichlorovinyl)-L-cysteine in vitro. Toxicology. 2006;224(1–2):108–18. doi: 10.1016/j.tox.2006.04.036. [DOI] [PubMed] [Google Scholar]
- Merdink JL, Gonzalez-Leon A, Bull RJ, Schultz IR. The extent of dichloroacetate formation from trichloroethylene, chloral hydrate, trichloroacetate, and trichloroethanol in B6C3F1 mice. Toxicol Sci. 1998;45(1):33–41. doi: 10.1006/toxs.1998.2500. [DOI] [PubMed] [Google Scholar]
- Merdink JL, Robison LM, Stevens DK, Hu M, Parker JC, Bull RJ. Kinetics of chloral hydrate and its metabolites in male human volunteers. Toxicology. 2008;245(1–2):130–140. doi: 10.1016/j.tox.2007.12.018. [DOI] [PubMed] [Google Scholar]
- Moore LE, Nickerson ML, Brennan P, Toro JR, Jaeger E, Rinsky J, Han SS, Zaridze D, Matveev V, Janout V, Kollarova H, Bencko V, Navratilova M, Szeszenia-Dabrowska N, Mates D, Schmidt LS, Lenz P, Karami S, Linehan WM, Merino M, Chanock S, Boffetta P, Chow WH, Waldman FM, Rothman N. Von Hippel-Lindau (VHL) inactivation in sporadic clear cell renal cancer: associations with germline VHL polymorphisms and etiologic risk factors. PLoS Genet. 2011;7(10):e1002312. doi: 10.1371/journal.pgen.1002312. [DOI] [PMC free article] [PubMed] [Google Scholar]
- Moore MM, Harrington-Brock K. Mutagenicity of trichloroethylene and its metabolites: implications for the risk assessment of trichloroethylene. Environ Health Perspect. 2000;108(Suppl 2):215–23. doi: 10.1289/ehp.00108s2215. [DOI] [PMC free article] [PubMed] [Google Scholar]
- National Cancer Institute. Carcinogenesis bioassay of trichloroethylene. Natl Cancer Inst Carcinog Tech Rep Ser. 1976;2:1–215. [PubMed] [Google Scholar]
- National Research Council. Assessing the Human Health Risks of Trichloroethylene: Key Scientific Issues. Washigton, DC: The National Academies Press; 2006. [Google Scholar]
- National Toxicology Program. Toxicology and Carcinogenesis Studies of Trichloroethylene (CAS No. 79-01-6) in Four Strains of Rats (ACI, August, Marshall, Osborne-Mendel) (Gavage Studies) Natl Toxicol Program Tech Rep Ser. 1988;273:1–299. [PubMed] [Google Scholar]
- National Toxicology Program. Carcinogenesis Studies of Trichloroethylene (Without Epichlorohydrin) (CAS No. 79-01-6) in F344/N Rats and B6C3F1 Mice (Gavage Studies) Natl Toxicol Program Tech Rep Ser. 1990;243:1–174. [PubMed] [Google Scholar]
- Ohno S, Fujii Y, Usuda N, Murata F, Nagata T. Peroxisomal proliferation in rat kidney induced with DEHP. I. Numerical change by light microscopic morphometry. Acta Histochem Cytochem. 1982;15(1):40–57. [Google Scholar]
- Ozer JS, Dieterle F, Troth S, Perentes E, Cordier A, Verdes P, Staedtler F, Mahl A, Grenet O, Roth DR, Wahl D, Legay F, Holder D, Erdos Z, Vlasakova K, Jin H, Yu Y, Muniappa N, Forest T, Clouse HK, Reynolds S, Bailey WJ, Thudium DT, Topper MJ, Skopek TR, Sina JF, Glaab WE, Vonderscher J, Maurer G, Chibout SD, Sistare FD, Gerhold DL. A panel of urinary biomarkers to monitor reversibility of renal injury and a serum marker with improved potential to assess renal function. Nat Biotechnol. 2010;28(5):486–94. doi: 10.1038/nbt.1627. [DOI] [PubMed] [Google Scholar]
- Peters JM, Shah YM, Gonzalez FJ. The role of peroxisome proliferator-activated receptors in carcinogenesis and chemoprevention. Nat Rev Cancer. 2012;12(3):181–95. doi: 10.1038/nrc3214. [DOI] [PMC free article] [PubMed] [Google Scholar]
- Portilla D, Dai G, Peters JM, Gonzalez FJ, Crew MD, Proia AD. Etomoxir-induced PPARalpha-modulated enzymes protect during acute renal failure. Am J Physiol Renal Physiol. 2000;278(4):F667–75. doi: 10.1152/ajprenal.2000.278.4.F667. [DOI] [PubMed] [Google Scholar]
- Rusyn I, Gatti DM, Wiltshire T, Kleeberger SR, Threadgill DW. Toxicogenetics: population-based testing of drug and chemical safety in mouse models. Pharmacogenomics. 2010;11(8):1127–36. doi: 10.2217/pgs.10.100. [DOI] [PMC free article] [PubMed] [Google Scholar]
- Rusyn I, Chiu WA, Lash LH, Kromhout H, Hansen J, Guyton KZ. Trichloroethylene: Mechanistic, epidemiologic and other supporting evidence of carcinogenic hazard. Pharmacol Ther. 2014;141:55–68. doi: 10.1016/j.pharmthera.2013.08.004. [DOI] [PMC free article] [PubMed] [Google Scholar]
- Scott CS, Jinot J. Trichloroethylene and cancer: systematic and quantitative review of epidemiologic evidence for identifying hazards. Int J Environ Res Public Health. 2011;8(11):4238–72. doi: 10.3390/ijerph8114238. [DOI] [PMC free article] [PubMed] [Google Scholar]
- Shirai N, Ohtsuji M, Hagiwara K, Tomisawa H, Ohtsuji N, Hirose S, Hagiwara H. Nephrotoxic effect of subchronic exposure to S-(1,2-dichlorovinyl)-L-cysteine in mice. J Toxicol Sci. 2012;37(5):871–8. doi: 10.2131/jts.37.871. [DOI] [PubMed] [Google Scholar]
- Song JZ, Ho JW. Simultaneous detection of trichloroethylene alcohol and acetate in rat urine by gas chromatography-mass spectrometry. J Chromatogr B Analyt Technol Biomed Life Sci. 2003;789(2):303–9. doi: 10.1016/s1570-0232(03)00101-6. [DOI] [PubMed] [Google Scholar]
- Storey JD, Tibshirani R. Statistical significance for genomewide studies. Proc Natl Acad Sci USA. 2003;100(16):9440–9445. doi: 10.1073/pnas.1530509100. [DOI] [PMC free article] [PubMed] [Google Scholar]
- U.S. EPA. Toxicological Review of Trichloroethylene (CAS No. 79-01-6): In Support of Summary Information on the Integrated Risk Information System (IRIS) Washington, DC: National Center for Environmental Assessment; 2011. [Google Scholar]
- Zaar K. Structure and function of peroxisomes in the mammalian kidney. Eur J Cell Biol. 1992;59(2):233–54. [PubMed] [Google Scholar]
Associated Data
This section collects any data citations, data availability statements, or supplementary materials included in this article.
Supplementary Materials
Data Availability Statement
Individual animal-level data for all quantitative endpoints is available publicly at the Mouse Phenome Database (http://phenome.jax.org/; accession ID: Rusyn6).