

Abstract
The disabled homolog 2 (DAB2) gene was recently identified as a tumor suppressor gene with its expression down-regulated in multiple cancer types. The role of DAB2 in lung tumorigenesis, however, is not fully characterized, and the mechanisms of DAB2 dysregulation in lung cancer are not defined. Here we show that low DAB2 levels in lung tumor specimens are significantly correlated with poor patient survival, and that DAB2 over-expression significantly inhibits cell growth in cultured lung cancer cells, indicating its potent tumor suppressor function. We next identify that microRNA miR-93 functions as a potent repressor of DAB2 expression by directly targeting the 3′UTR of the DAB2 mRNA. Using in vitro and in vivo approaches, we demonstrate that miR-93 over-expression plays an important role in promoting lung cancer cell growth, and that its oncogenic function is primarily mediated by down-regulating DAB2 expression. Our clinical investigations further indicate that high tumor levels of miR-93 are correlated with poor survival of lung cancer patients. The correlations of both low DAB2 and high miR-93 expression with poor patient survival strongly support the critical role of the miR-93/DAB2 pathway in determining lung cancer progression.
Keywords: DAB2, miRNA, miR-93, lung cancer
INTRODUCTION
The disabled homolog 2 (DAB2) gene encodes a mitogen-responsive phosphoprotein. Recent studies have indicated that DAB2 is down-regulated in multiple cancer types and has tumor suppressor function (1–9). In the context of lung cancer, down-regulation of DAB2 expression in lung tumor specimens relative to normal adjacent tissues has also been observed (10–12). In these studies, however, the function of DAB2 protein and the clinical significance of DAB2 down-regulation in lung cancer were not further investigated.
Given the increasing appreciation of DAB2 as an important tumor suppressor, the mechanisms underlying the down-regulation of DAB2 expression in cancer cells have been investigated. Hannigan, et al. showed that repressed expression of DAB2 in head and neck squamous-cell carcinoma (SCC) and vulval SCC involves hypermethylation of the DAB2 promoter region (9). In breast cancer, however, DAB2 promoter methylation is not frequent (11%), although there is a frequent loss of Dab2 protein (74%), suggesting that mechanisms other than epigenetic modification contribute to the loss of DAB2 expression (5). The role of microRNAs (miRNAs) in regulating expression of DAB2 in cancer cells has also been investigated (5, 13, 14). Chao, et al. demonstrated that miR-187 plays an important role in down-regulating DAB2 expression in ovarian cancer (13). Another miRNA, miR-145, was shown to directly target the DAB2 3′UTR, and is responsible for the reduced expression of DAB2 in cardiac myocytes following TGFβ1 treatment (14). Additional miRNAs are predicted to target the DAB2 3′UTR — whether these miRNAs are responsible for the reduction of DAB2 expression in cancer cells has not been investigated.
In an effort to address this question, we identified miR-93 as potentially targeting the 3′UTR of the DAB2 mRNA. The oncogenic function of miR-93 has been demonstrated in previous studies (15–18), but the “targetome” that mediates its oncogenic function has not been fully defined. miR-93 expression is up-regulated in various types of cancers including lung cancer (19–21). Coupled with the reduced expression of DAB2 in lung cancers, we speculated that aberrant over-expression of miR-93 contributes to the repressed expression of DAB2, and that DAB2 is an important target that mediates the oncogenic function of miR-93 in lung cancer.
In this study, we characterized the function of DAB2 in lung cancer cells, investigated the role of miR-93 in regulating DAB2 expression, and defined the clinical consequences of the dysregulation of the miR-93/DAB2 pathway in lung cancer patients.
RESULTS
Low levels of tumor DAB2 expression are correlated with poor patient survival in non-small cell lung cancer (NSCLC)
Several studies have indicated that decreased DAB2 expression in cultured lung cancer cells and lung tumor specimens is common (11, 12). The clinical significance of the decrease, however, has not been examined. We therefore investigated the correlation between DAB2 expression in lung tumor specimens and survival of NSCLC patients. As shown in Figure 1A, the patients were classified into two groups (high and low) based on tumor DAB2 mRNA levels. The average DAB2 mRNA levels of the two groups are significantly different (p < 0.0001). Kaplan-Meier survival analysis (Figure 1B–C) shows that patients with low tumor DAB2 levels have both shorter median overall survival (4.2 y) and shorter recurrence-free survival (2.5 y) compared to patients with high DAB2 expression (>10.2 y, p < 0.01, and 7.5 y, p = 0.04, respectively). Supplementary Table 1 shows that there is no significant difference in the distribution of patients by tumor stage in these two groups; this indicates that DAB2 expression levels in lung tumor specimens are not significantly correlated with disease stage, excluding the possibility that the poorer survival of patients with low DAB2 levels is caused by more advanced tumor stages in these patients. Overall, these results suggest that DAB2 is an independent marker for the aggressiveness of NSCLC.
Figure 1. Decreased tumor DAB2 expression levels are correlated with poor survival of NSCLC patients.

A, Patients with DAB2 mRNA levels in the highest and lowest quintiles were selected from the 245 NSCLC patients, defining the high and low DAB2 expression groups (n=50/group). The mean DAB2 mRNA levels are significantly different between the two patient groups. ****, p < 0.0001. B, Kaplan-Meier overall survival curves for the two groups of NSCLC patients. Median overall survival times in the low (green) and high DAB2 (red) groups were 4.2 y and > 10.2 y, respectively, with a hazard ratio of 0.36 (95% CI 0.16–0.69), and p < 0.01. C, Recurrence-free survival curves for the two groups. Median recurrence-free survival times in the low and high DAB2 groups were 2.5 y and > 7.5 y, respectively, with a hazard ratio of 0.53 (95% CI 0.29–0.96), and p = 0.04. Statistical significance was assessed by Mantel-Cox log-rank test.
Small cell lung cancer (SCLC) cells show more frequent and dramatic reduction of DAB2 expression than NSCLC cells
Previous studies have shown that DAB2 expression is reduced in lung tumors relative to normal lung tissues. No study, however, has examined the differential expression of DAB2 in different types of lung cancer. Lung cancer is classified into two major types – NSCLC and SCLC – according to histology, with SCLC exhibiting a much more aggressive phenotype. We therefore compared DAB2 mRNA levels in a panel of different types of lung cell lines. As shown in Figure 2, the average DAB2 level in NSCLC cell lines is significantly lower than that in normal lung cell lines (p = 0.04), consistent with previous findings (10–12). Interestingly, we found that the average DAB2 level in SCLC cell lines is much lower than in NSCLC (p = 0.02) and normal lung (p < 0.0001) cell lines. In addition, 93% of the SCLC cell lines (27 of 29) have DAB2 levels lower than the lowest value observed in normal lung cells, whereas only 28% of NSCLC cell lines (27 out of 96) show a similar decrease. This common and significant reduction of DAB2 expression in SCLC strongly suggests that loss of DAB2 expression contributes to the aggressive phenotype of SCLC.
Figure 2. DAB2 is differentially expressed in different types of lung cell lines.

Expression levels of DAB2 mRNA levels were measured using Illumina Human WG-6 V3 expression arrays in three groups of cell lines – SCLC (n=29), NSCLC (n=96), and immortalized normal lung cells (n=59) which include normal human bronchial epithelial cells (HBECs) and human small airway epithelial cells (HSAECs). After background subtraction and normalization of the raw intensity data, the DAB2 mRNA expression levels were calculated as relative signal intensity. Statistical significance was assessed by student t-test. *, p < 0.05; ****, p < 0.0001.
DAB2 is a potent repressor of cell growth in lung cancer cells in vitro
The cellular function of Dab2 protein in lung cancer has not been investigated previously. We therefore investigated the effects of DAB2 over-expression and knockdown on cell proliferation in cultured NSCLC cell line H1993. Figures 3A and 3C show that Dab2 protein levels are significantly increased by transfection of a DAB2 expression construct, and are successfully reduced by transfection of specific shRNA constructs against DAB2. As shown in Figures 3B and 3D, DAB2 over-expression significantly reduces cell proliferation — as measured by bromodeoxyuridine (BrdU) incorporation into DNA synthesis — and knockdown of DAB2 significantly promotes cell proliferation. Furthermore, knockdown of DAB2 expression leads to a reduction of the fraction of cells in the G1 and G2/M phases of the cell cycle (53.8% to 44.7% and 12.8% to 9.3%, respectively) and an increase in the fraction in the S phase (31.4% to 44.5%) (Figure 3E). These results indicate that Dab2 protein inhibits growth of lung cancer cells by inducing cell arrest at the G1/S checkpoint of the cell cycle, which is consistent with previous findings in breast cancer cells (22).
Figure 3. DAB2 potently represses lung cancer cell growth by inducing G1/S arrest in vitro.


A, H1993 cells were stably transfected with either pcDNA3.1 vector containing DAB2 or a null pcDNA3.1 vector without a DAB2 insert. Expression levels of Dab2 protein were detected by western blot using an anti-Dab2 antibody, with β-actin levels used as a loading control. B, BrdU incorporation assay as a function of DAB2 over-expression. C, Retroviral pGFP-V-RA-DAB2-shRNA expression constructs were used to knock down endogenous DAB2 expression. H1993 cell lines with stably integrated DAB2-shRNA expression or control shRNA constructs were generated as described in the Materials and Methods. Expression levels of Dab2 protein were detected as above. D, BrdU incorporation as a function of DAB2 knockdown. E, Cell cycle analysis as a function of DAB2 knockdown. The fractions of cells in G1, S and G2 phases were estimated using the Watson pragmatic model. Similar results were obtained from three independent experiments. *, p < 0.05; **, p < 0.01.
miR-93 down-regulates DAB2 expression by targeting the 3′UTR of DAB2 and functions as an oncogene in lung cancer cells
Our above results suggest that reduced DAB2 expression contributes to aggressive lung cancer growth. Molecular pathways leading to the down-regulation of DAB2 expression are potentially important oncogenic mechanisms for lung cancer development. To determine whether miRNAs play a role in down-regulating DAB2 expression in lung cancer, we combined the TargetScan (23, 24) and miRmate (19, 25) programs to identify miRNAs that potentially target the DAB2 3′UTR. 9 miRNAs were identified (Table 1), including two miRNAs (miR-145 and miR-187) that have been previously shown to target the DAB2 3′UTR (13, 14). In order to directly evaluate the potential clinical relevance of the identified miRNAs in regulating DAB2 expression, we examined the correlation of the miRNA levels with DAB2 expression in lung tumor specimens. Among these miRNAs, only the expression of miR-93 shows a significant negative correlation with DAB2 expression (Table 1), highlighting the potential clinical significance of miR-93 as a determinant of DAB2 expression in lung cancer cells.
Table 1. Expression of miR-93 — but not other miRNAs that target DAB2 — is significantly anti-correlated with DAB2 expression in lung tumor specimens.
Using a TargetScan PCT score > 0.1 as a cutoff, 9 miRNAs were identified to target the 3′UTR of DAB2. (1), TargetScan predictions, showing the predicted context score, probability of conserved targeting (PCT) score, and the prediction rank based on the PCT score (23, 24, 42). (2), miRmate predictions showing the predicted interaction score, as described previously (19). (3), The correlations between miRNAs and DAB2 mRNA levels were assessed by Pearson correlation, with p < 0.05 considered statistically significant.
| miRNA | (1) TargetScan
|
(2) miRmate
|
(3) correlation | |||
|---|---|---|---|---|---|---|
| context | PCT | rank | score | r | p | |
|
|
|
|
|
|||
| miR-145 | −0.63 | 0.94 | 1 | 77.0 | 0.08 | 0.19 |
| miR-93 | −0.20 | 0.86 | 2 | 81.0 | −0.15 | 0.02 |
| miR-26a | −0.10 | 0.55 | 3 | 87.0 | 0.11 | 0.09 |
| miR-26b | −0.10 | 0.55 | 3 | 70.0 | 0.14 | 0.03 |
| miR-124 | −0.13 | 0.36 | 4 | 79.0 | 0.02 | 0.72 |
| miR-187 | −0.26 | 0.24 | 5 | 60.0 | −0.04 | 0.52 |
| miR-203 | −0.26 | 0.19 | 6 | 56.5 | < 0.01 | 0.96 |
| miR-153 | −0.18 | 0.14 | 7 | 69.5 | −0.04 | 0.57 |
| miR-143 | −0.14 | 0.11 | 8 | 67.0 | 0.07 | 0.29 |
We and others have previously shown that miR-93 is over-expressed in lung cancers (19, 26), further suggesting that aberrant over-expression of miR-93 contributes to the repression of DAB2 expression in lung cancer. We first examined the function of miR-93 in regulating lung cancer proliferation by over-expressing or knocking down miR-93 in lung cancer cells in vitro. Figure 4A–B shows that miR-93 over-expression increases cell proliferation, whereas miR-93 knockdown with either a miR-93 inhibitor (Dharmacon) or a miR-93 sponge decreases cell proliferation. The results demonstrate the growth-promoting function of miR-93 in lung cancer cells. Figure 4C–D further shows that miR-93 over-expression in lung cancer cells significantly promotes long-term cell growth as measured by colony formation assay.
Figure 4. Over-expression of miR-93 promotes lung cancer cell proliferation in vitro.

H1993 cells were transfected with either the miR-93 expression construct, miR-93 inhibitor, miR-93 sponge vector, or corresponding controls. A, Expression levels of miR-93 measured by qRT-PCR. B, BrdU incorporation as a function of miR-93 over-expression or knockdown. C–D, Colony formation and quantification of colonies as function of miR-93 over-expression. **, p < 0.01; ***, p < 0.001; ****, p < 0.0001.
We next investigated whether miR-93 directly regulates DAB2 expression. As shown in Figure 5A, miR-93 is predicted to interact with a specific sequence in the 3′UTR of DAB2. We confirmed this interaction by luciferase reporter assay (Figure 5B). We further examined whether miR-93 down-regulates Dab2 protein expression and inhibits its function. Zhoul, et al. showed that Dab2 directly binds and inhibits c-Src phosphorylation in prostate cancer, which subsequently leads to inhibition of Akt phosphorylation and cell proliferation (27), We therefore examined the biological function of the miR-93/DAB2 interaction by assessing the effect of miR-93 over-expression on Dab2-mediated inhibition of Akt phosphorylation and cell proliferation. As shown in Figure 6A–B, DAB2 over-expression by means of a DAB2-3′UTR expression construct dramatically decreases the levels of phosphorylated Akt (pAkt) and significantly inhibits cell proliferation. miR-93 over-expression increases pAkt levels, and importantly, rescues the inhibitory effect of DAB2-3′UTR on Akt phosphorylation and on cell proliferation, but does not dramatically rescue the inhibitory effects of the DAB2 construct with no 3′UTR. These results indicate that miR-93 functions as a repressor of DAB2 expression by directly targeting the 3′UTR of DAB2, and suggest that DAB2 is the major target of miR-93 that mediates its growth-promoting function. Similar results were obtained with the SCLC cell line H524 (Figure 6C–D). Figure 6E–F shows that inhibiting Akt phosphorylation with an Akt1/2 kinase inhibitor (Sigma) significantly decreases cell viability in control H1993 cells, and that combination of DAB2 over-expression and Akt inhibitor show an additive effect on inhibiting Akt phosphorylation and cell growth. These results further support an important role for Akt phosphorylation in promoting H1993 proliferation and demonstrate that the growth-inhibiting function of Dab2 is mediated by its inhibition of Akt phosphorylation.
Figure 5. miR-93 down-regulates DAB2 expression by directly targeting the 3′UTR of the DAB2 mRNA.

A, The predicted interaction of miR-93 and the candidate target site in the DAB2 3′UTR with the predicted free energy of hybridization. The seed sequence is highlighted in red. B, H1993 cells were co-transfected with the indicated vectors. After 48 h of transfection, cells were lysed and luciferase activity was measured. Shown are normalized luciferase activities of different treatment groups. Differences in luciferase activity were assessed by two-tailed t-test. ***, p < 0.001.
Figure 6. miR-93 over-expression abrogates the inhibitory effect of DAB2-3′UTR on AKT phosphorylation and on cell proliferation.
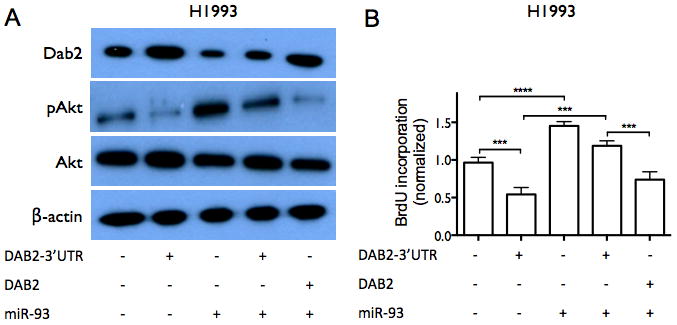


A, H1993 cells were transiently transfected with equal amounts of either control pcDNA3.1 vectors, pcDNA3.1-DAB2-3′UTR, pCMV6-miR-93, pcDNA3.1-DAB2-3′UTR/pCMV6-miR-93, or pcDNA3.1-DAB2/pCMV6-miR-93 as indicated. Cell lysates were harvested after 48 hrs. Protein expression levels of Dab2, total Akt, and pAkt were measured by western blot, with β-actin as a loading control. B, H1993 cells were transfected as above. After 48 hrs, cell proliferation was measured by BrdU incorporation assay. C–D, Effect of miR-93 and DAB2 over-expression on Dab2 and Akt protein expression (C) and on cell proliferation (D) in SCLC cell line H524, as above. E, Effect of Akt kinase inhibitor and DAB2 over-expression on Dab2 and Akt protein expression. F, Effect of Akt kinase inhibitor and DAB2 over-expression on cell proliferation in H1993 cells. G–H, Effect of DAB2 over-expression (F) or knockdown (G) on cell viability in a panel of lung cancer cell lines. I–J, Effect of miR-93 over-expression (I) or knockdown (J) on cell viability in a panel lung cancer cell lines. **, p < 0.01; ***, p < 0.001; ****, p < 0.0001.
To determine whether miR-93 and its target DAB2 have a general effect on regulating lung cancer cell survival and growth, we examined the over-expression and knockdown of miR-93 and DAB2 in a panel of lung cancer cell lines with different genetic backgrounds, including both NSCLC and SCLC cell lines (Suppl. Table 2). As shown in Figures 6G–6J, both over-expression of DAB2 and knockdown of miR-93 decrease cell viability in the majority of the cell lines — although the response of the cell lines to such manipulations vary greatly — whereas both DAB2 knockdown and miR-93 over-expression increase cell survival in the majority of the cell lines.
DAB2 is the primary target that mediates the oncogenic function of miR-93 in lung cancer
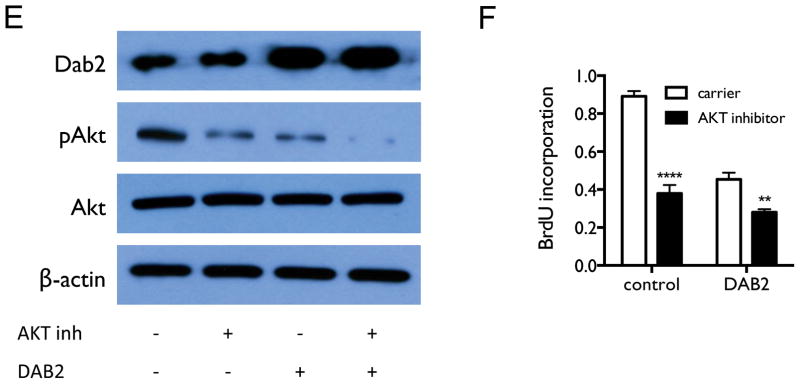
miR-93 has been demonstrated to target multiple genes. Our in vitro investigation suggests that DAB2 is the major target that mediates the growth-promoting function of miR-93 in lung cancer cells (Figures 6A–D). In order to further examine the clinical significance of this regulatory pathway in lung cancers, we analyzed the correlation of miR-93 levels with DAB2 expression, as well as with expression of other previously identified targets of miR-93 (15, 17–19, 28–36), in a panel of 245 lung tumor specimens. As shown in Table 2, although expression levels of multiple target genes are negatively correlated with miR-93 levels, only the correlations with DAB2 and FUS1 reach statistical significance (p < 0.05). However, further examination shows that FUS1 levels are not significantly correlated with survival in lung cancer patients (Supplementary Figure 1), suggesting the oncogenic function of miR-93 in lung cancer is primarily mediated by down-regulating expression of DAB2, and not of FUS1. To further examine whether the anti-correlation between miR-93 and DAB2 expression is recapitulated in cultured lung cell lines, we measured the expression levels of miR-93 and DAB2 in a panel of 45 lung cell lines by expression array. As shown in Figure 7, miR-93 and DAB2 levels are negatively correlated (r = −0.15). However, the correlation does not reach statistical significance (p = 0.17), likely due to the small sample size. Future investigation in a larger panel of cell lines is warranted.
Table 2. mRNA levels of DAB2 and FUS1 — but not other miR-93 targets — are significantly inversely correlated with miR-93 expression levels in lung tumor specimens.
Correlations between miR-93 levels and those of previously identified miR-93 target genes were assessed in lung tumor specimens by Pearson correlation. Shown are the correlation coefficients (r) and p values.
| Gene | r | p |
|---|---|---|
| DAB2 | −0.15 | 0.02 |
| FUS1 | −0.15 | 0.02 |
| ZBTB4 | −0.06 | 0.37 |
| TP53INP1 | −0.05 | 0.45 |
| SMAD7 | −0.05 | 0.41 |
| BCL2L11 | −0.03 | 0.69 |
| E2F1 | −0.03 | 0.61 |
| VEGFA | −0.02 | 0.75 |
| ITGB8 | 0.03 | 0.61 |
| LATS2 | 0.01 | 0.89 |
| SP7 | 0.02 | 0.72 |
| F3 | 0.05 | 0.43 |
| IL-8 | 0.06 | 0.35 |
| AICDA | 0.06 | 0.32 |
| CDKN1A | 0.08 | 0.20 |
| PTEN | 0.09 | 0.15 |
Figure 7. Correlation of DAB2 mRNA levels with miR-93 levels in lung cell lines.
Heatmap presentation of the expression of miR-93 and DAB2 mRNA in 45 cell lines, with blue indicating relative under-expression and yellow indicating relative over-expression. The correlation between miR-93 and DAB2 mRNA levels was assessed by Pearson correlation.
miR-93 over-expression promotes tumor growth in lung tumor xenografts
In order to further characterize the oncogenic function of miR-93 in vivo, we generated subcutaneous xenografts using H1993 cells stably transfected with either miR-93 or a control construct. As shown in Figures 8A–C, miR-93 over-expression significantly promotes tumor growth compared to controls. Figures 8D–E show that miR-93 over-expression increases tumor miR-93 levels, decreases the expression of Dab2 protein and increases expression of cell proliferation marker Ki67 in tumor cells. These results further demonstrate the strong growth-promoting function of miR-93 in lung cancer.
Figure 8. miR-93 over-expression promotes tumor growth in mouse tumor xenografts.

A, Mice injected with H1993 cells stably over-expressing miR-93 or control H1993 cells with stably integrated empty vector. Images were taken at the end point of the experiment. B, Tumors in each group. C, Time-dependent tumor growth curves of the different treatment groups. D, Tumor levels of miR-93, measured by qRT-PCR. E, Tumor levels of Dab2 and Ki67 proteins, measured by western blot. *, p < 0.05; **, p < 0.01; ***, p < 0.001; ****, p < 0.0001.
High levels of miR-93 are correlated with poor patient survival
Our above results not only demonstrate that over-expression of miR-93 is an important mechanism down-regulating DAB2 expression in lung cancer cells, but reciprocally, they indicate that DAB2 is the primary target of miR-93 that mediates its oncogenic function. To further evaluate the clinical relevance of the miR-93/DAB2 regulatory pathway, we assessed the correlation between miR-93 levels and survival of NSCLC patients. Patients were classified into two groups based on tumor miR-93 levels (Figure 9A). Kaplan-Meier survival analysis (Figures 9B–C) shows that patients with high miR-93 levels have both shorter median overall survival (4.3 y) and shorter median recurrence-free survival (3.4 y) compared to patients with low miR-93 expression (>10.2 y, p = 0.04 and, 8.9 y, p = 0.64, respectively), although the difference in recurrence-free survival does not reach statistical significance. Supplementary Table 1 shows that there is no significant difference in the distribution of patients by tumor stage in these two groups, excluding the possibility that the poorer survival of patients with high miR-93 levels is driven by more advanced tumor stages. These results, coupled with our findings that low levels of DAB2 in lung tumors are correlated with poor patient survival, strongly support a critical role for miR-93-directed down-regulation of DAB2 expression in determining the prognosis of lung cancer patients.
Figure 9. High levels of miR-93 correlate with poor patient survival.

A, Patients were stratified by miR-93 levels, with the top and bottom quintiles of the 245 NSCLC patients defining the high and low miR-93 expression groups (n=50 per group). The mean miR-93 levels are significantly different between the two groups, assessed by two-tailed t-test. ****, p < 0.0001. B, Overall survival curves for the two groups. Median overall survival times in the low (green) and high miR-93 (red) groups were > 10.2 y and 4.3 y, respectively, with a hazard ratio of 2.00 (95% CI 1.03–3.91), and p = 0.04. C, Recurrence-free survival curves for the two groups. Median recurrence-free survival times in the low and high miR-93 groups were 8.9 y and 3.4 y, respectively, with a hazard ratio of 1.16 (95% CI 0.62–2.15), and p = 0.64. Statistical significance was assessed by Mantel-Cox log-rank test.
DISCUSSION
The role of DAB2 in oncogenesis has been investigated in several cancer types (1–9). Loss of DAB2 expression has been observed in lung cancers (10–12). However, no study has been conducted to define the cellular function of DAB2 and to evaluate the clinical significance of loss of DAB2 expression in lung cancer. Here we provide the first integrated investigation of the function of DAB2 in lung cancer at both cellular and clinical levels, and demonstrate that DAB2 functions as a potent repressor of cell proliferation in lung cancer and that down-regulation of DAB2 expression in lung cancer is associated with poor prognosis of lung cancer patients.
Another important finding of our study is that SCLC cells show a much more frequent and dramatic reduction of DAB2 expression than NSCLC. This is of interest because SCLC is the most aggressive form of lung cancer (37, 38) and progresses much more rapidly than NSCLC. Although this in vitro finding needs to be validated in a clinical context, the much more common and dramatic reduction of DAB2 expression in SCLC cells strongly suggests that loss of DAB2 may be a critical mechanism that contributes to the aggressive phenotype of SCLC. Further studies are certainly needed to determine the specific role of DAB2 in SCLC tumorigenesis.
The down-regulation of DAB2 expression in cancer cells can be caused by multiple mechanisms, including hypermethylation of the DAB2 promoter (9) and, as we show here, through miRNA regulation. We found that miR-93 inhibits DAB2 expression by directly targeting the 3′UTR of the DAB2 mRNA. We further demonstrated that miR-93 levels in lung tumor specimens are significantly anti-correlated with DAB2 levels. Multiple miRNAs are predicted to target the DAB2 3′UTR, and miR-145 and miR-187 have been shown to down-regulate DAB2 expression in other cancers (13, 14). However, our investigation in lung tumor specimens shows that expression levels of these miRNAs are not significantly correlated with DAB2 levels (Table 1). This indicates that, among the miRNAs that regulate DAB2 expression, miR-93 plays the primary role in determining DAB2 expression in lung cancer.
Another important finding of our study is that DAB2 is the primary target that mediates the oncogenic function of miR-93 in lung cancers. Previous studies have identified multiple miR-93 targets that mediate its oncogenic function in several different cancer types (17, 18, 20, 21, 28, 29). However, our analysis of lung tumor specimens shows that only expression of DAB2 and FUS1 are significantly negatively correlated with miR-93 levels. Our previous work in lung cancer showed that miR-93 targets the 3′UTR of tumor suppressor gene FUS1 (19). The present study further revealed a significant anti-correlation between FUS1 and miR-93 levels in lung tumor specimens, confirming the role of miR-93 in regulating FUS1 expression in lung cancer. Previous studies have shown that loss of Fus1 protein expression in lung cancer is associated with poor patient survival (39). In the current study, however, the correlation between FUS1 expression and patient survival does not reach statistical significance, possibly due to the small sample size, although low levels of FUS1 appear to be associated with poor recurrence-free survival. Even with this small sample size, the correlations of DAB2 with patient survival still reach statistical significance. This further highlights that, among the many targets of miR-93, DAB2 is the major target that mediates the oncogenic function of miR-93. Altogether, our study defines miR-93/DAB2 as the central element in the miR-93/DAB2-associated miRNA:target interaction network that contributes to lung tumorigenesis (Figure 10). The associations of both DAB2 and miR-93 levels with patient survival further demonstrate the relevance of the miR-93/DAB2 pathway in lung tumorigenesis. For recurrence-free survival, however, although the median survival time in the high miR-93 group is lower than that in the low miR-93 group (3.4 y vs. 8.9 y) — a trend consistent with the association of DAB2 levels with survival — the association between miR-93 levels and recurrence-free survival does not reach statistical significance. This is reasonable, given the fact that multiple mechanisms are involved in regulating DAB2 expression (5, 9, 13, 14). We speculate that it is the combination of these multiple mechanisms of regulation that contribute to patient survival, explaining the weaker correlation of miR-93 with patient survival compared to DAB2.
Figure 10. Model for the role of the miR-93/DAB2-associated miRNA:target interaction network in lung tumorigenesis.

miR-93 targets multiple genes and DAB2 is a target of multiple miRNAs. Among the miRNAs that target DAB2, miR-93 plays the major role in down-regulating DAB2 expression in lung cancer cells. Reciprocally, DAB2 is the primary target that mediates the growth-promoting function of miR-93 in lung cancer cells. †, predicted interactions that have not been experimentally validated.
The mechanisms underlying aberrant over-expression of miR-93 in cancer cells remain to be determined. miR-93 is intragenic, located in the intron of the MCM7 gene and is part of a cluster containing two other miRNAs (miR-25 and miR-106b). miR-93 levels are highly correlated with levels of these miRNAs, but are correlated with levels of its host gene MCM7 to a much lesser extent (Supplementary Table 3). These results suggest that over-expression of the miRNA cluster may be partially driven by mechanisms independent of those driving MCM7 expression. One possibility is that this miRNA cluster is a target of a transcription factor (TF) independent of its host gene. We looked for potential TF binding sites near these miRNAs and identified 58 TFs predicted to regulate their transcription, among which 10 TFs have expression levels positively correlated with their expression (Supplementary Table 4). Among these TFs, MYC exhibits significant correlation with the miRNA cluster, but not with MCM7. This suggests that MYC might drive transcription of the miRNA cluster independent from that of the host gene, and that increased MYC activity in lung cancer cells might be the mechanism that leads to aberrant over-expression of miR-93. Further investigations are certainly warranted to test this hypothesis.
In summary, our study defines a novel oncogenic pathway in lung cancer that is mediated by miR-93-directed down-regulation of DAB2. Our clinical investigations show that aberrant expression of both elements in this pathway is associated with poor patient survival, highlighting the critical role of this pathway in lung tumorigenesis. Furthermore, our comprehensive analyses show that, in the miR-93/DAB2-associated miRNA:target regulatory network (Figure 10), miR-93-directed DAB2 down-regulation stands out as the most important element that contributes to lung tumorigenesis. Given the increasing appreciation of the clinical value of miRNAs in cancer therapeutics and diagnostics, this novel miRNA-directed oncogenic pathway clearly warrants further investigation, in order to determine whether therapeutic tools targeting this pathway can be developed for lung cancer treatment and whether this pathway provides one or more prognostic biomarkers for lung cancer patient survival.
MATERIALS AND METHODS
Cell culture
Cell lines were obtained from the Hamon Center for Therapeutic Oncology Research at UT Southwestern Medical Center at Dallas. Lung cancer cells were grown in RPMI-1640 medium (Life Technologies, Carlsbad, CA) supplemented with 5% fetal bovine serum (Atlanta Biologicals Inc., Lawrenceville, GA). Normal lung epithelial cell lines were grown in GIBCO® KSFM medium supplemented with bovine pituitary extract and recombinant human epidermal growth factor (Life Technologies).
Animal experiments
Six- to eight-week-old female athymic nude Foxn1nu (nu/nu) mice were purchased from Harlan-Sprague-Dawley (Indianapolis, IN). To induce tumor formation, 2 × 10⁶ cells in 200 μl PBS were injected subcutaneously into the right flanks of the mice. Tumors volumes were measured using calipers every 3 days. At the end of the study, tumor samples were snap frozen in liquid nitrogen and stored at −80°C. For measuring tumor miR-93 levels, RNA was isolated from tumor samples using the mirVana™ miRNA Isolation Kit (Ambion) and miR-93 levels were measured by qRT-PCR. For measuring tumor protein levels, tumors were lysed using RIPA buffer. Lysates from each treatment group were pooled and proteins were detected by western blot using specific antibodies. Animal protocols were approved by the Institutional Animal Care and Use Committee of the University of Texas Health Science Center at San Antonio.
Construction of the pcDNA3.1-DAB2-3′UTR and pcDNA3.1-DAB2 expression vectors
The coding region of the DAB2 mRNA with and without the 3′UTR was amplified by PCR from human genomic DNA and a DAB2 human cDNA clone (Origene, Rockville, MD), respectively. The amplified sequences were inserted into the EcoRI and XhoI restriction sites of the multiple cloning site of expression vector pcDNA3.1 and verified by sequencing.
Construction of viral expression vectors and virus production
The miR-93 expression construct was made as described previously (19), and then subcloned into lentiviral shuttle vector pLenti6/V5 (Invitrogen). The shuttle vector was co-transfected with Virapower packaging mix into 293FT cells to produce lentivirus. Retroviral DAB2-shRNA expression constructs were generated using pGFP-V-RS (Origene). The pGFP-V-RS-DAB2-shRNA and pGFP-V-RS constructs were co-transfected with pAmpho (Clontech) and psPAX2 (Addgene, Cambridge, MA)(40) into 293FT cells (Invitrogen/Life Technologies). Virus-containing media was collected, filtered and added to target cells for infection in the presence of polybrene. The target sequences for shRNA1 and shRNA2 are GTTGTAATGATGACTATCC and AGGCAGAAGGACTGCTAA, respectively.
Construction of the miR-93 sponge
A miR-93 sponge expression vector was constructed to knock down endogenous expression of miR-93 using a protocol modified from Kluiver, et al. (41). Briefly, six repeats of a sequence antisense to miR-93 (CTACCTGCACGGGTCGCACTTTG) were cloned into pLenti6/V5. Lentivirus was then generated as above.
Transfection/infection and selection of cells with stably integrated expression constructs
Cells were transfected with the specified expression vector using Lipofectamine 2000 (Invitrogen/Life Technologies) or infected with virus. After 48 h, antibiotic (G418 at 800 ng/ml for pcDNA3.1; puromycin at 2.5 μg/ml for pGFP-V-RS; blasticidin at 10 μg/ml for pLenti6/V5) was added to select cells with stably integrated expression constructs. Stable cell lines were established within 3–4 weeks.
Colony formation assay
1000 cells were seeded on each 10 cm dish. After 14 days, colonies were visualized by staining with 1% crystal violet. Colonies were counted using ImageJ (NIH, Bethesda, MD) and differences were assessed by two-tailed t-test.
BrdU incorporation assay
Cell were seeded in 96-well plates and treated as indicated. After culturing for 72 h, cells were incubated with 10 μM BrdU (Roche, Indianapolis, IN), and then fixed with FixDenat solution. Anti-BrdU-POD was added to fixed cells and substrate solution containing tetramethylbenzidine was used to detect and quantify the amount of BrdU incorporation.
Cell viability assay
Cells were plated in 96-well format and treated as indicated. After culturing for 72 h, cell viability was determined using the CellTiter-Glo® Luminescent Cell Viability Assay (Promega).
Cell cycle analysis
Cells were detached and collected by centrifuging at 1000 rpm for 5 min. Cells were then washed with 1X PBS and fixed with 1X PBS containing 70% ethanol at 4°C. After 1 h, cells were harvested and treated with 50 μg/ml propidium iodide and 100 μg/ml RNase A in 1X PBS for 40 min at 37°C. Cell cycle data were collected on a BD FACSCanto II flow cytometer (BD Biosciences, San Jose, CA). Data were analyzed using FlowJo version 9.1 (TreeStar Inc., Ashland, OR).
Quantitative RT-PCR (qRT-PCR)
miR-93 expression was measured on an ABI PRISM 7900 Sequence Detection System using TaqMan® microRNA Assays (Life Technologies) with RNU19 RNA expression as a loading control.
Western blots
Cell lysates were prepared using RIPA buffer. Protein concentration was determined using the Pierce BCA assay (Thermo Fisher, Rockford, IL). Equal amounts of cell lysate were resolved by SDS-PAGE and transferred to Immun-Blot PVDF membranes (Bio-Rad Hercules, CA). Membranes were blocked and probed with the following antibodies: mouse anti-DAB2 (BD Biosciences), rabbit anti-Akt (Cell Signaling, Danvers, MA), rabbit anti-phospho-Akt (Santa Cruz, Dallas, TX), rabbit anti-Ki67 (Millipore, Billerica, MA) or mouse anti-β-actin (Sigma, St. Louis). Bound antibodies were detected with secondary HRP-conjugated antibodies (Santa Cruz) and visualized by enhanced chemiluminescent (ECL) substrate (Pierce).
Luciferase reporter assay
The segment of the wildtype DAB2 3′UTR (DAB2-3′UTR) containing the predicted miR-93 target site was cloned from human genomic DNA. The mutant construct (DAB2-mut-3′UTR), with the part of the target site corresponding to the seed sequence of miR-93 (GCACUUU) replaced by AGCUCUA, was made using the QuikChange Site-Directed Mutagenesis Kit (Stratagene, Santa Clara, CA). The 3′UTRs were cloned downstream of the firefly luciferase CDS into the pmirGLO dual-luciferase reporter construct (Promega), a vector that contains both firefly and Renilla luciferase cDNAs under the control of separate promoter/terminator systems. The firefly luciferase was used as the primary reporter to monitor miRNA regulation of the target 3′UTR, with decreased firefly luciferase activity indicating that the miRNA interacts specifically with the cloned 3′UTR. The Renilla luciferase served as an internal control for normalizing transfection efficiency and cell viability. H1993 cells were co-transfected with equal concentrations of the luciferase reporter vectors and miR-93 expression vector (0.8ng/ul). Firefly and Renilla luciferase activities were measured after 72 h, using the Dual-Glo® Luciferase Assay System (Promega). Firefly luciferase activity was normalized to Renilla luciferase activity to evaluate the effect of miR-93.
mRNA and miRNA expression profiling of tumor specimens
10–20 μm thick serial sections of surgically resected NSCLC specimens were obtained using a Leica cryostat and homogenized using an Omni TH homogenizer (Omni International, Kennesaw, GA). Total RNA was isolated using TRIzol Reagent (Life Technologies). miRNA expression profiling was conducted as described previously (25). mRNA expression profiling was done using the Illumina mRNA WG-6 v3 microarray platform (Illumina Inc., San Diego, CA).
Kaplan-Meier survival analysis
To examine whether tumor DAB2 mRNA levels are associated with lung cancer patient survival, we stratified patients by tumor DAB2 mRNA levels. The high and low DAB2 groups were defined to include patients with tumor DAB2 levels ranking in the top and bottom quintiles of the population (n=50 per group). The statistical significance of the difference in tumor DAB2 levels between the two groups was assessed by Student’s t-test. Overall and recurrence-free survival curves were plotted using GraphPad Prism 5, and statistical significance was assessed by Mantel-Cox log-rank test. The associations of tumor miR-93 and FUS1 mRNA levels with patient survival were examined using the same approach as that used for DAB2.
Supplementary Material
A, Patients with FUS1 mRNA levels in the highest and lowest quintiles were selected from the 245 NSCLC patients, defining the high and low FUS1 expression groups (n=50/group). The mean FUS1 mRNA levels are significantly different between the two patient groups. ****, p < 0.0001. B, Overall survival curves for the two groups. Median overall survival times in the low (green) and high FUS1 (red) groups were 6.7 y and 7.4 y, respectively, with a hazard ratio of 0.81 (95% CI 0.42–1.56), and p = 0.53. C, Recurrence-free survival curves for the two groups. Median recurrence-free survival times in the low and high miR-93 groups were 3.2 y and 5.5 y, respectively, with a hazard ratio of 0.73 (95% CI 0.39–1.34), and p = 0.31. Statistical significance was assessed by Mantel-Cox log-rank test.
Statistical differences in the distribution of patients by tumor stage between groups were assessed by chi-squared test.
Shown are the cell line names, tumor subtypes from which the cell lines are derived, ages and genders of the patients, and identified mutations in the TP53, CDKN2A and KRAS genes. UNK, unknown; WT, wildtype; del, deletion.
Shown are correlation coefficients (r) and p values, based on Pearson correlation.
Correlations between expression of candidate transcription factors and expression of the miR-93/miR-25/miR-106b cluster and its host gene MCM7 in 245 NSCLC patient specimens were assessed by Pearson correlation. Shown are the correlation coefficients (r) and p values.
Acknowledgments
The authors thank Vivienne Rebel and Nicholas Dybdal-Hargreaves for critical reading of the manuscript.
GRANT SUPPORT
This work was supported in part by R01 CA129632 (A. Pertsemlidis) and Lung Cancer SPORE P50 CA70907 (J. D. Minna and I. I. Wistuba) from the NCI, W81XWH-07-1-0306 from the Department of Defense (I. I. Wistuba), Academic Excellence Grant EDUD-7824-021007-US (A. Pertsemlidis) from Sun Microsystems, and Cancer Center Support Grants P30 CA054174, P30 CA142543 and P30 CA016672.
Footnotes
DISCLOSURE OF POTENTIAL CONFLICT OF INTEREST
The authors disclose no potential conflicts of interest.
References
- 1.Karam JA, Shariat SF, Huang HY, Pong RC, Ashfaq R, Shapiro E, et al. Decreased DOC-2/DAB2 expression in urothelial carcinoma of the bladder. Clin Cancer Res. 2007;13(15 Pt 1):4400–6. doi: 10.1158/1078-0432.CCR-07-0287. [DOI] [PubMed] [Google Scholar]
- 2.Mok SC, Chan WY, Wong KK, Cheung KK, Lau CC, Ng SW, et al. DOC-2, a candidate tumor suppressor gene in human epithelial ovarian cancer. Oncogene. 1998;16(18):2381–7. doi: 10.1038/sj.onc.1201769. [DOI] [PubMed] [Google Scholar]
- 3.Fazili Z, Sun W, Mittelstaedt S, Cohen C, Xu XX. Disabled-2 inactivation is an early step in ovarian tumorigenicity. Oncogene. 1999;18(20):3104–13. doi: 10.1038/sj.onc.1202649. [DOI] [PubMed] [Google Scholar]
- 4.Tseng CP, Ely BD, Li Y, Pong RC, Hsieh JT. Regulation of rat DOC-2 gene during castration-induced rat ventral prostate degeneration and its growth inhibitory function in human prostatic carcinoma cells. Endocrinology. 1998;139(8):3542–53. doi: 10.1210/endo.139.8.6159. [DOI] [PubMed] [Google Scholar]
- 5.Bagadi SA, Prasad CP, Srivastava A, Prashad R, Gupta SD, Ralhan R. Frequent loss of Dab2 protein and infrequent promoter hypermethylation in breast cancer. Breast Cancer Res Treat. 2007;104(3):277–86. doi: 10.1007/s10549-006-9422-6. [DOI] [PubMed] [Google Scholar]
- 6.Anupam K, Tusharkant C, Gupta SD, Ranju R. Loss of disabled-2 expression is an early event in esophageal squamous tumorigenesis. World J Gastroenterol. 2006;12(37):6041–5. doi: 10.3748/wjg.v12.i37.6041. [DOI] [PMC free article] [PubMed] [Google Scholar]
- 7.Yang DH, Fazili Z, Smith ER, Cai KQ, Klein-Szanto A, Cohen C, et al. Disabled-2 heterozygous mice are predisposed to endometrial and ovarian tumorigenesis and exhibit sex-biased embryonic lethality in a p53-null background. Am J Pathol. 2006;169(1):258–67. doi: 10.2353/ajpath.2006.060036. [DOI] [PMC free article] [PubMed] [Google Scholar]
- 8.Calvisi DF, Ladu S, Gorden A, Farina M, Lee JS, Conner EA, et al. Mechanistic and prognostic significance of aberrant methylation in the molecular pathogenesis of human hepatocellular carcinoma. J Clin Invest. 2007;117(9):2713–22. doi: 10.1172/JCI31457. [DOI] [PMC free article] [PubMed] [Google Scholar]
- 9.Hannigan A, Smith P, Kalna G, Lo Nigro C, Orange C, O’Brien DI, et al. Epigenetic downregulation of human disabled homolog 2 switches TGF-beta from a tumor suppressor to a tumor promoter. J Clin Invest. 2010;120(8):2842–57. doi: 10.1172/JCI36125. [DOI] [PMC free article] [PubMed] [Google Scholar]
- 10.Wikman H, Kettunen E, Seppanen JK, Karjalainen A, Hollmen J, Anttila S, et al. Identification of differentially expressed genes in pulmonary adenocarcinoma by using cDNA array. Oncogene. 2002;21(37):5804–13. doi: 10.1038/sj.onc.1205726. [DOI] [PubMed] [Google Scholar]
- 11.Xu HT, Yang LH, Li QC, Liu SL, Liu D, Xie XM, et al. Disabled-2 and Axin are concurrently colocalized and underexpressed in lung cancers. Hum Pathol. 2011;42(10):1491–8. doi: 10.1016/j.humpath.2011.01.004. [DOI] [PubMed] [Google Scholar]
- 12.Xu HT, Xie XM, Li QC, Liu SL, Dai SD, Liu Y, et al. Atonal homolog 1 expression in lung cancer correlates with inhibitors of the Wnt pathway as well as the differentiation and primary tumor stage. APMIS. 2013;121(2):111–9. doi: 10.1111/j.1600-0463.2012.02946.x. [DOI] [PubMed] [Google Scholar]
- 13.Chao A, Lin CY, Lee YS, Tsai CL, Wei PC, Hsueh S, et al. Regulation of ovarian cancer progression by microRNA-187 through targeting Disabled homolog-2. Oncogene. 2012;31(6):764–75. doi: 10.1038/onc.2011.269. [DOI] [PubMed] [Google Scholar]
- 14.Mayorga ME, Penn MS. miR-145 is differentially regulated by TGF-beta1 and ischaemia and targets Disabled-2 expression and wnt/beta-catenin activity. J Cell Mol Med. 2012;16(5):1106–13. doi: 10.1111/j.1582-4934.2011.01385.x. [DOI] [PMC free article] [PubMed] [Google Scholar]
- 15.Fang L, Du WW, Yang W, Rutnam ZJ, Peng C, Li H, et al. MiR-93 enhances angiogenesis and metastasis by targeting LATS2. Cell Cycle. 2012;11(23):4352–65. doi: 10.4161/cc.22670. [DOI] [PMC free article] [PubMed] [Google Scholar]
- 16.Borchert GM, Holton NW, Larson ED. Repression of human activation induced cytidine deaminase by miR-93 and miR-155. BMC Cancer. 2011;11:347. doi: 10.1186/1471-2407-11-347. [DOI] [PMC free article] [PubMed] [Google Scholar]
- 17.Fang L, Deng Z, Shatseva T, Yang J, Peng C, Du WW, et al. MicroRNA miR-93 promotes tumor growth and angiogenesis by targeting integrin-beta8. Oncogene. 2011;30(7):806–21. doi: 10.1038/onc.2010.465. [DOI] [PubMed] [Google Scholar]
- 18.Kim K, Chadalapaka G, Lee SO, Yamada D, Sastre-Garau X, Defossez PA, et al. Identification of oncogenic microRNA-17-92/ZBTB4/specificity protein axis in breast cancer. Oncogene. 2012;31(8):1034–44. doi: 10.1038/onc.2011.296. [DOI] [PMC free article] [PubMed] [Google Scholar]
- 19.Du L, Schageman JJ, Subauste MC, Saber B, Hammond SM, Prudkin L, et al. miR-93, miR-98, and miR-197 regulate expression of tumor suppressor gene FUS1. Mol Cancer Res. 2009;7(8):1234–43. doi: 10.1158/1541-7786.MCR-08-0507. [DOI] [PMC free article] [PubMed] [Google Scholar]
- 20.Pineau P, Volinia S, McJunkin K, Marchio A, Battiston C, Terris B, et al. miR-221 overexpression contributes to liver tumorigenesis. Proc Natl Acad Sci U S A. 2010;107(1):264–9. doi: 10.1073/pnas.0907904107. [DOI] [PMC free article] [PubMed] [Google Scholar]
- 21.Kim YK, Yu J, Han TS, Park SY, Namkoong B, Kim DH, et al. Functional links between clustered microRNAs: suppression of cell-cycle inhibitors by microRNA clusters in gastric cancer. Nucleic Acids Res. 2009;37(5):1672–81. doi: 10.1093/nar/gkp002. [DOI] [PMC free article] [PubMed] [Google Scholar]
- 22.He J, Smith ER, Xu XX. Disabled-2 exerts its tumor suppressor activity by uncoupling c-Fos expression and MAP kinase activation. J Biol Chem. 2001;276(29):26814–8. doi: 10.1074/jbc.M101820200. [DOI] [PubMed] [Google Scholar]
- 23.Friedman RC, Farh KK, Burge CB, Bartel DP. Most mammalian mRNAs are conserved targets of microRNAs. Genome Res. 2009;19(1):92–105. doi: 10.1101/gr.082701.108. [DOI] [PMC free article] [PubMed] [Google Scholar]
- 24.Garcia DM, Baek D, Shin C, Bell GW, Grimson A, Bartel DP. Weak seed-pairing stability and high target-site abundance decrease the proficiency of lsy-6 and other microRNAs. Nat Struct Mol Biol. 2011;18(10):1139–46. doi: 10.1038/nsmb.2115. [DOI] [PMC free article] [PubMed] [Google Scholar]
- 25.Du L, Subauste MC, DeSevo C, Zhao Z, Baker M, Borkowski R, et al. miR-337-3p and its targets STAT3 and RAP1A modulate taxane sensitivity in non-small cell lung cancers. PLoS One. 2012;7(6):e39167. doi: 10.1371/journal.pone.0039167. [DOI] [PMC free article] [PubMed] [Google Scholar]
- 26.Wang T, Lv M, Shen S, Zhou S, Wang P, Chen Y, et al. Cell-free microRNA expression profiles in malignant effusion associated with patient survival in non-small cell lung cancer. PLoS One. 2012;7(8):e43268. doi: 10.1371/journal.pone.0043268. [DOI] [PMC free article] [PubMed] [Google Scholar]
- 27.Zhoul J, Hernandez G, Tu SW, Huang CL, Tseng CP, Hsieh JT. The role of DOC-2/DAB2 in modulating androgen receptor-mediated cell growth via the nongenomic c-Src-mediated pathway in normal prostatic epithelium and cancer. Cancer Res. 2005;65(21):9906–13. doi: 10.1158/0008-5472.CAN-05-1481. [DOI] [PubMed] [Google Scholar]
- 28.Long J, Wang Y, Wang W, Chang BH, Danesh FR. Identification of microRNA-93 as a novel regulator of vascular endothelial growth factor in hyperglycemic conditions. J Biol Chem. 2010;285(30):23457–65. doi: 10.1074/jbc.M110.136168. [DOI] [PMC free article] [PubMed] [Google Scholar]
- 29.Yeung ML, Yasunaga J, Bennasser Y, Dusetti N, Harris D, Ahmad N, et al. Roles for microRNAs, miR-93 and miR-130b, and tumor protein 53-induced nuclear protein 1 tumor suppressor in cell growth dysregulation by human T-cell lymphotrophic virus 1. Cancer Res. 2008;68(21):8976–85. doi: 10.1158/0008-5472.CAN-08-0769. [DOI] [PMC free article] [PubMed] [Google Scholar]
- 30.Chuang TD, Luo X, Panda H, Chegini N. miR-93/106b and their host gene, MCM7, are differentially expressed in leiomyomas and functionally target F3 and IL-8. Mol Endocrinol. 2012;26(6):1028–42. doi: 10.1210/me.2012-1075. [DOI] [PMC free article] [PubMed] [Google Scholar]
- 31.Smith AL, Iwanaga R, Drasin DJ, Micalizzi DS, Vartuli RL, Tan AC, et al. The miR-106b-25 cluster targets Smad7, activates TGF-beta signaling, and induces EMT and tumor initiating cell characteristics downstream of Six1 in human breast cancer. Oncogene. 2012;31(50):5162–71. doi: 10.1038/onc.2012.11. [DOI] [PMC free article] [PubMed] [Google Scholar]
- 32.Yang L, Cheng P, Chen C, He HB, Xie GQ, Zhou HD, et al. miR-93/Sp7 function loop mediates osteoblast mineralization. J Bone Miner Res. 2012;27(7):1598–606. doi: 10.1002/jbmr.1621. [DOI] [PubMed] [Google Scholar]
- 33.Fu X, Tian J, Zhang L, Chen Y, Hao Q. Involvement of microRNA-93, a new regulator of PTEN/Akt signaling pathway, in regulation of chemotherapeutic drug cisplatin chemosensitivity in ovarian cancer cells. FEBS Lett. 2012;586(9):1279–86. doi: 10.1016/j.febslet.2012.03.006. [DOI] [PubMed] [Google Scholar]
- 34.Wang Z, Liu M, Zhu H, Zhang W, He S, Hu C, et al. Suppression of p21 by c-Myc through members of miR-17 family at the post-transcriptional level. Int J Oncol. 2010;37(5):1315–21. [PubMed] [Google Scholar]
- 35.Li Y, Tan W, Neo TW, Aung MO, Wasser S, Lim SG, et al. Role of the miR-106b-25 microRNA cluster in hepatocellular carcinoma. Cancer Sci. 2009;100(7):1234–42. doi: 10.1111/j.1349-7006.2009.01164.x. [DOI] [PubMed] [Google Scholar]
- 36.Petrocca F, Visone R, Onelli MR, Shah MH, Nicoloso MS, de Martino I, et al. E2F1-regulated microRNAs impair TGFbeta-dependent cell-cycle arrest and apoptosis in gastric cancer. Cancer Cell. 2008;13(3):272–86. doi: 10.1016/j.ccr.2008.02.013. [DOI] [PubMed] [Google Scholar]
- 37.Carney DN, Minna JD. Small cell cancer of the lung. Clin Chest Med. 1982;3(2):389–98. [PubMed] [Google Scholar]
- 38.Carney DN, Gazdar AF, Nau M, Minna JD. Biological heterogeneity of small cell lung cancer. Semin Oncol. 1985;12(3):289–303. [PubMed] [Google Scholar]
- 39.Prudkin L, Behrens C, Liu DD, Zhou X, Ozburn NC, Bekele BN, et al. Loss and reduction of FUS1 protein expression is a frequent phenomenon in the pathogenesis of lung cancer. Clin Cancer Res. 2008;14(1):41–7. doi: 10.1158/1078-0432.CCR-07-1252. [DOI] [PMC free article] [PubMed] [Google Scholar]
- 40.Naldini L, Blomer U, Gallay P, Ory D, Mulligan R, Gage FH, et al. In vivo gene delivery and stable transduction of nondividing cells by a lentiviral vector. Science. 1996;272(5259):263–7. doi: 10.1126/science.272.5259.263. [DOI] [PubMed] [Google Scholar]
- 41.Kluiver J, Gibcus JH, Hettinga C, Adema A, Richter MK, Halsema N, et al. Rapid generation of microRNA sponges for microRNA inhibition. PLoS One. 2012;7(1):e29275. doi: 10.1371/journal.pone.0029275. [DOI] [PMC free article] [PubMed] [Google Scholar]
- 42.Grimson A, Farh KK, Johnston WK, Garrett-Engele P, Lim LP, Bartel DP. MicroRNA targeting specificity in mammals: determinants beyond seed pairing. Mol Cell. 2007;27(1):91–105. doi: 10.1016/j.molcel.2007.06.017. [DOI] [PMC free article] [PubMed] [Google Scholar]
Associated Data
This section collects any data citations, data availability statements, or supplementary materials included in this article.
Supplementary Materials
A, Patients with FUS1 mRNA levels in the highest and lowest quintiles were selected from the 245 NSCLC patients, defining the high and low FUS1 expression groups (n=50/group). The mean FUS1 mRNA levels are significantly different between the two patient groups. ****, p < 0.0001. B, Overall survival curves for the two groups. Median overall survival times in the low (green) and high FUS1 (red) groups were 6.7 y and 7.4 y, respectively, with a hazard ratio of 0.81 (95% CI 0.42–1.56), and p = 0.53. C, Recurrence-free survival curves for the two groups. Median recurrence-free survival times in the low and high miR-93 groups were 3.2 y and 5.5 y, respectively, with a hazard ratio of 0.73 (95% CI 0.39–1.34), and p = 0.31. Statistical significance was assessed by Mantel-Cox log-rank test.
Statistical differences in the distribution of patients by tumor stage between groups were assessed by chi-squared test.
Shown are the cell line names, tumor subtypes from which the cell lines are derived, ages and genders of the patients, and identified mutations in the TP53, CDKN2A and KRAS genes. UNK, unknown; WT, wildtype; del, deletion.
Shown are correlation coefficients (r) and p values, based on Pearson correlation.
Correlations between expression of candidate transcription factors and expression of the miR-93/miR-25/miR-106b cluster and its host gene MCM7 in 245 NSCLC patient specimens were assessed by Pearson correlation. Shown are the correlation coefficients (r) and p values.