

Abstract
Cardiovascular (CV) risk factors, such as hypertension, diabetes, and hyperlipidemia are associated with cognitive impairment and risk of dementia in older adults. However, the mechanisms linking them are not clear. This study aims to investigate the association between aggregate CV risk, assessed by the Framingham general cardiovascular risk profile, and functional brain activation in a group of community-dwelling older adults. Sixty participants (mean age: 64.6 years) from the Brain Health Study, a nested study of the Baltimore Experience Corps Trial, underwent functional magnetic resonance imaging using the Flanker task. We found that participants with higher CV risk had greater task-related activation in the left inferior parietal region, and this increased activation was associated with poorer task performance. Our results provide insights into the neural systems underlying the relationship between CV risk and executive function. Increased activation of the inferior parietal region may offer a pathway through which CV risk increases risk for cognitive impairment.
Keywords: Cardiovascular risk, Framingham risk score, fMRI, Brain function, Executive function, Older adults
1. Introduction
Cardiovascular (CV) risk factors, such as hypertension, diabetes mellitus, dyslipidemia, and obesity, are important modifiable risk factors associated with cognitive impairment and risk of dementia in older adults (Kivipelto et al., 2001; Kloppenborg et al., 2008; Whitmer et al., 2005). CV risk factors are highly prevalent in older adults, and they rarely exist alone. Although each individual CV risk factor can have a deleterious impact on cardiovascular and cognitive health, typically, it is often a combination of several risk factors that act in both an additive and multiplicative manner to impose the greatest risk of cardiovascular diseases and dementia (Kalmijn et al., 2000; Kivipelto et al., 2001; Luchsinger et al., 2005; Whitmer et al., 2005).
Executive functions, such as planning, organizing sequential tasks, inhibiting interfering sources of information, and task switching, are important cognitive functions thought to be not only susceptible to the effects of aging (Buckner, 2004; Head et al., 2004; Hedden and Gabrieli, 2004; Raz et al., 1998; West, 1996) but also impaired in the early stages of dementia and Alzheimer’s disease (AD) (Albert et al., 2001; Buckner, 2004; Carlson et al., 2009). Moreover, CV risk factors and cardiovascular diseases (CVD) have been consistently found to be associated with deficits in executive function (Elias et al., 2004; Fontbonne et al., 2001; Garrett et al., 2004). Although the relationship between CV risk factors and cognitive impairment and dementia in older adults is established, the mechanisms linking them are just beginning to be explored. Neuroimaging techniques are one way to investigate possible mechanisms, however few studies have used these techniques to examine the association between individual CV risk factors and functional brain activation (Jennings et al., 2005).
The present study aims to investigate the association between aggregate CV risk assessed by a nationally validated Framingham General Cardiovascular Risk Profile and executive brain function using functional magnetic resonance imaging (fMRI) in a group of community-dwelling older adults who are cognitively normal, yet at elevated risk for cognitive impairment. The executive function task used in this study targets selective attention and inhibitorycontrol of broad executive function and has been shown to be sensitive to the effect of cardiovascular fitness on brain function changes in older adults (Colcombe et al., 2004), and thus might be sensitive to an aggregate CV risk score. In the neuroimaging literature, using similar tasks, regions of the frontal and parietal cortices, particularly the middle frontal gyrus and the superior and inferior parietal lobes, are consistently implicated (Casey et al., 2000) and are regions of primary interest here. Whether aggregate CV risk is associated with greater or less task-related activity in attentional circuitry described previously is still under exploration. Nonetheless, fMRI studies in at-risk older adults have often shown more extensive and stronger cortical recruitment in these task-related regions (Bondi et al., 2005; Bookheimer et al., 2000). Hence, we hypothesized that greater aggregate CV risk would be associated with more extensive and greater activation in executive function-related brain regions, particularly frontal and parietal cortices.
2. Methods
2.1. Participants
The study sample for this fMRI study was drawn from the Brain Health Study (BHS), a nested study within the Baltimore Experience Corps Trial (BECT). The BECT is a randomized controlled trial of the Experience Corps (EC) program in Baltimore, a volunteer senior service program in urban elementary schools, initiated in 2006 (Fried et al., 2013). Seven hundred and two eligible participants were recruited and randomized to the EC program intervention or a usual low-activity control group. Eligibility criteria have been described previously (Carlson et al., 2008; Steiger, 1980), and included as: (1) being aged 60 years or older; (2) English speaking; (3) minimum sixth grade reading level on the Wide Range Achievement Test (Wilkinson, 1993); (4) Mini-Mental State Examination (Folstein et al., 1975) score of 24 or higher; and (5) completion of the Trail Making Test (Reitan, 1958) parts A and B within the allocated time (part A = 240 seconds and part B = 360 seconds). The BHS simultaneously recruited 120 of the trial participants before randomization within the BECT, to avoid any potential selection biases associated with knowledge of placement. The BHS was designed to examine the biological mechanisms by which the EC program induces cognitive and brain plasticity, using structural and functional brain magnetic resonance imaging (MRI), and a fasting blood panel of metabolic profiles collected at baseline. Additional eligibility criteria included were: (1) right hand dominance to avoid possible laterality confusion in left-handed individuals; (2) no implanted pacemaker, defibrillator, or other electronic or metal devices; and (3) no history of atrial fibrillation, stroke, brain tumor, brain hemorrhage, or brain surgery for a cerebral aneurysm. The study was approved by the Johns Hopkins Institutional Review Board and all participants provided written and informed consent.
fMRI scans were collected on 113 participants in the BHS. Twenty-four participants were excluded because one or more of the variables needed to calculate the Framingham General Cardiovascular Disease Risk Profile were not available at baseline. In addition, 11 participants above the age of 75 years were excluded because they were outside the age range in which the Framingham General Cardiovascular Disease Risk Profile was developed. Finally, eighteen participants were excluded because of fMRI factors such as poor image quality, artifacts and/or excessive motion. The final sample included 60 participants. Fig. 1 presents the flowchart describing study sample selection.
Fig. 1.

The flowchart of selection of the study sample.
2.2. Assessment of cardiovascular risk factors
Aggregate CV risk was assessed using a newly-developed Framingham general cardiovascular disease (CVD) risk profile. This risk score is designed for use in primary care to identify individuals at high risk for a broad range of CVD events including coronary heart disease (coronary death, angina, coronary insufficiency), cerebro-vascular events (all strokes and transient ischemic attacks), peripheral arterial disease, and heart failure. Its development was based on 1174 CVD events over a 12-year follow-up period for 8491 participants aged 30–74 years in the Framingham Heart study (D’Agostino et al., 2008). The risk profile, calculated using age, sex, high density lipoprotein (HDL) cholesterol, total cholesterol, treated or untreated systolic blood pressure, cigarette smoking, and diabetes, provides an estimate of the risk of CVD over a 10-year period. Though this risk score was developed in a predominantly white population, it has been validated in other racial groups such as African-Americans (Hurley et al., 2010).
Components of the risk profile were drawn from questionnaire and physical examination data at baseline. Systolic blood pressure was taken in the sitting position after resting with the sphygmomanometer. Treated hypertension was determined by self reported history and/or use of antihypertensive medication. Medical history of cardiovascular events was also obtained via self-report. Participants were asked about history of a number of cardiovascular events, including heart attack (or myocardial infarction), congestive heart failure, angina (or chest pain because of heart disease), intermittent claudication (or pain from blockage of the arteries), stroke or brain hemorrhage, and transient ischemic attack. No participants in the present study reported any cardiovascular events described previously. Participants were categorized by their cigarette smoking status as current smokers or past or non-smokers. Diabetes was defined by self-report of diagnosis of diabetes or by a fasting glucose ≥ 126 mg/dL. A 10-year risk of incident CVD, expressed as a percentage, was calculated from the Cox model formulas (D’Agostino et al., 2008).
2.3. Executive function task
A modified version of the Eriksen flanker task (Botvinick et al., 1999; Colcombe et al., 2005) was used to measure components of executive function, specifically selective attention and inhibition. This task has been used previously to study executive function in older adults (Colcombe et al., 2004, 2005). Participants were asked to press a button in their left or right hand as quickly and accurately as possible to indicate the direction of a central target arrow flanked by 4 arrows pointing in the same direction (congruent; ≪≪<) or in the opposite direction (incongruent; ≫<≫). Executive demand was manipulated in 2 ways, through the direction of the flanking arrows (i.e., congruency) and a visual cue to help focus attention on the central arrow (small red circle) versus a cue around all 5 arrows that provided no information (large red circle). Therefore, incongruent arrows with a large cue would have the greatest demands on executive function while the congruent arrows with a small cue would have the lowest demands.
This yielded 4 conditions shown in Fig. 2: congruent small circle (ConSm), incongruent small circle (IncSm), congruent large circle (ConLg), and incongruent large circle (IncLg). The participants were presented 40 trials of each condition for a total of 160 trials in a rapid event-related paradigm. Each stimulus was displayed for 2 seconds in the middle of the screen on a black background. The interstimulus interval varied with a 3 second presentation of a central fixation crosshair followed by 40% jittered periods. ISIs ranged from 1.5 seconds to 18.5 seconds, with a mean of 3.7 seconds. All stimuli were presented using E-Prime on an MRI-safe back projection system.
Fig. 2.
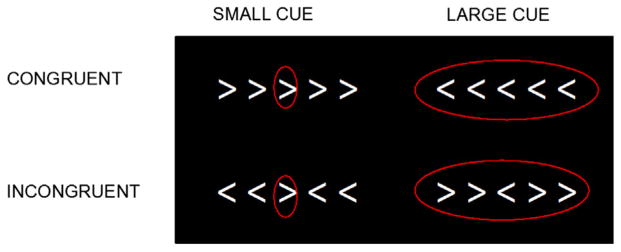
The Flanker task.
Accuracy and reaction time (RT) were recorded for each trial. A measure of interference (the flanker effect; Eriksen and Eriksen, 1974), representing demand for executive function, was computed as (mean RT of incongruent trials – mean RT of congruent trials) separately by cue size. Only correct responses were analyzed. Two participants had an insufficient number (<60%) of accurate trials and were excluded from further fMRI data analysis.
2.4. Imaging methods
2.4.1. Imaging acquisition
All imaging data were collected on a 3T Intera Philips scanner (Best, the Netherlands). Whole-brain functional data were acquired with T2*-weighted echoplanar images (repetition time = 1500 ms; echo time = 30 ms; slice thickness = 4 mm/1 mm gap; 30 slices, interleaved acquisition; flip angle = 70°; matrix = 64 × 64; field of view = 240 mm). Data were acquired in a single run of 578 volumes.
A structural image was also collected using the magnetization prepared rapid-acquisition gradient echo protocol (repetition time = 8 ms, echo time = 3.6 ms, field of view = 256 mm, matrix = 256 × 256, slice thickness = 1 mm; 200 slices).
2.4.2. fMRI preprocessing and registration
Unless otherwise specified, all fMRI data processing and statistical analyses were carried out using FMRIB’s (Oxford Centre for Functional MRI of the Brain) software library (FSL) 4.1.9 (www.fmrib.ox.ac.uk/fsl; Smith et al., 2004).
Preprocessing of the functional data included slice time correction, motion correction using a rigid body algorithm in MCFLIRT (Jenkinson et al., 2002), removal of non-brain structures using brain extraction tool (BET; Smith et al., 2002), spatial smoothing using a 7.0 mm full width at half maximum (FWHM) Gaussian kernel, and high-pass temporal filtering with a 50-second cutoff.
Two methods were used to reduce noise in the images before further processing. The artifact detection tools (Whitfield-Gabrieli, 2009), a statistical parametric mapping toolbox, was used to identify outlier volumes based on the following criteria: (1) global mean image intensity that differed from that in the previous volume by more than 3 standard deviations; and (2) mean displacement because of motion of more than 2 mm. Outlier volumes were added as nuisance regressors in the general linear model. The MELODIC (Beckmann and Smith, 2004), an independent component analysis in FSL, was used to filter artifact components from the data before first-level analysis.
The preprocessed functional images for each participant were spatially registered into standard (Montreal Neurological Institute) space, using a 12-parameter affine registration (FMRIB’s linear image registration tool).
2.4.3. fMRI statistical analysis
Following preprocessing and registration, regression analyses at the individual level and group level were carried out using FMRI expert analysis tool version 5.98 (Beckmann et al., 2003). Each condition (ConLg, ConSm, IncLg, IncSm) was added separately to the general linear model and convolved with a double-gamma hemodynamic response function. Only correct trials in each condition were included, and error trials from all conditions were entered as covariates. Nuisance regressors included dummy-coded outlier volumes identified previously.
We were particularly interested in the contrasts comparing incongruent trials to congruent trials within the large cue size (IncLg > ConLg) and within the small cue size (IncSm > ConSm) because these 2 contrasts represented high versus low executive demand. Contrasts of the 4 conditions were calculated and then forwarded to the second level analysis using FMRIB’s local analysis of mixed effects. We first assessed activation associated with the 2 contrasts of interest, and then the Framingham general cardiovascular risk score was entered into the model as a continuous variable to investigate its correlation with task-evoked fMRI activity. To eliminate confounding from structural brain differences, gray matter partial volume images of each participant obtained using FMRIB’s automatic segmentation tool were entered into the model. In secondary analyses, we examined the contributions of individual components from the Framingham general cardiovascular disease risk profile, including age, sex, systolic blood pressure, diabetes, smoking status, total cholesterol, and HDL cholesterol, by regressing each of these components on whole-brain fMRI activity in the 2 contrasts of interest and 4 main conditions. For all analyses, a threshold of Z >2.33 was used for cluster-based correction for multiple comparisons and a (corrected) cluster significance threshold was set as p < 0.01 (Worsley, 2001).
2.5. Statistical analysis
Partial correlations were computed between the behavioral measure of executive function using the flanker task and the Framingham general cardiovascular risk score, controlling for age. Partial correlations were also computed between the mean percent signal changes from contrasts of interest and the CV risk score, also controlling for age. Although age is a component of the Framingham general CV risk score, we conservatively adjusted for age in these analyses because it was expected to correlate with flanker task speed and task-related fMRI activity. In addition, the correlations between mean percent signal changes from contrast of interest and behavioral performance were also examined.
3. Results
The demographic characteristics of study participants are presented in Table 1. Most participants were African American women. They had a high prevalence of CV risk factors. The mean 10-year risk of cardiovascular diseases was 19.7% (range: 2.9%–59.4%). Those participants were excluded because poor image quality, excessive motion, and poor task performance did not differ from the remaining sample in age, education, Mini-Mental State Examination, or CV risk score.
Table 1.
Demographic characteristics of the study sample
| Demographic characteristics | Participants (N = 60) |
|---|---|
| Age (y), mean ± SD (range) | 64.6 ± 3.7 (60–74) |
| Female, N (%) | 45 (75) |
| African American, N (%) | 56 (93.3) |
| Years of education, mean ± SD | 13.9 ± 2.3 |
| MMSE, mean ± SD (range) | 28.5 ± 1.4 (25–30) |
| TMT part A, mean ± SD | 43.4 ± 14.2 |
| TMT part B, mean ± SD | 120.3 ± 66.3 |
| Diabetes, N (%) | 13 (21.7) |
| Hypertension, N (%) | 43 (71.7) |
| Systolic BP, mmHg, mean ± SD | 142.1 ± 17.8 |
| Diastolic BP, mmHg, mean ± SD | 80.9 ± 11.1 |
| Total cholesterol, mg/dL, mean ± SD | 192.1 ± 45.2 |
| HDL, mg/dL, mean ± SD | 58.1 ± 16.9 |
| Current smoker, N (%) | 11 (18.3) |
| BMI, mean ± SD | 31.3 ± 6.4 |
| GDS ≥ 6, N (%) | 2 (3.3) |
| FRS Gen | 19.7 (11.3) |
Key: BMI, body-mass index; BP, blood pressure; FRS Gen, Framingham General Cardiovascular Risk Profile; GDS, geriatric depression scale; HDL, high-density lipoprotein; MMSE, Mini-Mental State Examination; SD, standard deviation; TMT, Trail Making Test.
3.1. Behavioral results
Cognitive data are summarized in Table 2. Overall, errors were low across all 4 conditions (0.02%–0.1%); as expected, the most attention demanding condition, incongruent large cue (IncLg), yielded the highest percentage of errors. Mean RT for the incongruent conditions collapsed across cue sizes was slower than the congruent conditions (paired t test, t[59] = 13.2, p < 0.001). Executive demand within the large (uninformative) cue condition (mean IncLg RT–mean ConLg RT) was greater than within the small cue condition (mean IncSm RT − mean ConSm RT) (t [59] = 7.27, p < 0.001).
Table 2.
Task performance across conditions on the flanker task
| Flanker condition | Error percentage ± SD | Reaction time, msec; mean ± SD |
|---|---|---|
| Control conditions | ||
| Congruent-small cue (ConSm) | 0.02 ± 0.03 | 645.4 ± 86.8 |
| Congruent-large cue (ConLg) | 0.03 ± 0.05 | 683.0 ± 108.7 |
| Inhibitory conditions | ||
| Incongruent-small cue (ConLg) | 0.04 ± 0.06 | 679.8 ± 85.9 |
| Incongruent-large cue (IncLg) | 0.10 ± 0.16 | 770.1 ± 112.6 |
Key: SD, standard deviation.
CV risk scores were not associated with executive function performance, measured by RT differences between incongruent and congruent conditions for the large cue (r = 0.20, p = 0.12) or small cue conditions (r = 0.13, p = 0.33) (Fig. 4B).
Fig. 4.
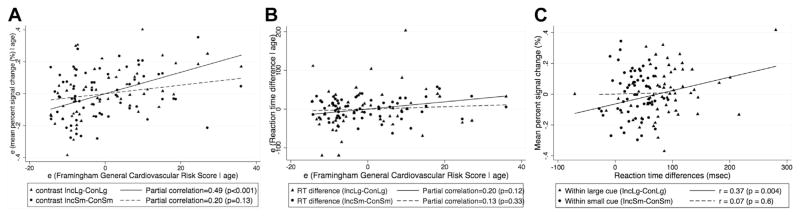
Correlation of the Framingham general cardiovascular risk with (A) fMRI percent signal change, (B) RT differences, adjusting for age, in the left parietal region in IncLg versus ConLg and IncSm versus ConSm contrast (C) correlation between percent signal changes in the left parietal region and RT differences in IncLg versus ConLg and IncSm versus ConSm contrast. Abbreviations: ConLg, congruent large circle; ConSm, congruent small circle; fMRI, functional magnetic resonance imaging; IncLg, incongruent large circle; ConLg, congruent large circle.
3.2. Imaging results
3.2.1. Group analysis of the flanker task
Consistent with previous findings of fMRI studies using the flanker task (Botvinick et al., 1999; Bunge et al., 2002; Casey et al., 2000; Colcombe et al., 2005; Durston et al., 2003; van Veen et al., 2001), we found significantly increased activity in the bilateral middle frontal gyrus, anterior cingulate cortex, supplementary motor area, and bilateral parietal and occipital lobe in the high demand contrast (IncLg > ConLg) (Table 3.). However, in the contrast requiring less executive control (IncSm > ConSm), only 1 cluster in the right occipital lobe was identified (Table 3). This parametric manipulation of executive demand resulted in differential activation patterns. As a result, analyses for these separate contrasts were conducted for the remainder of the study.
Table 3.
Cluster and peak voxel characteristics for regions that showed significant differences between incongruent and congruent conditions in whole-brain analysis
| Contrast | # Voxels | Maximum z | Region | x | y | z |
|---|---|---|---|---|---|---|
| IncLg > ConLg (High inhibitory executive demand) | 12,895 | 5.23 | Right superior occipital lobe | 16 | −66 | 50 |
| — | 4.63 | Right inferior occipital lobe | 46 | −72 | −4 | |
| — | 4.47 | Left superior parietal lobule | −28 | −58 | 50 | |
| — | 4.45 | Right superior parietal lobule | 34 | −50 | 52 | |
| — | 4.21 | Left superior occipital lobe | −48 | −80 | −8 | |
| 3394 | 5.64 | Anterior cingulate gyrus and/or supplementary motor cortex | 2 | 16 | 46 | |
| — | 4.26 | Left middle frontal gyrus | −42 | 0 | 36 | |
| 1839 | 3.84 | Right middle frontal gyrus | 38 | 12 | 58 | |
| IncSm > ConSm (Low inhibitory executive demand) | 1523 | 3.85 | Right inferior occipital lobe | 48 | −88 | 8 |
Peak locations are in the coordinate system of MNI (mm).
Key: ConLg, congruent large circle; ConSm, congruent small circle; IncLg, incongruent large circle; IncSm, congruent small circle; MNI, Montreal Neurological Institute.
3.2.2. The Framingham general cardiovascular risk profile
Similar to the effects of parametric manipulation on brain activation in the group analysis, the Framingham general cardiovascular risk profile was positively correlated with fMRI activity in the contrast requiring high executive demand (IncLg > ConLg) whereas no activation was identified with CV risk score under low executive demand (IncSm > ConSm) (Fig. 3 and Table 4). Because this activation encompassed more than 1 anatomic region, we isolated the left parietal region where activity was associated with CV risk in the high executive demand contrast (IncLg > ConLg). The mean percent signal changes in voxels in the left parietal region for each participant were extracted and plotted against the Framingham general CV risk score, adjusting for age.
Fig. 3.

Correlation of fMRI activity with Framingham general cardiovascular risk score in IncLg versus ConLg contrast (A) axial view and (B) sagittal view. Abbreviations: ConLg, congruent large circle; fMRI, functional magnetic resonance imaging; IncLg, incongruent large circle.
Table 4.
Cluster and peak voxel characteristics for regions that showed significant correlation with Framingham general cardiovascular risk score in whole-brain analysis
| Contrast | # Voxels | Maximum z | Region | x | y | z |
|---|---|---|---|---|---|---|
| IncLg > ConLg | 1682 | 3.33 | Left middle temporal lobe | −48 | −60 | 12 |
| — | 3.24 | Left inferior parietal lobe | −34 | −66 | 48 | |
| — | 3.22 | Left inferior parietal lobe (supramarginal gyrus) | −56 | −36 | 44 | |
| IncSm > ConSm | — | — | No cluster | — | — | — |
Peak locations are in the coordinate system of MNI (mm).
Key: ConLg, congruent large circle; ConSm, congruent small circle; IncLg, incongruent large circle; IncSm, congruent small circle; MNI, Montreal Neurological Institute.
There was no significant association between CV risk score and 4 main conditions. For 2 contrasts of interest, as shown in Fig. 4A, CV risk score had significantly stronger correlation with percent signal change in the left parietal region in the high executive demand contrast (IncLg > ConLg) (r = 0.49, p < 0.001) than in the low executive demand contrast (IncSm > ConSm) (r = 0.2, p = 0.13) (Fisher’s z = 1.91, 2-tailed p = 0.056). After further breakdown of percent signal change from the contrast IncLg > ConLg, we found that CV risk was more strongly associated with the signal change for the IncLg condition (r = 0.28, p = 0.03) than ConLg condition (r = −0.15, p = 0.24) (Fisher’s z = 3.77, 2-tailed p < 0.001). For behavioral performance (Fig. 4B), we also observed a similar relationship between CV risk and reaction times as the level of executive demand increased although both partial correlations were not significant. Furthermore, greater percent signal change in the left parietal region was more strongly associated with poorer performance in the high executive demand contrast (IncLg > ConLg) (r = 0.37, p = 0.004) than in the low demand contrast (IncSm > ConSm) (r = 0.07, p = 0.6) (Fisher’s z = 1.81, 2-tailed p = 0.07) (Fig. 4C). All Fisher’s z tests are from comparing 2 dependent correlations measured on the same subjects (Steiger, 1980).
In secondary analyses, no individual component from the Framingham general cardiovascular diseases risk score, including age, sex, systolic blood pressure, diabetes, smoking status, total cholesterol, and HDL cholesterol, was significantly associated with whole brain fMRI contrasts of interest.
4. Discussion
Vascular risk factors often modify cognitive aging or contribute to the development of cognitive impairment in older adults; however, the mechanisms underlying the aggregate effect of vascular risk factors are unclear. In a group of cognitively normal, community-dwelling older adults, we used the Framingham risk score to summarize aggregate CV risk and explore its relationship to executive function and associated brain function. In the whole-brain correlational analysis, we found aggregate CV risk, rather than individual CV risk factors, was associated with hyperactivation in the left parietal region only under conditions requiring high executive demand. By comparison, we did not find that CV risk was associated with poorer performance in either high or low executive demand conditions. In other words, reaction time measures were not as sensitive as activation in capturing these differential associations with increasing demand.
Few studies have used functional neuroimaging to examine the association between aggregate CV risk and brain function in older adults. A recent study by Beason-Held et al. (2012) using [15O] water positron emission tomography investigated the association between Framingham cardiovascular disease risk profile and resting state cerebral blood flow changes, and found that higher baseline CV risk scores were associated with greater longitudinal decline in cerebral blood flow in orbitofrontal, medial frontal and/or anterior cingulate, insular, precuneus, and brain stem regions. It is difficult to compare our results to the findings, mentioned previously, because this study was conducted in a group of mostly Caucasian older adults with high educational levels and low prevalence of CV risk factors, whereas our sample consisted mostly of African-American older adults with relatively low education and a high prevalence of CV risk. Furthermore, the increased or decreased activation between a resting state positron emission tomography scan and a task-related fMRI scan require different interpretations. Another recent study by Braskie et al. (2010) using fMRI found that during a memory task, participants with higher systolic blood pressure and body mass index had increased activation in the posterior cingulate cortex and parietal cortex. Our results are somewhat consistent with this finding since both found that increased CV risk was associated with higher activation in task-related brain regions. Although it is difficult to compare these results with previous studies because of differing participant characteristics, the neuroimaging techniques and task paradigms provide convergent evidence showing that aggregate CV risk is associated with differences in brain function in older adults.
One important function of the parietal cortex is to control visual attention (Colby and Goldberg, 1999; Corbetta et al., 1998; Kanwisher and Wojciulik, 2000; Wojciulik and Kanwisher, 1999), the function that enables us to direct our attentional resources to a subset of available information and produce top-down signals that modulate activity elsewhere in the visual cortex (Corbetta et al., 2000; Hopfinger et al., 2000; Kastner et al., 1999; Shulman et al., 1999; Wojciulik and Kanwisher, 1999). Activation in this region has been reported in studies of the flanker task (Bunge et al., 2002; Casey et al., 2000; Durston et al., 2003) and is proposed to be involved in the resolution of cognitive conflict. The effects of CV risk factors were consistently found on cognitive speed and executive functions (Elias et al., 2004; Kanaya et al., 2004; Kuo et al., 2004). Cardiovascular diseases have also been found to be most commonly associated with deficits in attention, executive functions, psycho-motor speed, and information processing (Garrett et al., 2004; Nyenhuis et al., 2004). In the present study, we found no association between aggregate CV risk and task performance in either high- or low-executive demand conditions. However, participants with higher CV risk elicited stronger activation of the left parietal region under high executive demands, and this increased activation was associated with poorer task performance. This may reflect reduced, but not impaired, efficiency of parietal lobe functions in resolving response competition. Dysfunction in the parietal region has been shown in early AD in both postmortem (Braak and Braak, 1996; McKee et al., 2006) and neuroimaging (Buckner et al., 2005; Jacobs et al., 2012b) studies. In early AD or mild cognitive impairment, fMRI studies have revealed either compensatory activation or functional loss in this region (Bokde et al., 2008, 2010; Jacobs et al., 2012a; Prvulovic et al., 2002; Sperling et al., 2010; Vannini et al., 2007). The convergence of preferential activation in the parietal lobe in both the present study and AD and mild cognitive impairment studies may suggest a neural mechanism by which CV risk and AD pathology interact to contribute to the development of cognitive impairment in older adults. That is, before cognitive limitations are apparent, hyperactivation in the parietal lobe may signal dysfunctional neural pathways that could serve as an early marker of CV risk-related cognitive decline.
Several limitations deserve attention. First, study participants were mostly African American women, and many had relatively low socioeconomic status and educational levels (high school or less). They are therefore not representative of the general population in the US; hence, the external validity of our results is restricted. However, because this sample represents a high-risk group amenable to a health promotion intervention, understanding the mechanisms and effects of CV risk on cognition and brain function in this group provides a critical opportunity to evaluate risk modification. Second, the present study is cross-sectional in nature, such that the causal relationship between CV risk and functional brain changes cannot be determined. Continued follow-up of this sample will help further elucidate the neural mechanisms underlying the association between CV risk and brain function and how an activity intervention may modify this relationship. Third, some structural brain changes, such as white matter hyperintensities, have been shown to be associated with CV risk factors (Dufouil et al., 2001; Gottesman et al., 2010; van Harten et al., 2006), which was not assessed in the present study. These structural or morphologic effects of CV risk could be mediating the functional differences that we report here and future studies (with larger sample sizes) could more reliably test mediating pathways. Fourth, the BOLD response measured by fMRI is inherently linked to the vascular system. Since we examined the associations between CV risk and BOLD signals, participants with high CV risk may be more likely to have vasculature abnormality and as a result, the activation in the left parietal region might be related to the dysfunctional vascular system that the BOLD response is dependent upon. It is difficult to prove or disprove this possibility without measuring BOLD signals and functioning of vascular system, simultaneously. However, we have found that CV risk was not associated with the BOLD response in any of the baseline conditions (e.g., IncLg > fixation)–especially in the left parietal region. This finding provides partial evidence that the activation we observed is less likely to be associated with a dysfunctional vascular system because of high CV risk, but rather related to the neural processing of the parietal region under high cognitive demands.
In summary, cognitively intact older adults with higher CV risk showed increased activation in the left parietal region in a task that varied the level of executive demand. Activation increased as executive demand increased, but this was correlated with poorer performance, suggesting inefficiency in these regions supporting visual attention. These results provide evidence for a neural mechanism to explain how aggregate CV risk modifies cognitive aging and contributes to the development of cognitive impairment in older adults.
Acknowledgments
The authors thank study participants for their contribution to the study. This work was supported by the National Institute on Aging (BSR grant P01 AG027735-03), the National Institute on Aging Claude D. Pepper Older Americans Independence Center (P30 AG021334), the Alzheimer’s Drug Discovery Foundation, S.B. Bechtel Grant, and the Johns Hopkins Neurobehavioral Research Unit.
Footnotes
Disclosure statement
The authors have no disclosures to make.
References
- Albert MS, Moss MB, Tanzi R, Jones K. Preclinical prediction of AD using neuropsychological tests. J Int Neuropsychol Soc. 2001;7:631–639. doi: 10.1017/s1355617701755105. [DOI] [PubMed] [Google Scholar]
- Beason-Held LL, Thambisetty M, Deib G, Sojkova J, Landman BA, Zonderman AB, Ferrucci L, Kraut MA, Resnick SM. Baseline cardiovascular risk predicts subsequent changes in resting brain function. Stroke. 2012;43:1542–1547. doi: 10.1161/STROKEAHA.111.638437. [DOI] [PMC free article] [PubMed] [Google Scholar]
- Beckmann CF, Jenkinson M, Smith SM. General multilevel linear modeling for group analysis in FMRI. Neuroimage. 2003;20:1052–1063. doi: 10.1016/S1053-8119(03)00435-X. [DOI] [PubMed] [Google Scholar]
- Beckmann CF, Smith SM. Probabilistic independent component analysis for functional magnetic resonance imaging. IEEE Trans Med Imaging. 2004;23:137–152. doi: 10.1109/TMI.2003.822821. http://dx.doi.org/10.1109/TMI.2003.822821. [DOI] [PubMed] [Google Scholar]
- Bokde AL, Lopez-Bayo P, Born C, Dong W, Meindl T, Leinsinger G, Teipel SJ, Faltraco F, Reiser M, Moller HJ, Hampel H. Functional abnormalities of the visual processing system in subjects with mild cognitive impairment: an fMRI study. Psychiatry Res. 2008;163:248–259. doi: 10.1016/j.pscychresns.2007.08.013. http://dx.doi.org/10.1016/j.pscychresns.2007.08.013. [DOI] [PubMed] [Google Scholar]
- Bokde AL, Lopez-Bayo P, Born C, Ewers M, Meindl T, Teipel SJ, Faltraco F, Reiser MF, Moller HJ, Hampel H. Alzheimer disease: functional abnormalities in the dorsal visual pathway. Radiology. 2010;254:219–226. doi: 10.1148/radiol.2541090558. http://dx.doi.org/10.1148/radiol.2541090558. [DOI] [PubMed] [Google Scholar]
- Bondi MW, Houston WS, Eyler LT, Brown GG. fMRI evidence of compensatory mechanisms in older adults at genetic risk for Alzheimer disease. Neurology. 2005;64:501–508. doi: 10.1212/01.WNL.0000150885.00929.7E. [DOI] [PMC free article] [PubMed] [Google Scholar]
- Bookheimer SY, Strojwas MH, Cohen MS, Saunders AM, Pericak-Vance MA, Mazziotta JC, Small GW. Patterns of brain activation in people at risk for Alzheimer’s disease. N Engl J Med. 2000;343:450–456. doi: 10.1056/NEJM200008173430701. http://dx.doi.org/10.1056/NEJM200008173430701. [DOI] [PMC free article] [PubMed] [Google Scholar]
- Botvinick M, Nystrom LE, Fissell K, Carter CS, Cohen JD. Conflict monitoring versus selection-for-action in anterior cingulate cortex. Nature. 1999;402:179–181. doi: 10.1038/46035. http://dx.doi.org/10.1038/46035. [DOI] [PubMed] [Google Scholar]
- Braak H, Braak E. Development of Alzheimer-related neurofibrillary changes in the neocortex inversely recapitulates cortical myelogenesis. Acta Neuropathol. 1996;92:197–201. doi: 10.1007/s004010050508. [DOI] [PubMed] [Google Scholar]
- Braskie MN, Small GW, Bookheimer SY. Vascular health risks and fMRI activation during a memory task in older adults. Neurobiol Aging. 2010;31:1532–1542. doi: 10.1016/j.neurobiolaging.2008.08.016. [DOI] [PMC free article] [PubMed] [Google Scholar]
- Buckner RL. Memory and executive function in aging and AD: multiple factors that cause decline and reserve factors that compensate. Neuron. 2004;44:195–208. doi: 10.1016/j.neuron.2004.09.006. [DOI] [PubMed] [Google Scholar]
- Buckner RL, Snyder AZ, Shannon BJ, LaRossa G, Sachs R, Fotenos AF, Sheline YI, Klunk WE, Mathis CA, Morris JC, Mintun MA. Molecular, structural, and functional characterization of Alzheimer’s disease: evidence for a relationship between default activity, amyloid, and memory. J Neurosci. 2005;25:7709–7717. doi: 10.1523/JNEUROSCI.2177-05.2005. [DOI] [PMC free article] [PubMed] [Google Scholar]
- Bunge SA, Hazeltine E, Scanlon MD, Rosen AC, Gabrieli JD. Dissociable contributions of prefrontal and parietal cortices to response selection. Neuro-image. 2002;17:1562–1571. doi: 10.1006/nimg.2002.1252. [DOI] [PubMed] [Google Scholar]
- Carlson MC, Saczynski JS, Rebok GW, Seeman T, Glass TA, McGill S, Tielsch J, Frick KD, Hill J, Fried LP. Exploring the effects of an “everyday” activity program on executive function and memory in older adults: Experience Corps. Gerontologist. 2008;48:793–801. doi: 10.1093/geront/48.6.793. [DOI] [PubMed] [Google Scholar]
- Carlson MC, Xue QL, Zhou J, Fried LP. Executive decline and dysfunction precedes declines in memory: the Women’s Health and Aging Study II. J Gerontol A Biol Sci Med Sci. 2009;64:110–117. doi: 10.1093/gerona/gln008. [DOI] [PMC free article] [PubMed] [Google Scholar]
- Casey BJ, Thomas KM, Welsh TF, Badgaiyan RD, Eccard CH, Jennings JR, Crone EA. Dissociation of response conflict, attentional selection, and expectancy with functional magnetic resonance imaging. Proc Natl Acad Sci USA. 2000;97:8728–8733. doi: 10.1073/pnas.97.15.8728. [DOI] [PMC free article] [PubMed] [Google Scholar]
- Colby CL, Goldberg ME. Space and attention in parietal cortex. Annu Rev Neurosci. 1999;22:319–349. doi: 10.1146/annurev.neuro.22.1.319. http://dx.doi.org/10.1146/annurev.neuro.22.1.319. [DOI] [PubMed] [Google Scholar]
- Colcombe SJ, Kramer AF, Erickson KI, Scalf P. The implications of cortical recruitment and brain morphology for individual differences in inhibitory function in aging humans. Psychol Aging. 2005;20:363–375. doi: 10.1037/0882-7974.20.3.363. [DOI] [PubMed] [Google Scholar]
- Colcombe SJ, Kramer AF, Erickson KI, Scalf P, McAuley E, Cohen NJ, Webb A, Jerome GJ, Marquez DX, Elavsky S. Cardiovascular fitness, cortical plasticity, and aging. Proc Natl Acad Sci USA. 2004;101:3316–3321. doi: 10.1073/pnas.0400266101. [DOI] [PMC free article] [PubMed] [Google Scholar]
- Corbetta M, Akbudak E, Conturo TE, Snyder AZ, Ollinger JM, Drury HA, Linenweber MR, Petersen SE, Raichle ME, Van Essen DC, Shulman GL. A common network of functional areas for attention and eye movements. Neuron. 1998;21:761–773. doi: 10.1016/s0896-6273(00)80593-0. [DOI] [PubMed] [Google Scholar]
- Corbetta M, Kincade JM, Ollinger JM, McAvoy MP, Shulman GL. Voluntary orienting is dissociated from target detection in human posterior parietal cortex. Nat Neurosci. 2000;3:292–297. doi: 10.1038/73009. http://dx.doi.org/10.1038/73009. [DOI] [PubMed] [Google Scholar]
- D’Agostino RB, Sr, Vasan RS, Pencina MJ, Wolf PA, Cobain M, Massaro JM, Kannel WB. General cardiovascular risk profile for use in primary care: the Framingham Heart Study. Circulation. 2008;117:743–753. doi: 10.1161/CIRCULATIONAHA.107.699579. [DOI] [PubMed] [Google Scholar]
- Dufouil C, de Kersaint-Gilly A, Besancon V, Levy C, Auffray E, Brunnereau L, Alperovitch A, Tzourio C. Longitudinal study of blood pressure and white matter hyperintensities: the EVA MRI Cohort. Neurology. 2001;56:921–926. doi: 10.1212/wnl.56.7.921. [DOI] [PubMed] [Google Scholar]
- Durston S, Davidson MC, Thomas KM, Worden MS, Tottenham N, Martinez A, Watts R, Ulug AM, Casey BJ. Parametric manipulation of conflict and response competition using rapid mixed-trial event-related fMRI. NeuroImage. 2003;20:2135–2141. doi: 10.1016/j.neuroimage.2003.08.004. [DOI] [PubMed] [Google Scholar]
- Elias PK, Elias MF, Robbins MA, Budge MM. Blood pressure-related cognitive decline: does age make a difference? Hypertension. 2004;44:631–636. doi: 10.1161/01.HYP.0000145858.07252.99. [DOI] [PubMed] [Google Scholar]
- Eriksen BA, Eriksen CW. Effects of noise letters upon the identification of a target letter in a nonsearch task. Perception & Psychophysics. 1974;16:143–149. [Google Scholar]
- Folstein MF, Folstein SE, McHugh PR. “Mini-mental state” A practical method for grading the cognitive state of patients for the clinician. J Psychiatr Res. 1975;12:189–198. doi: 10.1016/0022-3956(75)90026-6. [DOI] [PubMed] [Google Scholar]
- Fontbonne A, Berr C, Ducimetiere P, Alperovitch A. Changes in cognitive abilities over a 4-year period are unfavorably affected in elderly diabetic subjects: results of the Epidemiology of Vascular Aging Study. Diabetes Care. 2001;24:366–370. doi: 10.2337/diacare.24.2.366. [DOI] [PubMed] [Google Scholar]
- Fried LP, Carlson MC, McGill S, Seeman T, Xue QL, Frick K, Tan E, Tanner EK, Barron J, Frangakis C, Piferi R, Martinez I, Gruenewald T, Martin BK, Berry-Vaughn L, Stewart J, Dickersin K, Willging PR, Rebok GW. Experience Corps: a dual trial to promote the health of older adults and children’s academic success. Contemp Clin Trials. 2013;36:1–13. doi: 10.1016/j.cct.2013.05.003. http://dx.doi.org/10.1016/j.cct.2013.05.003. [DOI] [PMC free article] [PubMed] [Google Scholar]
- Garrett KD, Browndyke JN, Whelihan W, Paul RH, DiCarlo M, Moser DJ, Cohen RA, Ott BR. The neuropsychological profile of vascular cognitive impairment–no dementia: comparisons to patients at risk for cerebrovascular disease and vascular dementia. Arch Clin Neuropsychol. 2004;19:745–757. doi: 10.1016/j.acn.2003.09.008. [DOI] [PubMed] [Google Scholar]
- Gottesman RF, Coresh J, Catellier DJ, Sharrett AR, Rose KM, Coker LH, Shibata DK, Knopman DS, Jack CR, Mosley TH., Jr Blood pressure and white-matter disease progression in a biethnic cohort: Atherosclerosis Risk in Communities (ARIC) study. Stroke. 2010;41:3–8. doi: 10.1161/STROKEAHA.109.566992. [DOI] [PMC free article] [PubMed] [Google Scholar]
- Head D, Buckner RL, Shimony JS, Williams LE, Akbudak E, Conturo TE, McAvoy M, Morris JC, Snyder AZ. Differential vulnerability of anterior white matter in nondemented aging with minimal acceleration in dementia of the Alzheimer type:evidence from diffusion tensor imaging. Cereb Cortex. 2004;14:410–423. doi: 10.1093/cercor/bhh003. [DOI] [PubMed] [Google Scholar]
- Hedden T, Gabrieli JD. Insights into the ageing mind: a view from cognitive neuroscience. Nat Rev Neurosci. 2004;5:87–96. doi: 10.1038/nrn1323. [DOI] [PubMed] [Google Scholar]
- Hopfinger JB, Buonocore MH, Mangun GR. The neural mechanisms of top-down attentional control. Nat Neurosci. 2000;3:284–291. doi: 10.1038/72999. http://dx.doi.org/10.1038/72999. [DOI] [PubMed] [Google Scholar]
- Hurley LP, Dickinson LM, Estacio RO, Steiner JF, Havranek EP. Prediction of cardiovascular death in racial/ethnic minorities using Framingham risk factors. Circ Cardiovasc Qual Outcomes. 2010;3:181–187. doi: 10.1161/CIRCOUTCOMES.108.831073. [DOI] [PMC free article] [PubMed] [Google Scholar]
- Jacobs HI, Van Boxtel MP, Heinecke A, Gronenschild EH, Backes WH, Ramakers IH, Jolles J, Verhey FR. Functional integration of parietal lobe activity in early Alzheimer disease. Neurology. 2012a;78:352–360. doi: 10.1212/WNL.0b013e318245287d. [DOI] [PubMed] [Google Scholar]
- Jacobs HI, Van Boxtel MP, Jolles J, Verhey FR, Uylings HB. Parietal cortex matters in Alzheimer’s disease: an overview of structural, functional and metabolic findings. Neurosci Biobehav Rev. 2012b;36:297–309. doi: 10.1016/j.neubiorev.2011.06.009. [DOI] [PubMed] [Google Scholar]
- Jenkinson M, Bannister P, Brady M, Smith S. Improved optimization for the robust and accurate linear registration and motion correction of brain images. NeuroImage. 2002;17:825–841. doi: 10.1016/s1053-8119(02)91132-8. [DOI] [PubMed] [Google Scholar]
- Jennings JR, Muldoon MF, Ryan C, Price JC, Greer P, Sutton-Tyrrell K, van der Veen FM, Meltzer CC. Reduced cerebral blood flow response and compensation among patients with untreated hypertension. Neurology. 2005;64:1358–1365. doi: 10.1212/01.WNL.0000158283.28251.3C. [DOI] [PubMed] [Google Scholar]
- Kalmijn S, Foley D, White L, Burchfiel CM, Curb JD, Petrovitch H, Ross GW, Havlik RJ, Launer LJ. Metabolic cardiovascular syndrome and risk of dementia in Japanese-American elderly men. The Honolulu-Asia aging study. Arterioscler Thromb Vasc Biol. 2000;20:2255–2260. doi: 10.1161/01.atv.20.10.2255. [DOI] [PubMed] [Google Scholar]
- Kanaya AM, Barrett-Connor E, Gildengorin G, Yaffe K. Change in cognitive function by glucose tolerance status in older adults: a 4-year prospective study of the Rancho Bernardo study cohort. Arch Intern Med. 2004;164:1327–1333. doi: 10.1001/archinte.164.12.1327. [DOI] [PubMed] [Google Scholar]
- Kanwisher N, Wojciulik E. Visual attention: insights from brain imaging. Nat Rev Neurosci. 2000;1:91–100. doi: 10.1038/35039043. http://dx.doi.org/10.1038/35039043. [DOI] [PubMed] [Google Scholar]
- Kastner S, Pinsk MA, De Weerd P, Desimone R, Ungerleider LG. Increased activity in human visual cortex during directed attention in the absence of visual stimulation. Neuron. 1999;22:751–761. doi: 10.1016/s0896-6273(00)80734-5. [DOI] [PubMed] [Google Scholar]
- Kivipelto M, Helkala EL, Laakso MP, Hanninen T, Hallikainen M, Alhainen K, Soininen H, Tuomilehto J, Nissinen A. Midlife vascular risk factors and Alzheimer’s disease in later life: longitudinal, population based study. BMJ. 2001;322:1447–1451. doi: 10.1136/bmj.322.7300.1447. [DOI] [PMC free article] [PubMed] [Google Scholar]
- Kloppenborg RP, van den Berg E, Kappelle LJ, Biessels GJ. Diabetes and other vascular risk factors for dementia: which factor matters most? A systematic review. Eur J Pharmacol. 2008;585:97–108. doi: 10.1016/j.ejphar.2008.02.049. [DOI] [PubMed] [Google Scholar]
- Kuo HK, Sorond F, Iloputaife I, Gagnon M, Milberg W, Lipsitz LA. Effect of blood pressure on cognitive functions in elderly persons. J Gerontol A Biol Sci Med Sci. 2004;59:1191–1194. doi: 10.1093/gerona/59.11.1191. [DOI] [PMC free article] [PubMed] [Google Scholar]
- Luchsinger JA, Reitz C, Honig LS, Tang MX, Shea S, Mayeux R. Aggregation of vascular risk factors and risk of incident Alzheimer disease. Neurology. 2005;65:545–551. doi: 10.1212/01.wnl.0000172914.08967.dc. [DOI] [PMC free article] [PubMed] [Google Scholar]
- McKee AC, Au R, Cabral HJ, Kowall NW, Seshadri S, Kubilus CA, Drake J, Wolf PA. Visual association pathology in preclinical Alzheimer disease. J Neuropathol Exp Neurol. 2006;65:621–630. doi: 10.1097/00005072-200606000-00010. [DOI] [PubMed] [Google Scholar]
- Nyenhuis DL, Gorelick PB, Geenen EJ, Smith CA, Gencheva E, Freels S, deToledo-Morrell L. The pattern of neuropsychological deficits in vascular cognitive impairment-no dementia (Vascular CIND) Clin Neuropsychol. 2004;18:41–49. doi: 10.1080/13854040490507145. [DOI] [PubMed] [Google Scholar]
- Prvulovic D, Hubl D, Sack AT, Melillo L, Maurer K, Frolich L, Lanfermann H, Zanella FE, Goebel R, Linden DE, Dierks T. Functional imaging of visuospatial processing in Alzheimer’s disease. NeuroImage. 2002;17:1403–1414. doi: 10.1006/nimg.2002.1271. [DOI] [PubMed] [Google Scholar]
- Raz N, Gunning-Dixon FM, Head D, Dupuis JH, Acker JD. Neuroanatomical correlates of cognitive aging: evidence from structural magnetic resonance imaging. Neuropsychology. 1998;12:95–114. doi: 10.1037//0894-4105.12.1.95. [DOI] [PubMed] [Google Scholar]
- Reitan RM. Validity of the trail making test as an indicator of organic brain damage. Percept Mot Skills. 1958;8:271–276. [Google Scholar]
- Shulman GL, Ollinger JM, Akbudak E, Conturo TE, Snyder AZ, Petersen SE, Corbetta M. Areas involved in encoding and applying directional expectations to moving objects. J Neurosci. 1999;19:9480–9496. doi: 10.1523/JNEUROSCI.19-21-09480.1999. [DOI] [PMC free article] [PubMed] [Google Scholar]
- Smith SM, Jenkinson M, Woolrich MW, Beckmann CF, Behrens TE, Johansen-Berg H, Bannister PR, De Luca M, Drobnjak I, Flitney DE, Niazy RK, Saunders J, Vickers J, Zhang Y, De Stefano N, Brady JM, Matthews PM. Advances in functional and structural MR image analysis and implementation as FSL. NeuroImage. 2004;23(Suppl 1):S208–S219. doi: 10.1016/j.neuroimage.2004.07.051. [DOI] [PubMed] [Google Scholar]
- Smith SM, Zhang Y, Jenkinson M, Chen J, Matthews PM, Federico A, De Stefano N. Accurate, robust, and automated longitudinal and cross-sectional brain change analysis. NeuroImage. 2002;17:479–489. doi: 10.1006/nimg.2002.1040. [DOI] [PubMed] [Google Scholar]
- Sperling RA, Dickerson BC, Pihlajamaki M, Vannini P, LaViolette PS, Vitolo OV, Hedden T, Becker JA, Rentz DM, Selkoe DJ, Johnson KA. Functional alterations in memory networks in early Alzheimer’s disease. Neuromolecular Med. 2010;12:27–43. doi: 10.1007/s12017-009-8109-7. http://dx.doi.org/10.1007/s12017-009-8109-7. [DOI] [PMC free article] [PubMed] [Google Scholar]
- Steiger JH. Tests for comparing elements of a correlation matrix. Psychol Bull. 1980;87:245–251. http://dx.doi.org/10.1037/0033-2909.87.2.245. [Google Scholar]
- van Harten B, de Leeuw FE, Weinstein HC, Scheltens P, Biessels GJ. Brain imaging in patients with diabetes: a systematic review. Diabetes Care. 2006;29:2539–2548. doi: 10.2337/dc06-1637. [DOI] [PubMed] [Google Scholar]
- van Veen V, Cohen JD, Botvinick MM, Stenger VA, Carter CS. Anterior cingulate cortex, conflict monitoring, and levels of processing. NeuroImage. 2001;14:1302–1308. doi: 10.1006/nimg.2001.0923. [DOI] [PubMed] [Google Scholar]
- Vannini P, Almkvist O, Dierks T, Lehmann C, Wahlund LO. Reduced neuronal efficacy in progressive mild cognitive impairment: a prospective fMRI study on visuospatial processing. Psychiatry Res. 2007;156:43–57. doi: 10.1016/j.pscychresns.2007.02.003. http://dx.doi.org/10.1016/j.pscychresns.2007.02.003. [DOI] [PubMed] [Google Scholar]
- West RL. An application of prefrontal cortex function theory to cognitive aging. Psychol Bull. 1996;120:272–292. doi: 10.1037/0033-2909.120.2.272. [DOI] [PubMed] [Google Scholar]
- Whitfield-Gabrieli S. Artifact detection tool. MIT; 2009. http://web.mit.edu/swg/art/art.pdf. [Google Scholar]
- Whitmer RA, Sidney S, Selby J, Johnston SC, Yaffe K. Midlife cardiovascular risk factors and risk of dementia in late life. Neurology. 2005;64:277–281. doi: 10.1212/01.WNL.0000149519.47454.F2. [DOI] [PubMed] [Google Scholar]
- Wilkinson GS. The Wide Range Achievement Test: Manual. 3. Wide Range Inc; Wilmington, DE: 1993. [Google Scholar]
- Wojciulik E, Kanwisher N. The generality of parietal involvement in visual attention. Neuron. 1999;23:747–764. doi: 10.1016/s0896-6273(01)80033-7. [DOI] [PubMed] [Google Scholar]
- Worsley KJ. Statistical analysis of activation images. In: Jezzard P, Matthews PM, Smith SM, editors. Functional MRI: An Introduciton to Methods. Oxford University Press; New York: 2001. [Google Scholar]