Abstract.
Investigating the elasticity of ocular tissue (cornea and intraocular lens) could help the understanding and management of pathologies related to biomechanical deficiency. In previous studies, we introduced a setup based on optical coherence tomography for shear wave elastography (SWE) with high resolution and high sensitivity. SWE determines tissue stiffness from the propagation speed of shear waves launched within tissue. We proposed acoustic radiation force to remotely induce shear waves by focusing an ultrasound (US) beam in tissue, similar to several elastography techniques. Minimizing the maximum US pressure is essential in ophthalmology for safety reasons. For this purpose, we propose a pulse compression approach. It utilizes coded US emissions to generate shear waves where the energy is spread over a long emission, and then numerically compressed into a short, localized, and high-energy pulse. We used a 7.5-MHz single-element focused transducer driven by coded excitations where the amplitude is modulated by a linear frequency-swept square wave (1 to 7 kHz). An inverse filter approach was used for compression. We demonstrate the feasibility of performing shear wave elastography measurements in tissue-mimicking phantoms at low US pressures (mechanical index ).
Keywords: optical coherence elastography, optical coherence tomography, shear wave elastography, ultrasound radiation force, pulse compression, coded excitation
1. Introduction
Acoustic radiation force (ARF) is commonly used to remotely generate displacements in tissue. Monitoring the subsequent tissue response provides information on tissue elastic properties, as proposed in a number of elastography methods developed over the past 20 years. For instance, in ARF impulse imaging,1 tissue stiffness is qualitatively estimated from the amplitude of the ARF-induced displacements in the near field. In shear wave elastography,2,3 stiffness is deduced from the propagation speed of the displacements through tissue.
Inspired by advances in ultrasound (US)-based elastography, optical coherence tomography (OCT) is now being investigated as a high-resolution imaging modality for elastographic imaging.4–11 OCT offers several advantages over US: it provides micron-scale spatial resolution with nanometer-scale sensitivity to tissue displacement and is a fully noncontact imaging method. OCT is routinely used in ophthalmology to provide structural information on both anterior and posterior segments of the eye.
Structural images of the cornea and the intraocular lens could be complemented by elastography since the function of these two components of the eye is intrinsically related to their biomechanical properties. For instance, a number of refractive surgery procedures have been developed to correct corneal shape and tensile strength. Corneal elastography could become a tool for better understanding of underlying pathologies (e.g., myopia and ectasia), as well as a more comprehensive and personalized pre and postoperative management tool for surgery. As for the intraocular lens, all individuals are subject to a stiffening of the lens with age, which reduces the ability to accommodate (presbyopia). Assessing the evolution of lens elasticity and the efficiency of therapeutic solutions could have great clinical impact.
Several groups have developed OCT-based methods for ophthalmic applications.12,13 The method presented in Ref. 12 measures the strain in the cornea resulting from a mechanical compression. The compression requires contact with the cornea, which might restrict clinical implementation. Besides, strain imaging is an indirect estimation of tissue stiffness often biased by uneven stress distributions caused by boundary conditions. In Ref. 13, an air-puff is used as a noncontact shear source. Although it cannot reach the intraocular lens, it constitutes an interesting in vivo applicable technique for the cornea. Global values of tissue stiffness are retrieved from estimates of global propagation shear wave speed, but no mapping of the local stiffness was derived.
In a previous paper,14 we presented a system for shear wave elastography using phase-sensitive OCT (PhS-OCT) and ARF to map the stiffness of tissue-mimicking phantoms. ARF can potentially generate shear waves in the cornea as well as in the intraocular lens. However, clinical translation of this system to ocular tissues is limited by the high US pressures required to induce shear waves. The mechanical index (MI), (calculated as the peak-negative US pressure divided by the square root of the US frequency), is indeed limited by the Food and Drug Administration to 0.23 for ocular tissues, whereas it can go up to 1.90 for most other organs. This MI limitation imposes a challenge for PhS-OCT systems with sufficient sensitivity to detect dynamic shear waves in ocular tissue.
To meet this challenge, in this study we propose a pulse compression approach to generate shear waves using low US pressures. Pulse compression, as introduced in sonar imaging,15–17 uses long coded signals to spread a large amount of energy over long time periods, and then numerically compresses all the energy into a short pulse of high instantaneous energy. In other words, it can achieve a high signal-to-noise ratio (SNR) at lower peak amplitudes. We implemented pulse compression for shear waves in a previous work using a mechanical actuator as a contact shear source.18 Here, we extend this approach to ARF using amplitude-modulated ARF to generate shear waves with a minimal contact, low-MI method.
2. Material and Methods
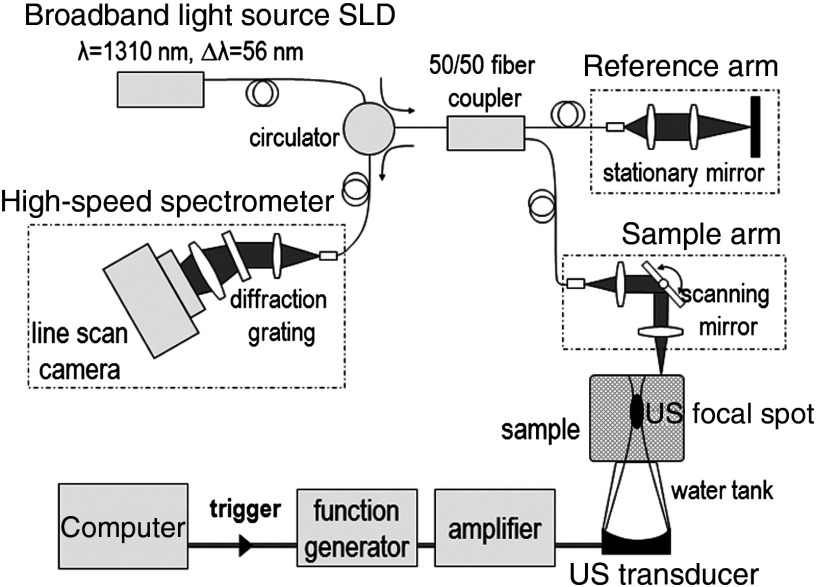
Figure 1 is a schematic of our setup, which combines a PhS-OCT system for detection and a single-element US transducer for shear wave generation. A detailed description can be found in Refs. 14, 19, and 20.
Fig. 1.
Experimental setup for shear wave elastography combining a phase-sensitive OCT (PhS-OCT) system and an ultrasound (US) single-element transducer.
2.1. Phase-Sensitive Optical Coherence Tomography
PhS-OCT uses a spectral-domain OCT setup, consisting of a fiber-based Michelson interferometer illuminated by a broadband super-luminescent diode (DenseLight Semiconductors Ltd, Singapore, central wavelength 1310 nm, bandwidth 56 nm). The light source is split between a reference arm and a sample arm. The sample arm illuminates the sample from the top. The backscattered light from the sample is recombined with the reference light in a circulator and the resulting spectral interferogram is detected by an ultrafast camera (Sensors Ltd, NJ, USA) operating at an A-line rate of 45 kHz. One A-line corresponds to a depth profile at one given lateral location of the sample.
In PhS-OCT, the phase difference between two consecutive A-lines acquired at the same lateral location provides the axial displacement :
| (1) |
where is the light source central wavelength, is the refractive index of the sample, () are the lateral and axial coordinates of the pixel, respectively, and is the time.
Stroboscopic acquisition of shear wave propagation is used with PhS-OCT operating in an M-B scan mode: each M-scan consists of 256 A-lines acquired at the same lateral location at a 45-kHz line rate. Each M-B scan is a set of 128 M-scans acquired at different lateral locations. Shear wave generation is repeated and synchronized for each M-scan. Thus, an M-B scan provides a movie of shear wave propagation across the sample at an equivalent frame rate of 45 kHz. The dimensions of the imaging area are () with a pixel size of (). The axial and lateral resolutions are, respectively, 10 and in water. The total acquisition time is .
2.2. Shear Wave Generation using Acoustic Radiation Force
A single-element transducer (SonicConcept, WA, United States, central frequency 7.5 MHz, focal distance 35 mm, diameter 23 mm) was used to apply radiation force within the sample. The transducer was placed at the bottom of the sample, opposite to the OCT imaging beam, and the focal spot of the ultrasound beam was placed within the OCT field of view. Water was the coupling medium between the transducer and the sample. The sample was also covered with a thin layer of echographic gel to prevent strong US reflections at the sample top surface,14 and a thin cover glass to avoid surface ripple artifacts.14,19 The layer of gel also works as a mechanical coupling medium that reduces the effect of surface acoustic waves at the top interface of the sample.
The transducer was calibrated in water using a hydrophone (HGL aperture, Onda Corporation, Sunnyvale, CA, United States). The focal spot size was determined from the full-width at half maximum of the pressure field and was measured to be approximately (). Thus, the US focal spot is long enough to ensure that radiation force is applied across the entire imaging depth range, while its limited lateral width produces shear wavelengths smaller than the lateral imaging range.
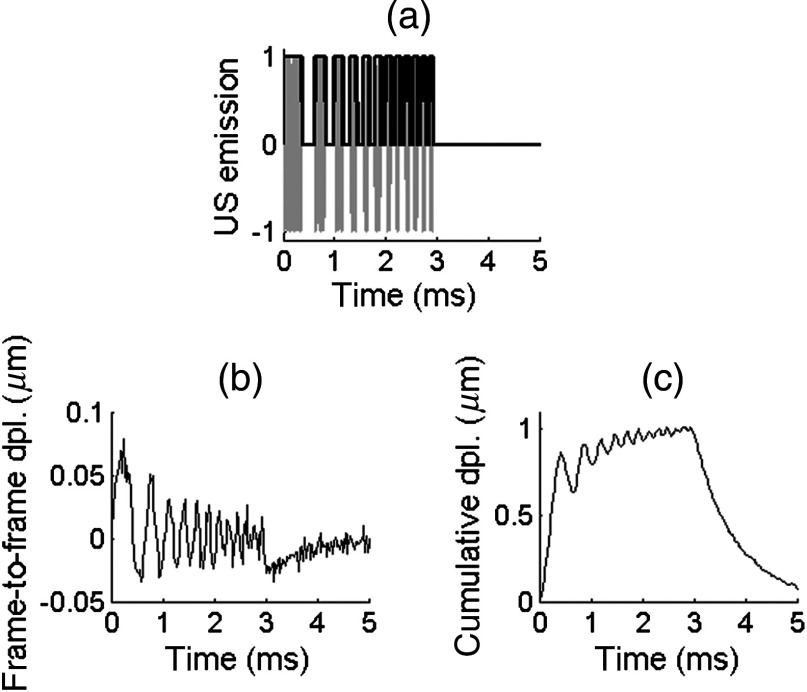
As illustrated in Fig. 2, the transducer was driven using a coded excitation in which a 7.5-MHz sine wave is modulated in amplitude by a binary “chirp,” i.e., a linear frequency-swept square wave (frequency range [1 to 7] kHz, duration 3 ms, duty cycle 50%). Peak-to-peak voltages between 20 and 60 were applied, resulting in ultrasound peak pressures between 1 and 3 MPa. The results of the coded excitation were compared to those of a “conventional” pulse (central frequency 7.5 MHz) at equivalent peak pressures.
Fig. 2.
Axial displacements detected in a 10%-gelatin phantom. (a) Coded US emission consisting of a 7.5-MHz sine wave (gray line) modulated in amplitude by a linear frequency-swept square wave (black bold line, frequency from 1 to 7 kHz, duration 3 ms, duty cycle 50%, ultrasound peak pressure 3 MPa). (b) Frame-to-frame displacements (i.e., displacements occurring between two consecutive frames) sampled at 45 kHz and averaged axially over five pixels. (c) Corresponding cumulative displacements.
2.3. Pulse Compression
Linear-frequency-swept shear waves resulting from coded excitation were recorded and then numerically compressed by pulse compression. The pulse compression algorithm parallels work that was described in Ref. [17] and is detailed in Ref. [18]. It is based on an inverse filter designed as follows:
-
•
A reference signal is defined by averaging along depth the displacements at (point near the shear source).
-
•An ideal output pulse is derived from the autocorrelation of the reference signal:
where is a weighting function designed to eliminate side lobes of the autocorrelation. and * denote, respectively, convolution and multiplication.(2) -
•The inverse filter is designed by inverting
(3)
2.4. Shear Wave Speed Map Reconstruction
The shear wave speed was computed at each pixel of the imaging plane using a time-of-flight algorithm:21 assuming that plane shear waves propagate in the lateral direction, signals from neighboring lateral locations were correlated to determine the travel time of the shear wave between these locations, yielding the local propagation speed. At each depth of the imaging plane, correlations were performed across 2, 4, and 6 pixel wide windows and the results of these three window widths were averaged to provide the final speed estimate. In addition, estimates with normalized correlation coefficients lower than 0.9 were rejected.
In an incompressible, isotropic medium, the Young’s modulus E is linked to the shear wave speed:
| (4) |
where is the medium density.
2.5. Phantom Preparation
Experiments were conducted on tissue-mimicking phantoms made of aqueous solutions containing porcine gelatin (Sigma Aldrich, MO, United States) and latex microspheres (diameter , Duke Scientific, CA, United States). The microspheres were used as optical scatterers (typical concentration to 1.5% w/v). Various gelatin concentrations (from 5% to 10% w/v) were used to control phantom stiffness.
3. Results
3.1. Displacement Signal-To-Noise Ratio
The coded excitation driving the US transducer is shown in Fig. 2(a). The resulting displacements detected in a 10%-gelatin phantom are a linear frequency-swept signal, as shown in Fig. 2(b), with low frequencies () occurring at early times and higher frequencies occurring at later times. This temporal profile was obtained by averaging the displacement field at one lateral position over five axial pixels. For this example, the US peak pressure was 3 MPa (). These displacements are frame-to-frame displacements, i.e., displacements occurring between two consecutive frames. Thus, they tend to represent the temporal derivative of the real displacement of the sample. The real displacement can be retrieved by integrating over time these frame-to-frame displacements. Because there is not enough dead time between each “on”-cycle of the coded excitation for the sample to relax from the acoustic radiation force, the real displacement consists of a linear frequency swept, low-amplitude oscillation superimposed on low frequency, large amplitude motion [see Fig 2(c)].
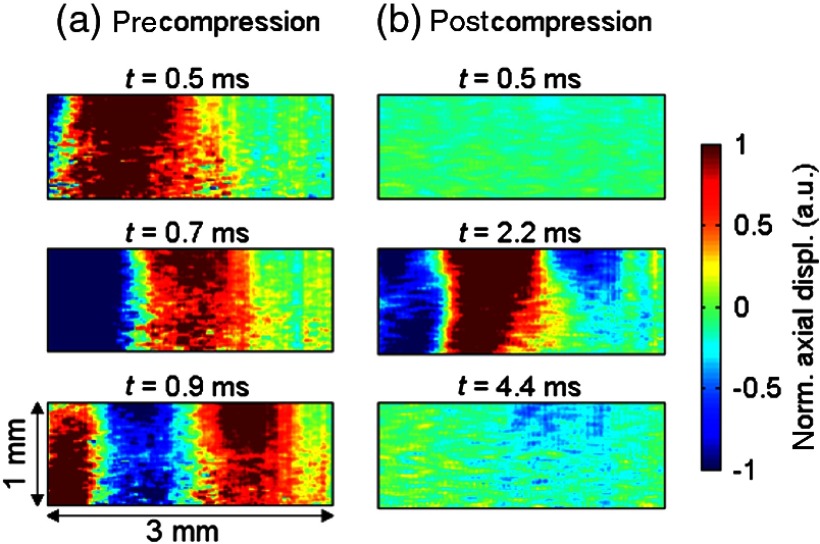
Figure 3 shows the snapshots of shear wave propagation resulting from the coded excitation in a 10%-gelatin phantom, before and after applying pulse compression. Raw displacements [Fig. 3(a)] are a linear frequency-swept wave. This corresponds to the same dataset as that shown in Fig. 2(b). Figure 3(b) shows the displacements obtained after applying the pulse compression algorithm to raw displacements (as explained in the previous section). The postcompression displacement consists of a short, spatially localized pulse (main lobe occurring at ). The secondary lobes seen at later times () are primarily imperfections of the pulse compression algorithm due to the tradeoff in inverse filtering between SNR gain and side-lobe levels for a finite length code.
Fig. 3.
Snapshots of shear wave propagation induced in a 10%-gelatin phantom using a coded excitation at an US peak pressure of 3 MPa. The shear source is located on the left edge of the imaging plane. The shear wave propagates from left to right. (a) Raw detected displacements. (b) Displacements obtained after pulse compression.
Displacement fields are displayed on a normalized scale to facilitate the comparison between pre and postcompression displacements. The order of magnitude of the absolute amplitude of the raw displacements is approximately 150 nm [as shown in Fig. 2(b)].
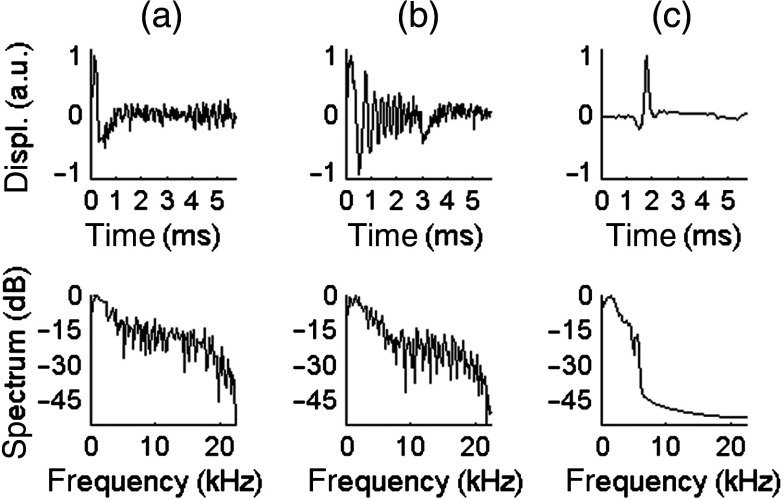
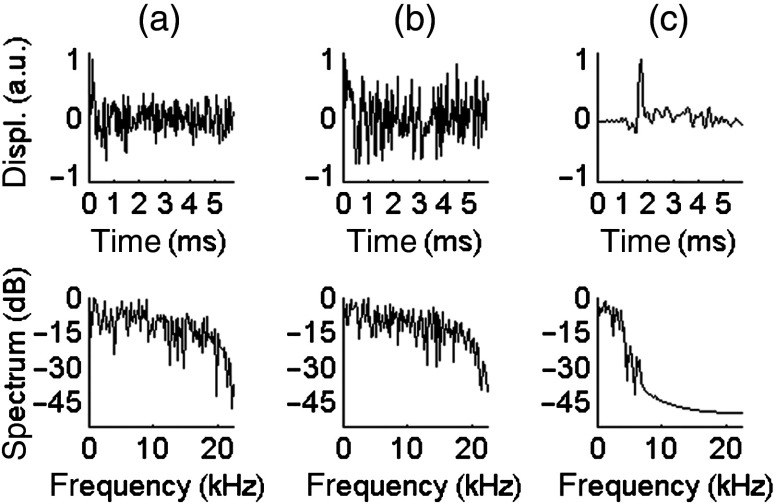
Figures 4 and 5 compare the displacements resulting from different excitations at 3 and 1.5 MPa ( and 0.55, respectively). In these two figures, the temporal profile is displayed in the top row and the spectrum is displayed in the bottom row. The left column [Figs. 4(a) and 5(a)] is the result of a pulse. The center column [Figs. 4(b) and 5(b)] shows the raw displacements obtained from coded excitation before pulse compression. The right column [Figs. 4(c) and 5(c)] shows the displacements obtained after applying pulse compression. For each case, the SNR was computed from the power spectrum. The displacements resulting from coded excitation have the same bandwidth as the US driving signal (1 to 7 kHz). The pulse generates a shear wave with a frequency range of [1 to 5] kHz and a SNR of 12.3 dB and 4.8 dB at US peak pressures of 3 and 1.5 MPa, respectively. A gain of approximately 30 dB is obtained using pulse compression, as seen in these figures.
Fig. 4.
Temporal profile (top row) and spectrum (bottom row) of the displacements obtained in a 10%-gelatin phantom for an US peak pressure of 3 MPa, averaged axially over five pixels. (a) Conventional pulse, . (b) Coded excitation before pulse compression, . (c) Coded excitation after pulse compression, .
Fig. 5.
Temporal profile (top row) and spectrum (bottom row) of the displacements obtained in a 10%-gelatin phantom for an US peak pressure of 1.5 MPa, averaged axially over five pixels. (a) Conventional pulse, . (b) Coded excitation before pulse compression, SNR = 4.9 dB. (c) Coded excitation after pulse compression, .
3.2. Reconstruction of Shear Wave Speed Maps
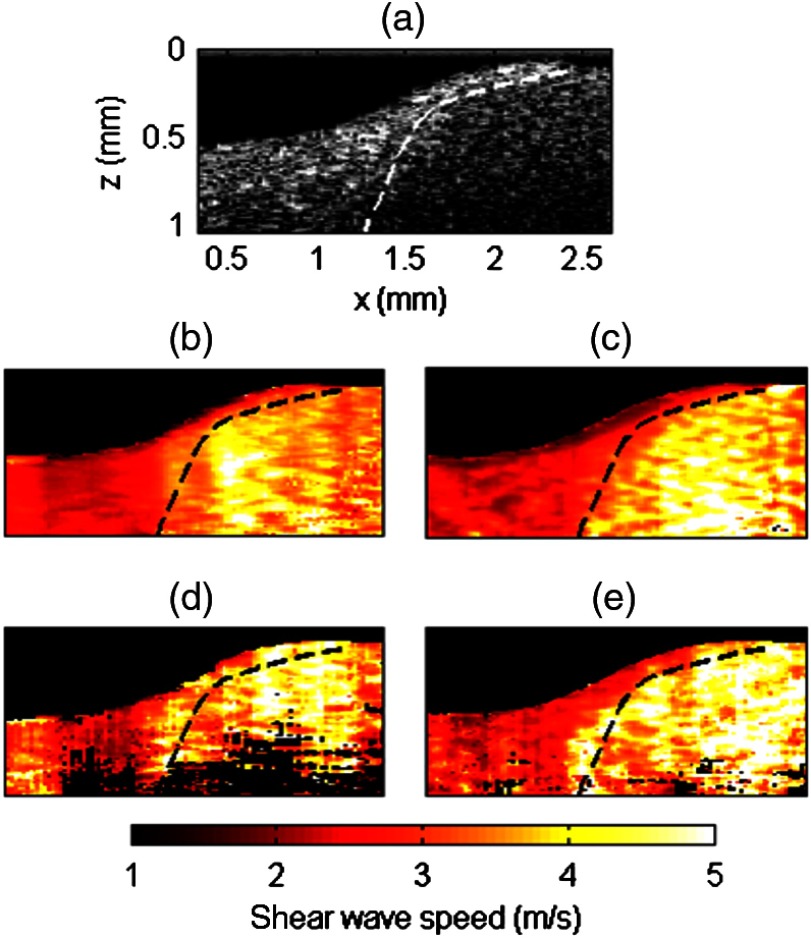
We compared the performance of coded excitation, in terms of the quality of the reconstructed shear wave speed map, to that of a conventional pulse at an equivalent US peak pressure. For this purpose, a heterogeneous phantom was made using two different gelatin concentrations: 5% gelatin for the left part, 10% for the right part. Both parts also contained different optical scatterer concentrations so that they could be identified in the B-mode from the intensity of the backscattered light [see Fig. 6(a), 1.5% latex for the left part and 1% latex for the right part]. Figures 6(b) to 6(e) are stiffness maps: the shear wave speed is displayed in color wherever the normalized correlation coefficient of the time-of-flight estimate is greater than 0.9. The dashed line delineates the boundary between both parts of the phantom, as determined from the B-mode image and presented as a visual indicator (dashed line) on the stiffness maps. A mask based on OCT signal intensity and the shear wave time-of-flight correlation coefficient was applied to the wave speed maps, so that regions with low OCT signal (intensity ) or pixels with poor quality in time-of-flight estimate (normalized correlation coefficient ) were shown in black.
Fig. 6.
Reconstruction of stiffness maps in a heterogeneous phantom. For this example, the shear source was located at the right edge of the imaging plane. (a) B-mode image of the phantom which is made of two parts of different gelatin concentrations (5%-gelatin for the left part, 10%-gelatin for the right part). The dash line delineates the boundary between the two parts. (b–e) Shear wave speed maps obtained using either a conventional pulse (b and d) or a coded excitation (c and e), at US peak pressure of 3 MPa (b and c) or 1.5 MPa (d and e).
At a US peak pressure of 3 MPa (), both conventional pulse [Fig. 6(b)] and coded excitation [Fig. 6(c)] provide a sufficiently high-SNR shear wave to estimate the shear wave speed at every location of the imaging plane. However, the pulse compression approach [Fig. 6(c)] better delineates both parts of the phantom: the demarcation between soft and stiff parts closely matches the dashed line. Indeed, a greater SNR for the shear wave produces more accurate shear wave speed estimates.
At a US peak pressure of 1.5 MPa (), the conventional pulse fails to reconstruct the shear wave speed at the bottom of the imaging plane, whereas the pulse compression approach recovers the speed in the entire imaging area. Because of light attenuation, the deepest regions have the lowest sensitivity and are thus more likely to exhibit poor SNR. Furthermore, the 1.5-MPa conventional pulse yields artifacts at the left edge of the imaging plane (relatively high speed values are obtained in the soft part of the phantom). Such artifacts are reduced using pulse compression.
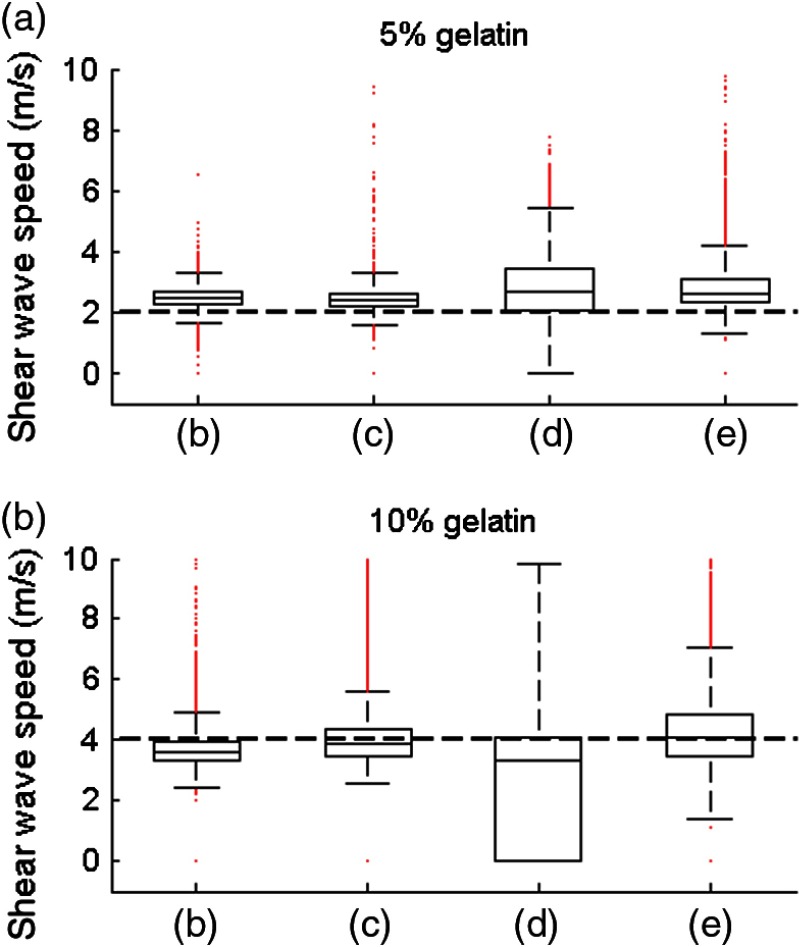
A more quantitative comparison is displayed in Fig. 7, which shows a box plot for each speed map shown in Fig. 6 for both soft and stiff parts of the phantom. The dashed line corresponds to the expected mean values extracted from the literature: according to Ref. 22, a 5%- and 10%-gelatin phantom are expected to exhibit a shear wave speed of 2 and , respectively. At equivalent US peak pressures, the pulse compression approach provides median values that are closer to expected values. The values within the 25th and 75th percentiles are also more concentrated around the median values with the pulse compression approach. All experimental values are slightly higher than the expected value for the 5%-gelatin part. This might be caused by imperfections in phantom fabrication.
Fig. 7.
Box plot of the shear wave speed values in, respectively, (a) and (b) of the phantom. The central line in each box represents the median value, the box edges represent the 25th and 75th percentiles, the whiskers represent the extent of the data not considered as outliers, and the red dots represent outliers. The horizontal black dash line represents the expected values extracted from the literature.22 The letters on the axis refer to the corresponding speed maps shown in Fig. 6 and indicate different excitations: (b) pulse at 3 MPa, (c) coded excitation at 3 MPa, (d) pulse at 1.5 MPa, (e) coded excitation at 1.5 MPa.
4. Discussion
In previous work,14 we introduced a system combining PhS-OCT and acoustic radiation force for shear wave elastography. Here, we implemented a pulse compression approach by emitting coded US excitations to enhance the SNR of the induced shear wave signals, thus providing an opportunity to reduce ARF power needed to launch shear waves detectable by the PhS-OCT technique. We demonstrated that amplitude-modulated acoustic radiation force could be used to induce linear frequency-swept shear waves in the kHz range. We obtained an SNR gain of approximately 30 dB using the pulse compression approach compared to a conventional pulse at an equivalent MI. At a low MI, the enhanced SNR enables reconstruction of the speed map over a larger imaging area. This paves the way for shear wave elastography using acoustic radiation force with a low MI. This is particularly important for ophthalmic applications, where the MI is limited to 0.23 (compared to 1.90 for most other organs).
Greater SNR also provides better accuracy in the estimated shear wave speed, because speed is determined from the correlation of the displacement field. It should be noted that in shear wave elastography, accuracy and spatial resolution are not only governed by the shear wavelength but also depend on other parameters such as: displacement SNR, the width of the correlation window used in the time-of-flight algorithm, and the elastic contrast between the target and the background.23
The main potential limitation of the pulse compression approach is the need for long US emissions that create high spatial peak, temporal average intensity (ISPTA). Here, we compared a pulse with a 1.5-ms emission (3-ms coded emission with 50% duty cycle). Trade-offs between decreasing the MI and increasing the ISPTA will need to be optimized. It should be noted that the MI is linearly proportional to the US peak pressure, whereas the ISPTA is proportional to the square of the US peak pressure (i.e., intensity) and the emission duration. Thus, a decrease of a factor in peak pressure divides the MI by and the ISPTA by . In other words, for a given ISPTA, a decrease by a factor in pressure allows an increase of a factor in emission duration.
A simple way to decrease the ISPTA is to reduce the repetition rate of the US emission in return for a longer acquisition time. Another approach consists of acquiring multiple M-scans for each shear wave (as opposed to repeating shear wave generation at each M-scan as done in the current configuration). With a higher line-rate camera employed in the PhS-OCT system, interleaved M-scans could be acquired at different lateral locations while preserving a reasonable equivalent frame rate. This would reduce the need for repeating shear wave generation, thus reducing ISPTA.
Coded excitations can shape the spectral content of the shear wave. Being able to generate broadband shear waves with precise bandwidth control could help to assess the potential dispersive behavior of the shear wave. Dispersion can be induced by tissue viscosity or particular propagation modes. For the case of the cornea and other thin-layered tissues, strong boundary conditions occur at the walls, forcing the shear wave into a guided propagation mode (Lamb-like waves) that affects its propagation speed as a function of frequency (i.e., dispersion). Several studies have investigated these effects24–26 and could benefit from broad bandwidth shear waves.
Many shear wave elastography methods use US for both shear wave generation and detection. However, amplitude-modulated ARF is difficult to implement with US detection for two main reasons. First, US cannot image the tissue displacement during ARF emission. For example, if a ms-long ARF emission is used, the first few mm of propagation cannot be recorded because the receive electronics in the front-end of the ultrasonic imaging system are saturated by the excitation pulse. This means that the shear source should be several millimeters away from the detection area, possibly causing great attenuation of the shear wave by the time it reaches the imaging area. Second, the coded excitation presented in this study induces oscillations that are less than in amplitude (on top of a large, low-frequency displacement). Such small displacements were detected given the high sensitivity of PhS-OCT but would be challenging for US detection.
All the experiments shown here were performed in tissue-mimicking phantoms. The feasibility of PhS-OCT to track shear waves in vivo has been demonstrated in a previous study27 where shear waves were induced by a mechanical actuator (contact shear source). The use of acoustic radiation force as a remote shear source can help to accelerate clinical translation of optical coherence elastography (OCE). However, the current setup is not still usable in vivo since the US transducer is placed at the bottom of the sample, opposite to the OCT imaging beam.
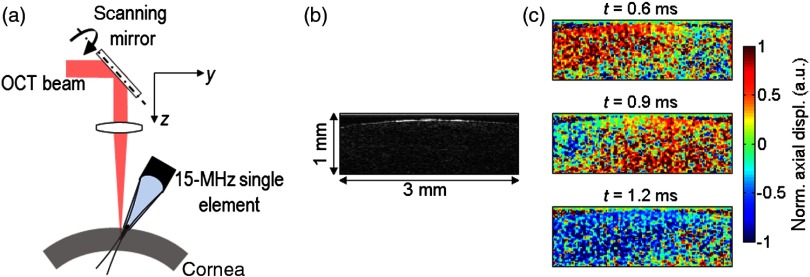
As a very first step toward single-sided OCE with ARF for in vivo applications, a setup has been developed using a 15-MHz single-element US transducer (Panametrics V319, MA, United States, focal distance 2.54 cm, diameter 1.25 cm) placed on the same side as the OCT imaging beam. Other groups have reported on a focused air-puff for in vivo generation of surface waves on the cornea.13,28 This method is easy to use on the cornea, but it cannot be used for shear wave generation at greater depths. Here, a plastic cone (maximal diameter 1.25 cm, minimal diameter couples ultrasound to the sample and is tilted with a slight angle in elevation with respect to the imaging plane so that it does not block the OCT imaging beam. Figure 8 shows the displacement induced in an ex vivo porcine cornea using this one-sided system. For this very first preliminary experiment, the transducer was driven by a conventional pulse at a peak pressure of 0.94 MPa (), representing an MI approaching the limit for ocular applications. Clearly, measurable displacements are evident but the relatively low SNR could be increased using the pulse compression approach described in this paper. Future studies will use this system with a range of high-frequency transducers and coded excitations to explore the limits of ARF-based OCE.
Fig. 8.
One-sided setup based on a 15-MHz single-element US transducer placed on the same side as the OCT imaging beam. (a) Schematic of the setup. (b) B-mode image of an ex vivo porcine cornea. (c) Snapshots of the propagation of the shear wave induced in an ex vivo porcine cornea at . The US transducer is placed on the left of the imaging range, and the shear wave propagated from left to right.
5. Conclusion
We have demonstrated a pulse compression approach based on amplitude-modulated ARF to generate shear waves at low MI but with a higher ISPTA. We have combined this approach with a PhS-OCT setup to perform shear wave elastography experiments. At equivalent US pressures, the pulse compression approach provides a 30-dB SNR gain of detected displacements, enabling better reconstruction of stiffness maps in a tissue-mimicking phantom. Ongoing work is focused on optimizing the trade-off between reduced MI and higher ISPTA, as well as upgrading the setup for in vivo experiments.
Acknowledgments
This work was supported in part by NIH RO1EB016034, R01CA170734, R01EB009682, R01HL093140, R01DC010201, Life Sciences Discovery Fund 3292512, the Coulter Translational Research Partnership Program, and the Department of Bioengineering at the University of Washington.
Biography
Biographies of the authors are not available.
References
- 1.Nightingale K., et al. , “Acoustic radiation force impulse imaging: in vivo demonstration of clinical feasibility,” Ultrasound Med. Biol. 28(2), 227–235 (2002). 10.1016/S0301-5629(01)00499-9 [DOI] [PubMed] [Google Scholar]
- 2.Sarvazyan A. P., et al. , “Shear wave elasticity imaging: a new ultrasonic technology of medical diagnosis,” Ultrasound Med. Biol. 24(9), 1419–1435 (1998). 10.1016/S0301-5629(98)00110-0 [DOI] [PubMed] [Google Scholar]
- 3.Tanter M., et al. , “Quantitative assessment of breast lesion viscoelasticity: initial clinical results using supersonic shear imaging,” Ultrasound Med. Biol. 34(9), 1373–1386 (2008). 10.1016/j.ultrasmedbio.2008.02.002 [DOI] [PubMed] [Google Scholar]
- 4.Kennedy B. F., et al. , “In vivo dynamic optical coherence elastography using a ring actuator,” Opt. Express 17(24), 21762–21772 (2009). 10.1364/OE.17.021762 [DOI] [PubMed] [Google Scholar]
- 5.Kennedy B. F., et al. , “In vivo three-dimensional optical coherence elastography,” Opt. Express 19(7), 6623–6634 (2011). 10.1364/OE.19.006623 [DOI] [PMC free article] [PubMed] [Google Scholar]
- 6.Liang X., et al. , “Acoustomotive optical coherence elastography for measuring material mechanical properties,” Opt. Lett. 34(19), 2894–2896 (2009). 10.1364/OL.34.002894 [DOI] [PMC free article] [PubMed] [Google Scholar]
- 7.Liang X., et al. , “Dynamic spectral-domain optical coherence elastography for tissue characterization,” Opt. Express 18(13), 14183–14190 (2010). 10.1364/OE.18.014183 [DOI] [PMC free article] [PubMed] [Google Scholar]
- 8.Nahas A., et al. , “3D static elastography at the micrometer scale using full field OCT,” Biomed. Opt. Express 4(10), 2874–2883 (2013). 10.1364/BOE.4.002138 [DOI] [PMC free article] [PubMed] [Google Scholar]
- 9.Nahas A., et al. , “From supersonic shear wave imaging to full-field optical coherence shear wave elastography,” J. Biomed. Opt. 18(12), 121514 (2013). 10.1117/1.JBO.18.12.121514 [DOI] [PubMed] [Google Scholar]
- 10.Qi W., et al. , “Phase-resolved acoustic radiation force optical coherence elastography,” J. Biomed. Opt. 17(11), 110505 (2012). 10.1117/1.JBO.17.11.110505 [DOI] [PMC free article] [PubMed] [Google Scholar]
- 11.Razani M., et al. , “Feasibility of optical coherence elastography measurements of shear wave propagation in homogeneous tissue equivalent phantoms,” Biomed. Opt. Express 3(5), 972–980 (2012). 10.1364/BOE.3.000972 [DOI] [PMC free article] [PubMed] [Google Scholar]
- 12.Ford M. R., et al. , “Method for optical coherence elastography of the cornea,” J. Biomed. Opt. 16(1), 016005 (2011). 10.1117/1.3526701 [DOI] [PMC free article] [PubMed] [Google Scholar]
- 13.Wang S., Larin K. V., “Shear wave imaging optical coherence tomography (SWI-OCT) for ocular tissue biomechanics,” Opt. Lett. 39(1), 1–4 (2014). 10.1364/OL.39.000041 [DOI] [PMC free article] [PubMed] [Google Scholar]
- 14.Nguyen T.-M., et al. , “Visualizing ultrasonically induced shear wave propagation using phase-sensitive optical coherence tomography for dynamic elastography,” Opt. Lett. 39(5), 838–841 (2014). [DOI] [PMC free article] [PubMed] [Google Scholar]
- 15.Cookt C. E., “Pulse compression-key to more efficient radar transmission,” Proc. IRE 31, 310–316 (1959). [Google Scholar]
- 16.Kroszczynski J. J., “Pulse compression by means of linear-period modulation,” Proc. IEEE 57(7), 1260–1266 (1969). 10.1109/PROC.1969.7230 [DOI] [Google Scholar]
- 17.O’Donnell M., “Coded excitation system for improving the penetration of real-time phased-array imaging systems,” IEEE Trans. Ultrason. Ferroelectr. Freq. Control 39(3), 341–351 (1992). 10.1109/58.143168 [DOI] [PubMed] [Google Scholar]
- 18.Nguyen T. M., et al. , “Shear wave pulse compression for dynamic elastography using phase-sensitive optical coherence tomography,” J. Biomed. Opt. 19(1), 016013 (2014). 10.1117/1.JBO.19.1.016013 [DOI] [PMC free article] [PubMed] [Google Scholar]
- 19.Song S., Huang Z., Wang R. K., “Tracking mechanical wave propagation within tissue using phase sensitive optical coherence tomography: Motion artefact and its compensation,” J. Biomed. Opt. 18(12), 121505 (2013). 10.1117/1.JBO.18.12.121505 [DOI] [PubMed] [Google Scholar]
- 20.Song S., et al. , “Shear modulus imaging by direct visualization of propagating shear waves with phase-sensitive optical coherence tomography,” J. Biomed. Opt. 18(12), 121509 (2013). 10.1117/1.JBO.18.12.121509 [DOI] [PMC free article] [PubMed] [Google Scholar]
- 21.McLaughlin J., Renzi D., “Shear wave speed recovery in transient elastography and supersonic imaging using propagating fronts,” Inverse Probl. 22(2), 681–706 (2006). 10.1088/0266-5611/22/2/018 [DOI] [Google Scholar]
- 22.Hall T. J., et al. , “Phantom materials for elastography,” IEEE Trans. Ultrason. Ferroelectr. Freq. Control 44(6), 1355–1365 (1997). 10.1109/58.656639 [DOI] [Google Scholar]
- 23.Deffieux T., et al. , “The variance of quantitative estimates in shear wave imaging: theory and experiments,” IEEE Trans. Ultrason. Ferroelectr. Freq. Control 59(11), 2390–2410 (2012). 10.1109/TUFFC.2012.2472 [DOI] [PubMed] [Google Scholar]
- 24.Couade M., et al. , “Quantitative assessment of arterial wall biomechanical properties using shear wave imaging,” Ultrasound Med. Biol. 36(10), 1662–1676 (2010). 10.1016/j.ultrasmedbio.2010.07.004 [DOI] [PubMed] [Google Scholar]
- 25.Nguyen T.-M., et al. , “Assessment of viscous and elastic properties of sub-wavelength layered soft tissues using shear wave spectroscopy: theoretical framework and in vitro experimental validation,” IEEE Trans. Ultrason. Ferroelectr. Freq. Control 58(11), 2305–2315 (2011). 10.1109/TUFFC.2011.2088 [DOI] [PubMed] [Google Scholar]
- 26.Nenadic I. Z., et al. , “Phase velocities and attenuations of shear, Lamb, and Rayleigh waves in plate-like tissues submerged in a fluid (L),” J. Acoust. Soc. Am. 130(6), 3549–3552 (2011). 10.1121/1.3654029 [DOI] [PMC free article] [PubMed] [Google Scholar]
- 27.Song S., et al. , “Shear wave elastography using phase sensitive optical coherence tomography,” Proc. SPIE 8934, 89340U (2014). 10.1117/12.2040033 [DOI] [PMC free article] [PubMed] [Google Scholar]
- 28.Li J., et al. , “Dynamic optical coherence tomography measurements of elastic wave propagation in tissue-mimicking phantoms and mouse cornea in vivo,” J. Biomed. Opt. 18(12), 121503 (2013). 10.1117/1.JBO.18.12.121503 [DOI] [PMC free article] [PubMed] [Google Scholar]


