Abstract
Diffuse optical tomography (DOT) is a variant of functional near infrared spectroscopy and has the capability of mapping or reconstructing three dimensional (3D) hemodynamic changes due to brain activity. Common methods used in DOT image analysis to define brain activation have limitations because the selection of activation period is relatively subjective. General linear model (GLM)‐based analysis can overcome this limitation. In this study, we combine the atlas‐guided 3D DOT image reconstruction with GLM‐based analysis (i.e., voxel‐wise GLM analysis) to investigate the brain activity that is associated with risk decision‐making processes. Risk decision‐making is an important cognitive process and thus is an essential topic in the field of neuroscience. The Balloon Analog Risk Task (BART) is a valid experimental model and has been commonly used to assess human risk‐taking actions and tendencies while facing risks. We have used the BART paradigm with a blocked design to investigate brain activations in the prefrontal and frontal cortical areas during decision‐making from 37 human participants (22 males and 15 females). Voxel‐wise GLM analysis was performed after a human brain atlas template and a depth compensation algorithm were combined to form atlas‐guided DOT images. In this work, we wish to demonstrate the excellence of using voxel‐wise GLM analysis with DOT to image and study cognitive functions in response to risk decision‐making. Results have shown significant hemodynamic changes in the dorsal lateral prefrontal cortex (DLPFC) during the active‐choice mode and a different activation pattern between genders; these findings correlate well with published literature in functional magnetic resonance imaging (fMRI) and fNIRS studies. Hum Brain Mapp 35:4249–4266, 2014. © 2014 The Authors. Human Brain Mapping Published by Wiley Periodicals, Inc.
Keywords: fNIRS, atlas‐guided DOT, general linear model, risk decision‐making, balloon analog risk task
INTRODUCTION
Functional near‐infrared spectroscopy (fNIRS) is a non‐invasive imaging technique which measures the hemodynamic changes resulting from brain activity while the subject performs different mental tasks. Functional NIRS uses near‐infrared light at wavelengths between 650 and 900 nm to monitor local changes of blood supply due to cortical activation by measuring changes of light absorption. These absorption changes are mainly caused by concentration changes of oxygenated (HbO), and deoxygenated (HbR), and total (HbT) hemoglobin. Compared to functional magnetic resonance imaging (fMRI), which is a major brain imaging technique, fNIRS has better temporal resolution and is more cost‐effective, less sensitive to motion artifact, and most importantly, more portable for office‐based measurements. It has been shown that fNIRS has great potential to be used in neurological and psychiatric applications [Irani et al., 2007].
Based on image formation methodology, fNIRS provides two types of brain images: topographic and tomographic images. The former one uses pairs of sources and detectors to formulate spatially smoothed, two dimensional (2D) maps of hemodynamic changes by linearly interpolating the channel‐wise fNIRS data [Cui et al., 2011; Takeuchi et al., 2009]. The latter one, named diffuse optical tomography (DOT), also uses multiple source‐detector measurements to capture cortical activities during mental tasks [Boas et al., 2004; Koch et al., 2010; Tian et al., 2010, 2011; White and Culver, 2010b]. Compared to topographic images, DOT is rigorously reconstructed by solving inverse problems based on physical and mathematical models; reconstructed images consist of spatial distributions of hemodynamic changes in either 2D or three dimensional (3D) space. Regarding diverse optical image analysis methods, a classical way of defining brain activation induced by stimulation tasks in DOT [Cazzell et al., 2012; Tian et al., 2010, 2011] involves the following steps: (1) defining the maximum activation period in a time series of HbO (and HbR) readings from the fNIRS measurements; (2) reconstructing temporally averaged DOT images over the chosen activation period; (3) determining the region of brain activation by full width of half maximum (FWHM) in reconstructed images; and (4) comparing the HbO values within the defined activation region between the two states (i.e., “rest” versus “task”) with a paired t‐test to determine if the changes between the two states are statistically significant. However, this method used for DOT has a few limitations: (1) the maximum activation or post‐activation period has to be subjectively defined without much statistical or mathematical basis; (2) reconstructed DOT images are 2D without structural or anatomical information; (3) the sensitivity of fNIRS measurements for DOT exponentially attenuates with the increase of penetration depth, leading to a large depth localization error of brain activation [Habermehl et al., 2012] and preventing us from reconstructing accurate 3D DOT images.
To overcome the first limitation, many research groups [Cui et al., 2011; Leff et al., 2011; Plichta et al., 2007; Schecklmann et al., 2008; Schroeter et al., 2004; Tsujii and Watanabe, 2009; Ye et al., 2009] have followed an analysis method commonly used by fMRI researchers, namely, the general linear model (GLM)‐based analysis. It examines whether or not the experimental fNIRS data and a designed linear model are matched over the entire experimental time course. This approach rests on a physiology‐based principle or model that hemodynamic signals measured in response to brain stimulation result from a convoluted effect between the stimulation task and hemodynamic response function (HRF), where the latter functions are already given. Thus, there is no need to subjectively select the activation and/or post‐activation period to determine the activation regions in the brain. This is why GLM‐based analysis has been developed and popularly used for topographic image analysis [Cui et al., 2011; Tak et al., 2010, 2011; Ye et al., 2009]. To address the second limitation in DOT, several studies have reconstructed DOT images using MRI‐based 3D human head structure templates [Boas and Dale, 2005; Cooper et al., 2012; Custo et al., 2010; Zhan et al., 2012] to greatly improve 3D visualization and spatial localization/identification of activated cortical regions under respective stimulations [Eggebrecht et al., 2012; White and Culver, 2010a]. Regarding the third limitation, several DOT reconstruction algorithms including hard‐prior usage [Boas and Dale, 2005], spatial variant regularization (SVR) [Culver et al., 2003; Pogue et al., 1999], and depth‐compensation algorithm (DCA) [Niu et al., 2010a, b] have been developed to compensate or counter‐balance the sensitivity of DOT that exponentially attenuates with the increase of penetration depth to reduce the localization error of brain activation with respect to the depth. Although solutions to each of the given three limitations are explored in positive directions, respectively, little up‐to‐date publication has reported a convincing methodology to improve or minimize all of the limitations.
In this study, we planned to combine our recent development on DCA [Niu et al., 2010a, b] with brain template guided DOT so as to improve the accuracy in localizing the brain activation in 3D. We further combined 3D DOT with GLM‐based analysis (voxel‐wise GLM analysis) to form volumetric brain activation images under a specific risk decision‐making task, the Balloon Analog Risk Task (BART). BART was intentionally chosen as a demonstrative example in this study as it is a valid experimental protocol and has been commonly used in the field of neuroscience as a behavioral measure to assess human risk‐taking actions and tendencies while facing risks. Background development, administration, and psychometrics of BART were introduced and discussed in our previous study [Cazzell et al., 2012], without using any novel image process and analysis approaches developed in this study. The novelty of this article rests on the combination of three image processes, namely, (1) brain atlas‐guided DOT, (2) application of DCA to DOT image reconstruction, and (3) voxel‐wise GLM analysis. This combined approach enables us to optimally obtain reconstructed volumetric DOT images with much improved spatial resolutions and 3D visualization on a human brain template, which is particularly useful for studying cognitive responses to risk decision‐making. To our knowledge, this is the first report on brain atlas‐guided, GLM‐driven, volumetric DOT to image the human frontal cortex in response to cognition‐related stimulations.
MATERIALS AND METHODS
A flowchart shown in Figure 1 outlines major components used in data/image processes to achieve brain atlas‐guided, GLM‐driven, volumetric DOT images in response to the risk decision‐making task, BART. The overall development consisted of two major steps: The first one was to achieve reconstructed 3D DOT images from multi‐channel fNIRS measurements; the second one was to identify the activated frontal regions induced by BART by performing volumetric GLM analysis. Within Step one, a brain atlas was used to guide DOT image reconstruction, with two sub‐steps: (i) forward solving measurement sensitivity (as denoted by J matrix in Fig. 1) to absorption changes within the interrogated brain regions, and (ii) inverse reconstructing atlas‐guided, volumetric DOT images due to brain activation based on the fNIRS measurement data and depth‐compensated sensitivity matrix (as denoted by J# in Fig. 1). After obtaining a time‐series set of 3D DOT images, in step two, we performed GLM‐based analysis to determine the activated cortical regions directly associated with BART. Details on each step and sub‐step are described in the following subsections.
Figure 1.
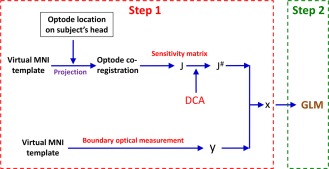
Overall data process flowchart to achieve atlas‐guided, GLM‐driven, volumetric DOT images. The overall process consisted of two steps: brain atlas‐guided 3D DOT reconstructions (Step 1) and voxel‐wise GLM analysis (Step 2), respectively. Notation of y represents the optical density changes in measurement space; x is the changes in absorption in voxel space; J is the Jacobian matrix derived from the head model; J # represents the DCA‐adjusted Jacobian matrix. [Color figure can be viewed in the online issue, which is available at http://wileyonlinelibrary.com.]
Participants and Measurement Protocol
A total of 40 healthy young adults (23 males and 17 females, age from 25 to 44 years old) were recruited by Department of Bioengineering and College of Nursing at the University of Texas at Arlington. The measurement protocol to study risk decision‐making was the Balloon Analog Risk Task (BART) paradigm. BART is a computerized measurement used to simulate actual risky behavior in real world situations [Lejuez et al., 2002]. BART paradigm was originally modified and used in an fMRI study [Rao et al., 2008] and then further modified using MATLAB®‐based graphical user interface (GUI) for our fNIRS study. Details regarding the fNIRS experimental setup and BART paradigm can be found in Cazzell et al. [2012] and are briefly introduced in this section.
BART paradigm consisted of two modes, namely, active mode and passive mode, respectively. In the active mode, participants could decide if he or she would like to keep playing the risk task while in the passive mode, participants were forced to observe the computer performing the balloon task. During the task, a simulated balloon was inflated at each iteration with an increased explosion probability, as reported in Table 1 of Rao et al. [2008]. Two visible outcomes, win and lose, were shown on the computer screen to each participant once an active or passive decision was made (Fig. 2a), resulting in different brain reactions and responses.
Table 1.
Optical properties of head tissues for modeling [Eggebrecht et al., 2012]
| Scalp | Skull | Gray matter | White matter | |||||
|---|---|---|---|---|---|---|---|---|
| 750 nm | 850 nm | 750 nm | 850 nm | 750 nm | 850 nm | 750 nm | 850 nm | |
| µ a (mm−1) | 0.017 | 0.019 | 0.012 | 0.014 | 0.018 | 0.019 | 0.017 | 0.021 |
| µ ′ s (mm−1) | 0.740 | 0.640 | 0.940 | 0.840 | 0.836 | 0.673 | 1.191 | 1.011 |
Figure 2.
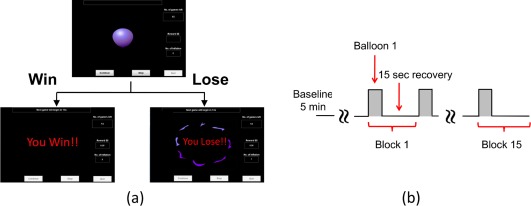
BART risk task paradigm and protocol for fNIRS. (a) Visualization of BART outcomes from active or passive decision‐making modes. When balloon inflations are stopped, money is collected, and participant sees “You Win!” When balloon explodes, money is lost, and participant sees “You Lose!!” (b) Diagram showing 15 task blocks. Each block includes a 5‐s activation period and 15‐s recovery time. [Color figure can be viewed in the online issue, which is available at http://wileyonlinelibrary.com.]
In the win case, “You Win!!” appeared on the computer monitor and the subjects collected the accrued money for that balloon, as seen in Figure 2a. In the lose case, “You Lose!!” appeared on the monitor and subjects lost any accrued money for that balloon. Each BART paradigm included 15 repeated balloon tasks (Fig. 2b), in either active or passive mode. Each subject was measured with the fNIRS brain imager in three consecutive temporal phases: (1) at the resting state for 5 min as baseline, (2) during ∼5‐s BART performance when decision was made by participant or computer, and (3) during 15‐s post‐stimulation recovery. The last two phases were grouped as one block and repeated 15 times (Fig. 2b). Before the fNIRS measurements, all participants provided written informed consent; this study was approved by the University of Texas at Arlington Institutional Review Board.
Data Acquisition and Data Pre‐processing
A commercially available, continuous wave (CW), DOT brain imager (HD‐DOT, Cephalogics®) was used with two emission wavelengths at 750 nm and 850 nm, respectively, for fNIRS data acquisition. An optode array consisted of 12 source fibers and 16 detector fibers that were placed on each subject's forehead (Fig. 3a), with a nearest source‐detector distance of 3.25 cm (Fig. 3b). The optode array covered each subject's frontal and prefrontal regions for both hemispheres. Only the first nearest source‐detector measurements (Fig. 3b) were used in tomographic image reconstruction process; a full tomographic dataset contained a total 36 source‐detector pairs/measurements. The multi‐channel DOT system operated with a frame rate of 10.8 Hz.
Figure 3.
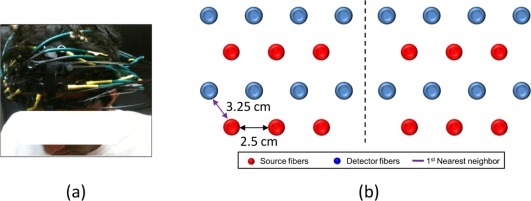
Experimental setup and schematic representation of optode array. (a) Photograph of optode placement on a subject's forehead. (b) Optode arrangement for fNIRS data acquisition. [Color figure can be viewed in the online issue, which is available at http://wileyonlinelibrary.com.]
The recorded fNIRS data were pre‐processed for each source‐detector measurement with a band‐pass filter at frequencies between 0.03 and 0.2 Hz to remove the physiological noise and low‐frequency instrument baseline drift. As previously described, each subject was asked to perform 15 repeated balloon tasks for each of the active and passive decision‐making modes. Filtered channel‐wise fNIRS data were averaged by 15 blocks to enhance the signal‐to‐noise ratio, and the averaged block time was approximately 20 s. Three participants (two males and one female) were excluded as outliers because of large motion artifacts or bad optode contact due to hair obstruction.
Atlas‐Guided DOT Image Reconstruction
Pre‐processed fNIRS data were then further processed with brain atlas‐guided tomographic image reconstruction to form volumetric images at different temporal points. The MRI‐based human brain atlas used in this study was the current standard Montreal Neurological Institution (MNI) template, known as International Consortium for Brain Mapping (ICBM) 152 MNI [Fonov et al., 2011]. ICBM152 MNI template was obtained by averaging the MRI scans of 152 normal subjects (Fig. 4a). Each MRI scan was normalized to MNI space using nine parameter affine transformations. ICBM152 MNI template is freely available at http://www.bic.mni.mcgill.ca/ServicesAtlases/ICBM152NLin2009. ICBM 2009c Nonlinear Asymmetric template was selected to generate the head model for this study. Files included T1‐weighted, T2‐weighted and proton density‐weighted images. The spatial resolution of the ICBM152 template was 1 mm × 1 mm × 1 mm as a voxel size with 229 × 193 × 193 voxels. ICBM152 template was then converted to an ANALYZED format using ITK‐SNAP [Yushkevich et al., 2006] which is also freely available (http://www.itksnap.org/pmwiki/pmwiki.php). Further image analysis was performed in MATLAB (The MathWorks, Natick, MA).
Figure 4.
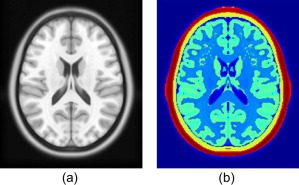
ICBM 152 T1 MR image and its segmentation. (a) Axial view of a T1‐weighted MR image averaged over 152 normal subjects; (b) segmented layers of the ICBM152 MNI template, corresponding to (a). The layers with red and yellow colors represent the scalp/muscle and skull, respectively. The layers with light green and blue color are gray and white matter, respectively. [Color figure can be viewed in the online issue, which is available at http://wileyonlinelibrary.com.]
Based on MR images, four regions of interest (ROIs), namely, scalp, skull, gray matter, and white matter, were identified and segmented in this study. A binary mask of the head was made and included in the ICBM template file so that the boundary of scalp could be extracted. Binary masks of skull, gray matter, and white matter were also generated after boundaries of scalp, skull, gray, and white matters were extracted from MR images, as shown in Figure 4b. After binary masks were obtained, the segmented 2D images were then stacked together to generate 3D volume models (see Fig. 5a–d). Three‐dimensional finite element model (FEM) meshes (see Fig. 5e–h) were then generated by a MATLAB‐based mesh generator, iso2mesh (http://iso2mesh.sourceforge.net/cgi-bin/index.cgi). This mesh model contained approximate 2 × 10⁵ nodes, which corresponded to approximately 106 linear tetrahedral elements. Each node was labeled by one of the four ROIs, and all the nodes were assigned with specific tissue optical properties, as listed in Table 1, which are found in published literature [Eggebrecht et al., 2012] for both wavelengths.
Figure 5.
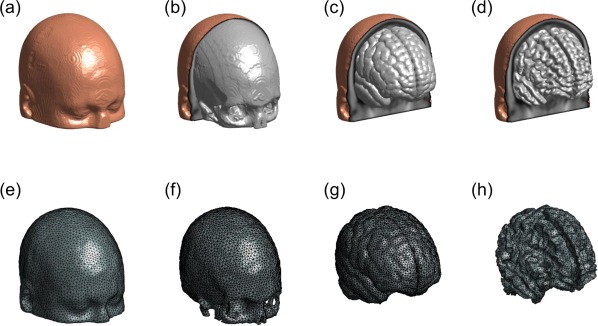
Three‐dimensional rendered views of different tissue types and FEM meshes. Three‐dimensional rendered volume of ICBM152 template for four tissue types: (a) scalp, (b) skull, (c) gray matter, and (d) white matter; (e) to (h) demonstrate the 3D FEM meshes of scalp, skull, gray matter, and white matter, respectively. [Color figure can be viewed in the online issue, which is available at http://wileyonlinelibrary.com.]
Optode Placement on Human Head Model
The projection of optode locations measured from a subject's head in real world (RW) coordinates to the human brain atlas template, an affine transformation, was used [Okamoto and Dan, 2005; Singh et al., 2005]. Briefly, optode positions on a subject's forehead were measured by a 3D Patriot™ digitizer (Polhemus, Colchester, VT). Moreover, we selected several anatomical landmarks based on the EEG international 10–20 system of electrodes placement as anchors for co‐registration. The landmarks were Nz (nasion), In (inion), AL (left ear), AR (right ear), and Cz (central position) and also measured on the subject's head by the 3D digitizer. The MNI coordinates of 10–20 scalp landmark positions on ICBM152 were obtained from Cutini et al. [2011]. Then the transformation matrix W was calculated. With the affine transformation matrix, the optode locations on the MNI head template were obtained by:
| (1) |
where represents the coordinates of fNIRS optodes in the RW space; represents the coordinates of fNIRS optodes in the MNI head template space; W is the transformation matrix. Coordinates of projected optodes in z axis were then further adjusted by projecting the transformed optode locations in MNI space along the averaged norm of patches from ICBM152 head model. The optodes projected onto the surface of the head model are depicted in Figure 6a and b. The region of interest (ROI) was determined as the volume covered by the optode array and up to 40 mm in depth to minimize the computational complexity, as shown in Figure 6c.
Figure 6.
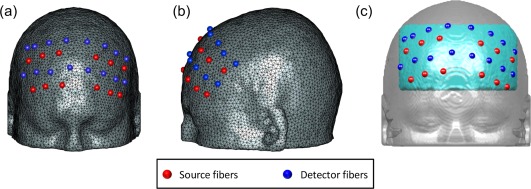
3D FEM meshes co‐registered with the fNIRS optodes and region of interest (ROI). Illustration of 3D FEM meshes co‐registered with the fNIRS optodes used in our BART study in (a) frontal and (b) dorsal views. (c) The region of interest (ROI) was defined by the volume enclosed in the light blue region. [Color figure can be viewed in the online issue, which is available at http://wileyonlinelibrary.com.]
Forward Light Modeling
Photon migration in the ICBM152 head model was performed using a FEM‐based MATLAB package, NIRFAST [Dehghani et al., 2008], to obtain the Jacobian matrix (also called the sensitivity matrix) . Matrix represents changes in measured signals induced by a small absorption perturbation within the brain volume interrogated by the optode pairs. The forward model for light propagation inside the human head uses Rytov approximation [Arridge, 1999] and is then written as:
| (2) |
where Δy represents a matrix of measured changes in optical density [i.e., OD = ] at all source‐detector pairs between the initial baseline (y 0) and transient reaction to the BART paradigm (y), that is, ; is the Jacobian matrix derived from the voxel‐wise ICBM152 head model; represents a matrix of changes in absorption at each node within the 3D atlas‐based coordinates system.
Volumetric Image Reconstruction with DCA
The process of image reconstruction is to recover temporal changes of absorption due to the brain response to the BART paradigm at each FEM node. With the DOT measurement from multiple source‐detector pairs, the inverse image reconstruction problem was solved using Moore–Penrose generalized approach [Arridge, 1999] with Tikhonov regularization:
| (3) |
where is the regularization factor and was chosen as 10−2 times the maximum of diagonal of the matrix and I is the identity matrix. The depth compensation algorithm (DCA) was used in this study to compensate for the fast decay of sensitivity with the increase of depth. The details on DCA can be found in Niu et al. [2010a, b] and is briefly described here. Key point of DCA is to compensate for the sensitivity decay by introducing a weighting matrix M, which can counter‐balance the sensitivity along the depth. Accordingly, the measurement sensitivity matrix J h within the ICBM152 head model can be decomposed into layer‐based sub‐matrices based on the distances from the scalp surface to each node below the scalp. Then, the matrix is formed as:
| (4) |
where is an adjustment power, and represents the maximum singular value for measurement sensitivity J h at the ith layer, where i = 1… L; L represents the layer number counted from superficial (the surface of scalp which was covered by the optode array) to deep layers. The adjustment power, γ, in Eq. (4) can control the compensating weight in ; is an empirical parameter with an optimal range of 1.2–1.6 that was demonstrated by Niu et al. [2010a, b]. Note that = 1.4 was used in this study. Accordingly, an adjusted sensitivity matrix is defined as to be used in the inverse calculation. After replacing by in Eq. (3), we expressed the image reconstruction equation after DCA was applied as follows:
| (5) |
Consequently, determination of absorption changes at two wavelengths led to reconstructed images of relative changes in HbO (ΔHbO), HbR (ΔHbR), and HbT (ΔHbT) concentrations, based on spectral decomposition of the extinction coefficients of HbO and HbR for both wavelengths [Boas and Dale, 2005].
General Linear Model
The general linear model (GLM) is a hypothesis‐driven model to define brain activation with rigorous statistical analysis, which was initially used in fMRI and then in fNIRS data analysis in recent years [Cui et al., 2011; Leff et al., 2011; Plichta et al., 2007; Schroeter et al., 2004; Tsujii and Watanabe, 2009; Ye et al., 2009]. The GLM‐based analysis examines whether or not the experimental data and a designed linear model are matched over the entire experimental time course. The basic principle of GLM is expressed as:
| (6) |
where Y is the data matrix containing the observed signals at various time points at single voxel; Xi is the ith designed or modeled hemodynamic response matrix (or the ith regressor) with components explaining the observed data/signal; i is the amplitude or parameter defining the contribution of Xi to the observed data; the subscript i denotes the number of regressors used in the model; ε is the error matrix containing the difference between the observed data Y and predicted data by the model of . In any fNIRS study, the observed data could be changes of hemodynamic parameters, including ΔHbO, ΔHbR, and ΔHbT. Only ΔHbO was used as the observed data for further data analysis in this study as the magnitudes of ΔHbR were much smaller than those of ΔHbO.
In general, design of regressors is based upon the experimental protocol, including the timing and duration of the stimulation given. In this study, the BART paradigm included a baseline, a ∼5‐s performance or stimulation period, followed by a 15‐s recovery period. During the BART performance in active mode, two kinds of stimulations occurred: the first was the stimulation due to deciding and performing balloon inflations (decision‐making/performance phase); the second was the stimulation due to reaction to “win” or “lose” outcome (reaction phase). To investigate the brain responses to these two different stimulations during BART, we selected a mixed block/event‐related design [Petersen and Dubis, 2012] to model the two stimulations associated with BART. The first regressor was created using a blocked design, having a boxcar of 5 s to cover the decision‐making/performance phase (regressor 1; blue dotted line in Fig. 7a). The second regressor was formulated with an event‐related design, with a short period of boxcar of 0.5 s to reflect the reaction phase (regressor 2; red dotted line in Fig. 7a) when subjects observed the win/lose outcomes. Both regressors were calculated by convolving the stimulation function and a given HRF [Rajapakse et al., 1998] to represent respective responses in the brain, as illustrated in Figure 7a.
Figure 7.
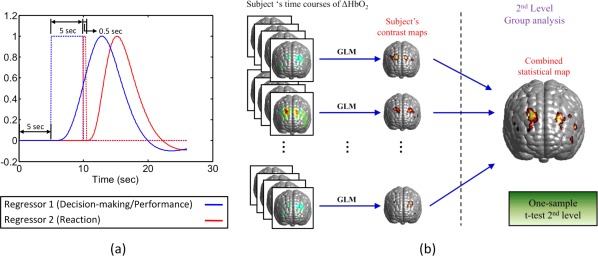
Schematic illustrations of an experimental design of BART and the random‐effect analysis. (a) A schematic of protocol and regressor design of BART. The time course contains a 5‐s baseline, a 5‐s BART performance, followed by a 15‐s recovery time. The boxcar marked with blue dotted line represents the blocked design of stimulation in response to the decision‐making/performance phase; the boxcar marked with red dotted line represents the event‐related stimulation associated with the reaction phase. Blue and red curves represent the respective brain responses which were convoluted between the BART stimulation and HRF. (b) A schematic diagram of two‐stage random‐effects analysis, presented in a similar way shown in [Huettel et al., 2009]. [Color figure can be viewed in the online issue, which is available at http://wileyonlinelibrary.com.]
After the regressors were constructed, the time course of ΔHbO at each voxel within the human head template, which was reconstructed using brain atlas‐guided DOT, was fitted by Eq. (6) using ordinary least squares (OLS) estimation [Monti, 2011]. The optimal parameters, βi's, were calculated as:
| (7) |
where i = 1, 2 were in response to the decision‐making/performance phase and to the reaction phase, respectively (see Fig. 7a; regressors 1 and 2). The t‐statistics were then calculated by:
| (8) |
where c represents the contrast vector (c = [1,0] for decision‐making/performance phase and c = [0,1] for reaction phase); the denominator in Eq. (8) represents the standard error of [Penny et al., 2003]. This process was performed voxel by voxel to identify the specific cortical regions which were activated by two separate stimulations (decision‐making/performance phase and reaction phase) due to BART. In general, an assumption within GLM is that any noise/error shown at one time point is not correlated with that at another time point. The degree of freedom to compute the statistical significance in the t‐test can be calculated by the number of observations minus the number of regressors if this assumption is met. However, this assumption does not hold for most cases in fMRI time‐series analysis [Friston et al., 1995; Worsley and Friston, 1995] as well as in our study. This can lead to biased t‐statistics and affect accuracy of the conclusions. To correct this issue, we have applied the autocorrelation calculation which was introduced by Worsley and Friston [1995]. The effective degree of freedom v to compute the P‐value in t‐distribution was calculated as:
| (9) |
where V is the autocorrelation matrix, and R represents the residual matrix and is expressed as:
| (10) |
Then, the t‐statistics were calculated by:
| (11) |
where is the variance of the estimated parameter for each voxel and was calculated by [Worsley and Friston, 1995]:
| (12) |
As this study involved multiple participants, inter‐subject variation would exist. Thus, we further performed the random‐effects analysis [Huettel et al., 2009; Penny et al., 2003]. In principle, random‐effects analysis contains two stages of analysis operations: single‐subject analysis and group‐level analysis, respectively, as demonstrated in Figure 7b. In this study, for the first‐level (i.e., single‐subject) analysis, we generated a contrast map of β‐values or/and t‐statistics on the voxel‐wise atlas template for each subject. For the second level (i.e., group‐level) analysis, the one‐sample, t‐test on β‐values was performed voxel by voxel within the reconstructed image volume over all the participants. The outcome of this group‐level random‐effects analysis gave rise to statistically meaningful brain activation maps for both phases in response to BART stimulation.
RESULTS
Spatial Distribution of Total Measurement Sensitivity
Figure 8 demonstrates the spatial distribution of total measurement sensitivity matrix with and without DCA compensation; each element of the total measurement sensitivity was calculated by:
| (13) |
where NM is the total number of measurements (or of source‐detector pairs), is the DCA‐compensated and uncompensated sensitivity at node n to the measurement m, and represents the DCA‐compensated and uncompensated sensitivity at node n to all the measurements. Figures depicted here were normalized and scaled between minimum (0) and maximum (1) sensitivity, and also smoothed by a Gaussian kernel over 3 × 3 pixels (1.5 mm × 1.5 mm per pixel) only for visualization. In actual data or image analysis, no space‐blurring procedure was used on either image reconstruction or brain activation statistics (t‐map). Figure 8a and b depicts the sagittal and axial views of the spatial distribution of total measurement sensitivity. The slices seen in the middle and right columns were cut along the locations shown on the left column of Figure 8a and b. These figures clearly show that without depth compensation, the regions with higher measurement sensitivity (i.e., larger than 50% of maximum measurement sensitivity) were mainly located near the skull and cerebrospinal fluid (CSF); the measurement sensitivity peak was close to the surface of the scalp.
Figure 8.
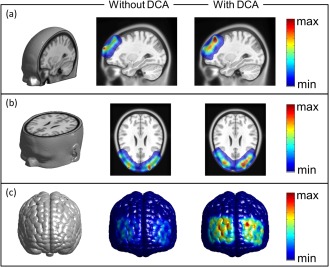
Spatial distribution of measurement sensitivity. Spatial distributions of compensated and un‐compensated sensitivities are shown in (a) sagittal view and (b) axial view, and also shown on (c) the anterior cortical surface. Notice that color scales shown in figures are normalized to the maximum value. [Color figure can be viewed in the online issue, which is available at http://wileyonlinelibrary.com.]
Conversely, with DCA applied, regions with higher measurement sensitivities have moved downward toward the cortical areas. Moreover, Figure 8c shows a much improved total measurement sensitivity distribution on the anterior cortical surface when DCA is applied, while much lower measurement sensitivities (less than 50% of maximum) are observed within the same cortical surface if no compensation is administered. These results clearly suggest that DCA could potentially benefit the recovery of brain activation on cortical regions with much better depth localization and spatial resolution. It is noteworthy that Figure 8 exhibits an asymmetric pattern of distribution of total measurement sensitivity. Although it was assumed that the optodes placed on the right and left side of each subject's head were symmetrical, Figure 8b and c clearly illustrates asymmetry of the optode distribution between the right and left hemispheres due to possible optode placement variations. Thus, it is not unusual to observe non‐uniform or/and non‐symmetric patterns of total measurement sensitivity distributions between two hemispheres.
Active Versus Passive Mode in BART Paradigm
Figure 9a and b shows the activation images generated at the group level when performing the active and passive BART modes. To compare the results with those reported in an fMRI study [Rao et al., 2008] and fNIRS study [Cazzell et al., 2012], subjects were not divided by genders; that is, a total of 37 subjects were grouped and only the outcomes from the two modes were considered as factors. Axial and coronal views of activation maps were sliced along the locations depicted on Figure 9c. Two cross‐sections were crossed near the dorsolateral prefrontal cortex (DLPFC) where the activations related to BART were mostly revealed, based on the observations by Cazzell et al. [2012].
Figure 9.
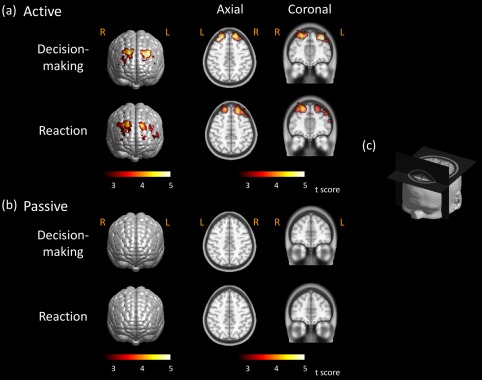
Brain activation images stimulated by active and passive BART. Brain activation maps from subjects performing BART (a) in active mode and (b) in passive mode. Threshold was set as P < 0.01 (FDR corrected). Axial and coronal views of brain activations were sliced along the locations shown in (c). Color scales in figure represent the t value. Notice that “R” represents the right and “L” represents the left side of the brain. [Color figure can be viewed in the online issue, which is available at http://wileyonlinelibrary.com.]
To obtain the brain activation images, changes of HbO concentrations in response to passive and active modes were reconstructed by brain atlas‐guided 3D DOT. Group‐level, brain activation images (i.e., t‐maps) were generated by random‐effects analysis; a threshold of false discovery rate (FDR) [Genovese et al., 2002] corrected P < 0.01 was used to identify brain activation areas associated with BART. No cluster size threshold was used in our study. For subjects who performed the active mode of BART paradigm in the decision‐making phase, both left and right hemispheres exhibited activations in DLPFC or Brodmann area (BA) 9 (see upper row of Fig. 9a). Bilateral brain activations were also revealed on BA 9 and 46 when subjects observed the win/lose outcomes in the reaction phase (see bottom row of Fig. 9a). The response intensities in the latter phase were a little weaker but more spread as compared to those in the former phase. In addition, the axial and coronal views exhibit that the activations occurred mostly within the cortical regions, exactly where the brain activation in response to BART should take place. Conversely, no brain activations were shown when subjects performed the passive mode of BART, in both decision‐making and reaction phase, as illustrated in Figure 9b. Specifically, no activations were present in either axial or coronal views.
Gender Difference in Active Mode
To further confirm our developed methodology, we also compared the differences of brain activation associated with BART between male and female participants in active mode. We targeted the comparisons only in active mode as no brain activation was observed in passive mode, as presented in Figure 9b. Voxel‐wise GLM was performed for each gender group (male: N = 21; female: N = 16) after time‐dependent volumetric ΔHbO images were reconstructed. Two regressors in GLM analysis were generated for decision‐making and reaction phases. Random‐effects analysis was then performed to identify brain activations for each gender at the group level; the activation threshold was set to be FDR corrected P < 0.01.
During the decision‐making/performance phase, we observed bilateral brain activations on DLPFC located on BAs 9 and 46 for both “win” and “lose” cases in female subjects (see Fig. 10a and b). Bilateral brain activations were also seen on DLPFC in male subjects for “win” and “lose” cases (see Fig. 10c and d). In “female win” and “male lose” cases, we also noticed similar brain activations in BA 10/46 on the left DLPFC, as shown in Figure 10a and d. These results implied that the brains behaved similarly for both genders when they dealt with the BART paradigm in the decision‐making/performance phase. This implication might be expected as the subjects did not know the outcomes yet during their performance of BART.
Figure 10.
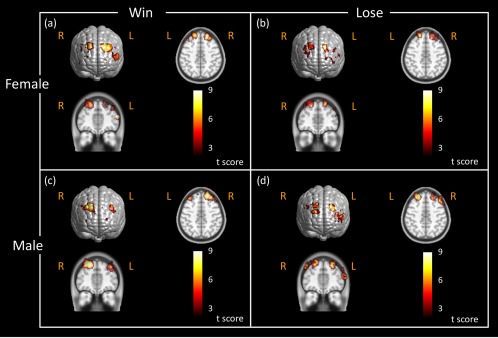
Brain activation images stimulated by active BART in different genders during performance phase. Brain activation maps were obtained in response to active BART mode when female subjects (N = 21) performed BART in (a) the “win” case, (b) in the “lose” case, and when male subjects (N = 16) performed BART in (c) the “win” case, and (d) in the “lose” case. These activation maps had the statistical threshold of FDR corrected P < 0.01. The axial and coronal views of brain activations were sliced along the location shown in Figure 9c. The color scales represent the t value. Notice that “R” represents right and “L” represents left side of the brain. [Color figure can be viewed in the online issue, which is available at http://wileyonlinelibrary.com.]
During the reaction phase, we observed strong bilateral cortical activations on or near DLPFC in both male and female subjects (Fig. 11a and c) in the “win” case. However, in the “lose” case, female participants exhibited clear, bilateral brain activations on DLPFC (Fig. 11b), while male subjects displayed strong, unilateral activation on the left DLPFC, with little activation on the right DLPFC (Fig. 11d).
Figure 11.
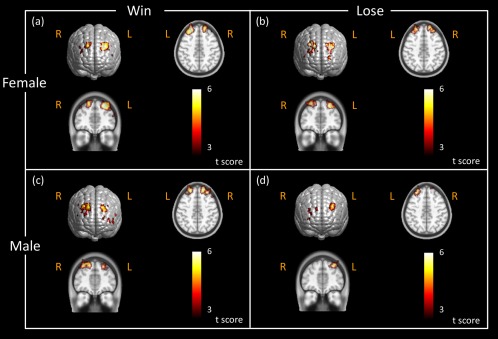
Brain activation images stimulated by active BART in different genders during reaction phase. Brain activation maps were obtained in response to active BART mode when female subjects (N = 21) saw the outcome (a) in the “win” case, (b) in the “lose” case, and when male subjects (N = 16) saw the outcome (c) in the “win” case, and (d) in the “lose” case. These activation maps had the statistical threshold of FDR corrected P < 0.01. The axial and coronal views of brain activations were sliced along the locations shown in Figure 9c. Color scales in the figure represent the t value. Notice that “R” represents right and “L” represents left side of the brain. [Color figure can be viewed in the online issue, which is available at http://wileyonlinelibrary.com.]
Improvement of Depth Sensitivity by DCA
Earlier in Results section (spatial distribution of total measurement sensitivity section), we presented the improvement of measurement sensitivity distribution for deeper tissue (see Fig. 8). Specifically, to demonstrate the improvement of depth localization when DCA was applied, we used a risk decision‐making paradigm (BART), as an example, and accordingly investigated the spatial distribution of activation voxels which were derived from voxel‐wise GLM analysis across all participants. We analyzed the brain responses to BART only in active mode as no brain activation was observed in passive mode, as previously reported in active versus passive mode in BART paradigm sub‐section (see Fig. 9). For each subject, the activated voxels induced by BART were identified and selected by GLM analysis, and then the corresponding atlas‐guided 3D DOT image was binarized in the following format:
| (14) |
where Vi represents the ith voxel after GLM analysis in the atlas‐guided, 3D image domain. In this way, we were able to generate a brain activation image in a binary form for each subject, followed by summation of such binary activation maps from all the participants. The outcome of this process resulted in a group‐summarized brain activation image by showing the overlapped activation voxels among all the participants, as illustrated in Figure 12. Note that the color scale in Figure 12 represents the number of overlapping times at each voxel from all the participants. Since the number of final participants was 37, the maximum overlapping number should be 37. Figure 12a and c clearly demonstrates that the brain activations in all subjects were mostly located in extracerebral regions (as seen from axial, sagittal and coronal views) when DCA was not used for 3D DOT reconstruction. No obvious activations within cerebral regions were observed for all participants. Conversely, Figure 12b and d clearly exhibits much improvement in depth localization, namely, most selected activations are presented within cortical regions for almost all participants when DCA is applied for 3D DOT reconstruction.
Figure 12.
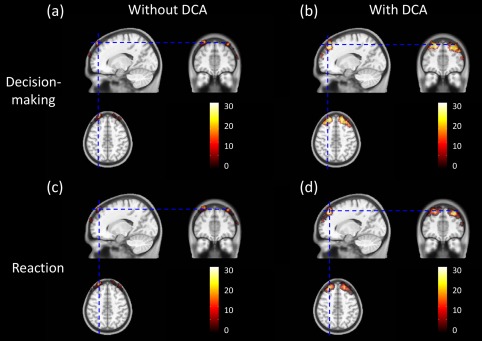
Group‐level Atlas‐guided images of overlapped activation voxels across all participants. Shown are a axial, coronal, and sagittal views of brain activations across all participants during decision‐making/performance phase (a) without DCA and (b) with DCA used. Axial, coronal, and sagittal views of brain activations across all participants during reaction phase (c) without DCA and (d) with DCA used. Color scales shown represent the number of overlapping times at each voxel from all the participants. [Color figure can be viewed in the online issue, which is available at http://wileyonlinelibrary.com.]
Quantitatively, we also performed the voxel‐wise comparisons between GLM‐derived activation images with and without DCA applied. The percentages of total voxels representing the brain activation volumes within the cortical/cerebral regions were calculated for both cases, as listed in Table 2. From the Table, we observed that approximately 3–4% of total activated voxels (4.2% in decision‐making/performance phase and 3.4% in reaction phase) were located within the cerebral region, while approximately 96% of total activated voxels (95.8% in decision‐making/performance phase and 96.6% in reaction phase) were located at the extra‐cerebral region when the conventional 3D DOT reconstruction (without DCA adoption) was performed. Dramatic improvement was found when reconstruction with DCA was used: 91–92% of total activated voxels resided within the cortical regions. It is noteworthy that approximate 8% (7.7% in decision‐making/performance phase and 8.8% in reaction phase) of activated voxels were still outside the brain region even when DCA was applied in 3D DOT reconstruction. One possible explanation could be related to the selection of adjusted power factor γ as it controls the compensation power and depth sensitivity. We expect the results to improve further if optimization of γ can be further developed. Another possible reason to have brain activation voxels extended beyond the cerebral regions is due to the diffuse nature of light in tissue. Light scattering in tissue consistently makes reconstructed DOT images with smooth or non‐sharp edges, extending the image boundaries beyond the true or actual edges of the objects or activated brain areas.
Table 2.
Total activation voxels and their partitions in cerebral and extra‐cerebral regions
| Total voxels | Voxels within cerebral region (ratio to the total voxels) | Voxels in extra‐cerebral region (ratio to the total voxels) | ||||
|---|---|---|---|---|---|---|
| Reg1 | Reg2 | Reg1 | Reg2 | Reg1 | Reg2 | |
| Without DCA | 16,043 | 14,668 | 673 (4.2%) | 495 (3.4%) | 15,370 (95.8%) | 14,173 (96.6%) |
| With DCA | 24,431 | 22,697 | 22,550 (92.3%) | 20,701 (91.2%) | 1,881 (7.7%) | 1,996 (8.8%) |
Reg1: Decision‐making/Performance; Reg2: Reaction.
DISCUSSION
In this article, we presented the ICBM152 template guided DOT combined with DCA to image hemodynamic changes induced by BART with improved 3D visualization and localization. Moreover, we combined human brain atlas‐guided 3D DOT with GLM analysis to generate volumetric brain activation images under BART paradigms. Compared to conventional FWHM‐based analysis in DOT, GLM‐based analysis allows for simultaneous modeling of the mixed stimulations so as to distinguish brain signals/activations in response to different tasks. Atlas‐guided 3D DOT techniques recently have been established by several research groups. For example, studies including computational simulations [Boas and Dale, 2005; Zhan et al., 2012] and in vivo human data [White and Culver, 2010a, b] have demonstrated great improvements in spatial resolution as well as in quantification. In addition, quantitative spatial comparisons between DOT and fMRI showed good correlation and match between the two imaging modalities [Eggebrecht et al., 2012], indicating great capability of 3D DOT to be used for studies on brain cortical activities.
The major drawback of 3D DOT is its poor depth localization due to the exponential attenuation of measurement sensitivity with increase of penetration depth. Although an increase in source‐detector separation has been reported to enhance depth sensitivity [Dehghani et al., 2009], mathematical models to increase the sensitivity for deep layer/tissue have also been proposed to benefit the image quality of DOT. Boas et al. [Boas and Dale, 2005] proposed the cortical (or brain) constraint method where DOT voxels located outside the brain/cortical regions were forced to have a sensitivity of zero. This method implied that changes in absorption occurred only within the brain/cortical regions. The spatially variant regularization (SVR) technique, which spatially regularized higher sensitivities near the superficial depth and provided more homogenous spatial and depth sensitivity, has been used for human [Dehghani et al., 2009; White and Culver, 2010a, b] and animal [Culver et al., 2003] DOT studies. Moreover, Zhan et al. [2012] recently demonstrated the improvement of DOT image quality based on computational simulations when a whole‐brain spatial constraint and SVR were used simultaneously. Our recently developed depth compensation algorithm (DCA) is another approach to improve the measurement sensitivity along the penetration depth by mathematically counter‐balancing the fast decay of sensitivity in deeper layers. Each method may have a different outcome and its own advantage; the comparison of different methods to improve the depth localization was not the scope of this study.
We acknowledge that the sensitivity of DOT measurements was mainly limited by the hardware itself and the nature of light attenuation within tissue. Because of severe loss of detected optical signals from deep tissue, the reconstructed brain activities were often projected toward the superficial layer. We mathematically applied DCA for the Jacobian matrix to counter‐balance the sensitivity in depth and also to suppress the hyper sensitivity near the surface. We have demonstrated that 3D DOT reconstruction with DCA did improve the depth localization based on computer simulations as well as the experimental data [Lin et al., 2014; Niu et al., 2010a, b], rather than constrain the reconstructed activities at a particular depth. Furthermore, a recent study has demonstrated how DCA alters sensitivity at different depths [Tian and Liu, 2014]. A similar figure is given in Supporting Information Figure S1, illustrating that higher sensitivities reside more toward extracerebral regions, that is, the skull and scalp, without DCA applied, while compensated sensitivities (with DCA) distribute more ideally for imaging the brain activations.
Comparison with Previous Studies
As we mentioned before, we have modified BART paradigm previously used in fMRI research by Rao et al. [2008]. Our BART protocol closely followed Rao et al.'s design although there were slight differences in passive mode. In Rao et al.'s design, participants merely pressed the button to keep inflating the balloon during the protocol while computer decided the end points and outcomes including win or lose. In our passive BART paradigm, participants only pressed the button once at the beginning of each block and then observed the computer performing BART. Each balloon was automatically inflated until the computer stopped the task in win case or balloon exploded in lose case. In terms of data analysis, we have used the atlas‐guided, GLM‐driven, 3D DOT in this study to determine brain activation regions, which is similar to Rao et al.'s study. However, Rao et al. used the BOLD signals as contrast while we targeted changes in hemoglobin concentrations, especially ΔHbO in this study. Moreover, due to the limited interrogation depth in fNIRS, our study focused on the hemodynamic changes only on BA 9, 10, and 46 while fMRI investigated the whole brain. Although difference exists between these two studies, our results here in this article show strong bilateral activations on DLPFC in active mode regardless of participants' gender while no activation was observed on DLPFC in passive mode. These results are highly consistent with those concluded in Rao et al.
Closer comparisons were made between this study and the one reported by Cazzell et al. [2012] in fNIRS research. Cazzell et al. have recently compared gender differences in brain activation maps and hemodynamic responses in HbO when subjects responded to BART. It is noteworthy that Cazzell et al. focused on the brain responses without separating the BART performance phase (balloon inflation) from the reaction phase (i.e., seeing either “you win” or “you lose”). The comparisons herein were made only for the overall stimuli. In Cazzell's study, although brain activation maps were determined by FWHM of HbO spatial patterns, the study concluded strong bilateral brain activations on DLPFC in active mode which was consistent with our results shown in Figure 9. In passive mode, we observed no activation on DLPFC in this study (see Fig. 9), whereas slight brain activations were exhibited on DLPFC in Cazzell et al. although they were relatively weaker compared to those in active mode. For the comparison of overlapped reactions to two outcomes between genders, the study reported by Cazzell et al. concluded strong bilateral brain activations on DLPFC in both “win” and “lose” cases for female subjects and in win “case” for male subjects. This conclusion is relatively consistent with our findings given here, as seen in Figure 11a to c. For male subjects, while the results by Cazzell et al. demonstrated strong bilateral changes on DLPFC in the “win” case, the changes exhibited a strong decease (or deactivation) in ΔHbO on the right DLPFC (see Fig. 8 in [Cazzell et al., 2012]). However, the brain activation/deactivation maps obtained in the “lose” case for male subjects in this study displayed somewhat different patterns or distributions: the FWHM‐derived results from Cazzell et al. revealed more diffuse deactivation patterns which were distributed closer to DLPFC (BA 46) bilaterally, while GLM‐derived results given in this study exhibited more unilateral activation on the left frontal region, located near both BA 9 and 46 (see Fig. 11d).
The agreement and disagreement between the brain activation maps derived by two types of data analysis methods need to be understood in order to select a more accurate approach for improved DOT‐based brain imaging. The disagreement could result from the following factors: (1) Image reconstruction process in this study was based on human brain atlas‐guided 3D DOT after depth‐compensation and voxel‐wise GLM analysis were performed, while the earlier study by Cazzell et al. used non‐atlas‐guided, 2D DOT with no depth compensation or statistical parametric analysis. In Cazzell et al.'s study, 2D‐DOT images were thresholded by FWHM of reconstructed HbO amplitudes and approximately projected onto the anatomical human brain template according to the approach given by Homan et al [Homan et al., 1987]. Distinct differences in distribution of brain activation patterns are highly likely to exist because of different reconstruction algorithms, co‐registration methods, and the anatomical brain template used between the two methodologies. (2) Because of the difference in image processing algorithms, the two methods rest on two hidden hypotheses: the current method given in this article uses the conventional GLM model commonly used in fMRI, assuming that voxel‐wise HbO signals can be modeled well by convolving the stimulation function with the HRF. Also, in this study, we used a mixed block/event‐related design [Petersen and Dubis, 2012] to model the two stimulation phases that were directly associated with BART. This mixed design in principle allowed us to separate the brain responses between the decision‐making/performance phase and the reaction phase. Conversely, the FWHM‐based image processing method by Cazzell et al. to determine the activation maps relied on the level of reconstructed maximum activation, so the activation patterns were more affected by the level of maximum activation. Furthermore, the 5‐s post‐stimulation window used for 2D reconstruction by Cazzell et al. indeed included the brain responses to the performance phase (see Fig. 7a) on top of the responses to the reaction phase. Thus, it is not surprising that the reconstructed brain activation maps derived by two data analysis methods are somewhat different. It is reasonable to state that the activation maps studied by Cazzell et al. reflected brain responses to convoluted stimulation tasks, while the activation maps shown in this article present brain responses to two separate or de‐convoluted stimulation tasks (i.e., performance phase and reaction phase).
To perform more comparative analysis, we re‐analyzed BART data using the same atlas‐guided 3D DOT reconstruction approach without GLM analysis, followed by FWHM‐based thresholding to define the brain/cortical activation regions. The reconstructed ΔHbO images were temporally averaged over a time period of 5 s post decision‐making phase, as Cazzell et al. did. Figure 13 shows the FWHM‐thresholded activation images for female and male participants in “win” and “lose” cases after averaging ΔHbO amplitudes across female and male participants. In female and male “win” cases, compared to GLM‐derived activation images (given in Fig. 11a and c), we observed similar bilateral activation patterns on DLPFC near both BAs 9 and 46 (see Fig. 13a and c). In female “lose” case, the FWHM‐derived method shows strong brain activations near BA 9 and 46 bilaterally, but with larger activation areas extended to BA 10 (see Fig. 13b), while results by GLM‐derived method revealed a more localized activation pattern, as shown in Figure 11b. Moreover, in male “lose” case, we observe noticeable activation on left DLPFC and deactivation on right DLPFC from FWHM‐derived activation images (see Fig. 13d), whereas GLM‐derived activation images showed strong activation on left DLPFC in both performance and reaction phases, particularly with a more localized activation area during the reaction phase. Based on the comparative study, we conclude that our newly developed, brain atlas‐guided, GLM‐based 3D DOT reconstruction algorithm should lead to more accurate brain activation maps with better spatial and depth resolution as well as with stronger statistical analysis reliability as compared to the FWHM‐derived method.
Figure 13.
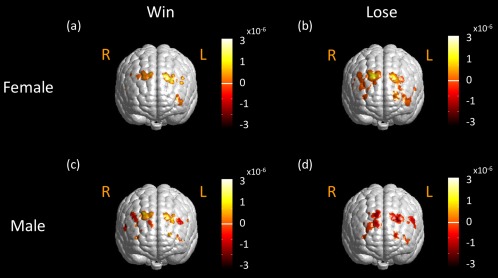
FWHM‐derived activation maps in active mode for different genders. FWHM‐derived brain activation maps in response to active BART mode from female group (N = 21) (a) in the “win” case, (b) in the “lose” case, from male group (N = 16) (c) in the “win” case, and (d) in the “lose” case. Color scales in figures represent ΔHbO in M. Notice that “R” represents right and “L” represents left side of the brain. [Color figure can be viewed in the online issue, which is available at http://wileyonlinelibrary.com.]
Atlas‐Guided DOT in Brain Research
In this study, we used a human head atlas to anatomically guide the 3D DOT reconstruction. Anatomically guided DOT reconstruction has been used in brain research within the fNIRS community to overcome the major drawback of DOT, namely, lack of structural information. Two major approaches, atlas anatomical‐guided [Custo et al., 2010] and subject‐specific anatomical‐guided 3D DOT [Cooper et al., 2012; Eggebrecht et al., 2012], have been intensely presented in the field recently. Although subject‐specific anatomical‐guided 3D DOT demonstrated accurate localization of brain activation compared with fMRI [Eggebrecht et al., 2012], the expected localization errors when using atlas‐guided DOT could result from: (1) differences between subject specific anatomy and atlas anatomy, and (2) registration errors between subject space and atlas space, including measurement variations of optode locations in subject space by a 3D digitizer. Studies on the comparisons between these two approaches have been presented by Custo et al. [2010] and Cooper et al. [2012]. Custo et al. compared the reconstruction results derived from the two approaches using three subjects. The spatial and numerical (i.e., overlapping between two reconstructions up to 93%; Dice's coefficient up to 0.86 [Custo et al., 2010]) results concluded that accurate cortical activation locations can be obtained by fNIRS and 3D DOT when using an atlas‐based head model to guide image reconstruction. Another supporting report by Copper et al. also concluded that atlas‐guided 3D DOT could provide reasonably accurate localization of brain activation based on their computational simulation results. Based on these conclusions and our study shown in this article, therefore, we highly recommend using considering atlas‐guided 3D DOT as a useful neuroimaging tool when investigating brain functions and stimulated activities in cortical regions.
Limitation of the Study and Future Work
Although we have demonstrated that atlas‐guided voxel‐wise GLM analysis allows us to simultaneously model the mixed task‐evoked brain activations with a better statistical power, this proposed methodology is still limited by: (1) the scattering nature of light in tissues, which results in reduction of spatial resolution and depth accuracy, and (2) mixed signals between the brain activations and artifacts from the superficial layers, that is, the scalp and skull. The latter aspects have been studied using superficial signal regression [Gregg et al., 2010] and adaptive filtering [Tian et al., 2011; Zhang et al., 2007] to isolate the brain signals; the GLM‐based analysis also has the capability to resolve this problem positively [Tian and Liu, 2014]. However, for all the methods mentioned above, it still remains difficult if the fluctuations of brain activations and superficial artifacts follow the same or similar temporal patterns/frequency. Therefore, a combination of GLM‐based analysis and adaptive filtering/linear regression with a high‐density optode array is possibly an optimal approach to improve depth and localization accuracies of DOT for functional brain imaging.
It is also well known that utilization of more source–detector (S–D) pairs in a high‐density optode array for 3D DOT reconstruction will benefit the quality of reconstructed images. In this study, we selected only the first‐nearest S–D pairs for image reconstruction because the noise levels from the second‐nearest S–D pairs (separated by 4.8 cm) were too high. For future studies, we will modify the current probe geometry and form a high‐density optode array so that the second and possibly third nearest S–D measurements can be performed for improved 3D DOT reconstruction.
The purpose of using a band pass filter from 0.03 to 0.2 Hz on raw data was to remove (1) high‐frequency physiological interference due to respiration (>0.2 Hz) and cardiac (>1 Hz) signals and (2) low‐frequency (<0.03 Hz) system drift. Utilization of a band‐pass filter has been a common image pre‐processing procedure for reconstructing DOT by numerous research groups [Boas et al., 2004; Eggebrecht et al., 2012; Fekete et al., 2013; Ferradal et al., 2014; Folley and Park, 2005; Gagnon et al., 2012; Tian et al., 2012; Zhang et al., 2011]. It might be true that when GLM is applied by deconvolving HbO (and HbR) signals with a given HRF, a band‐pass filter may not be necessary as the temporal HbO/HbR profiles are fitted in a least squares sense with the model. However, uses of a band‐pass filter will help reduce any possibly large noises, particularly for HbO or HbR signals at the individual subject level. To consider an optimal action, it may be beneficial to select a lower high‐pass cutoff frequency (such as 0.01 Hz) for future studies to avoid any possible distortion of time course induced by high‐pass filtering.
It is expected that a fixed HRF may not be applicable to all functional changes occurring in the brain. However, to use variable HRFs for different functional changes in different regions of the brain, further research is needed to define specific HRFs for respective tasks or functions. Finding activation‐dependent HRFs is beyond the scope of this study and is left for future studies.
CONCLUSION
The main focus of this study was to demonstrate the excellence of integrating three DOT data/image process techniques to better define and identify the brain activations for fNIRS‐based functional brain imaging. The three techniques were (1) atlas‐guided DOT, (2) depth compensated algorithm, and (3) voxel‐wise GLM analysis, which together allowed us to image hemodynamic changes induced by a specific risk decision‐taking task, BART, with improved 3D visualization and depth localization. The results shown in this study demonstrated that human brain atlas‐guided DOT provided better visualization and helped greatly to localize brain activation regions. Voxel‐wise GLM analysis was developed and used complementarily with 3D DOT for functional brain imaging, leading to good agreement with an fMRI study. Such integration of GLM analysis with volumetric DOT also provided excellent statistical analysis reliability and improved spatial localization, as well as allowed us to separate two convolved brain activities in response to performance and reaction stimulations in the BART paradigm. In addition, the current study offered convincing evidence that atlas‐guided volumetric DOT with voxel‐wise GLM analysis has strong potential for studies of cognition‐related brain activities. It is evident that reconstructed 3D DOT images seen on a brain atlas template can be easily compared and confirmed with published literatures in fMRI studies, if further validation is desired.
Supporting information
Fig. S1 Normalized depth‐dependent sensitivity for un‐compensated and compensated Jocabain matrix. It shows that higher sensitivities of reconstructed DOT reside more toward extra‐cerbral region, i.e., skull and scalp when DCA is not applied, while compensated sensitivities move deeper at 1.7 cm below the superficial surface when DCA is implemented.
ACKNOWLEDGMENTS
Authors would like to thank Dr. Haijing Niu from State Key Laboratory of Cognitive Neuroscience and Learning, Beijing Normal University, Beijing, China, for her help with implementation of DCA. Authors also acknowledge two MATLAB‐based software packages available on the website, which are FEM solver NIRFAST: http://www.dartmouth.edu/~nir/nirfast/ and mesh generator iso2mesh: http://iso2mesh.sourceforge.net/cgi-bin/index.cgi.
REFERENCES
- Arridge R (1999): Optical tomography in medical imaging. Inverse Probl 15:R41–R93. [Google Scholar]
- Boas DA, Dale AM, Franceschini MA (2004): Diffuse optical imaging of brain activation: Approaches to optimizing image sensitivity, resolution, and accuracy. Neuroimage 23 Suppl 1: S275–S288. [DOI] [PubMed] [Google Scholar]
- Boas DA, Dale AM (2005): Simulation study of magnetic resonance imaging‐guided cortically constrained diffuse optical tomography of human brain function. Appl Opt 44:1957–1968. [DOI] [PubMed] [Google Scholar]
- Cazzell M, Li L, Lin ZJ, Patel SJ, Liu H (2012): Comparison of neural correlates of risk decision making between genders: An exploratory fNIRS study of the Balloon Analogue Risk Task (BART). Neuroimage 62: 1896–1911. [DOI] [PubMed] [Google Scholar]
- Cooper RJ, Caffini M, Dubb J, Fang Q, Custo A, Tsuzuki D, Fischl B, Wells W, Dan I, Boas DA (2012): Validating atlas‐guided DOT: A comparison of diffuse optical tomography informed by atlas and subject‐specific anatomies. Neuroimage 62:1999–2006. [DOI] [PMC free article] [PubMed] [Google Scholar]
- Cui X, Bray S, Bryant DM, Glover GH, Reiss AL (2011): A quantitative comparison of NIRS and fMRI across multiple cognitive tasks. Neuroimage 54:2808–2821. [DOI] [PMC free article] [PubMed] [Google Scholar]
- Culver JP, Siegel AM, Stott JJ, Boas DA (2003): Volumetric diffuse optical tomography of brain activity. Opt Lett 28:2061–2063. [DOI] [PubMed] [Google Scholar]
- Custo A, Boas DA, Tsuzuki D, Dan I, Mesquita R, Fischl B, Grimson WE, Wells W (2010): Anatomical atlas‐guided diffuse optical tomography of brain activation. Neuroimage 49:561–567. [DOI] [PMC free article] [PubMed] [Google Scholar]
- Cutini S, Scatturin P, Zorzi M (2011): A new method based on ICBM152 head surface for probe placement in multichannel fNIRS. Neuroimage 54:919–927. [DOI] [PubMed] [Google Scholar]
- Dehghani H, Eames ME, Yalavarthy PK, Davis SC, Srinivasan S, Carpenter CM, Pogue BW, Paulsen KD (2008): Near infrared optical tomography using NIRFAST: Algorithm for numerical model and image reconstruction. Commun Numer Methods Eng 25:711–732. [DOI] [PMC free article] [PubMed] [Google Scholar]
- Dehghani H, White BR, Zeff BW, Tizzard A, Culver JP (2009): Depth sensitivity and image reconstruction analysis of dense imaging arrays for mapping brain function with diffuse optical tomography. Appl Opt 48:D137–D143. [DOI] [PMC free article] [PubMed] [Google Scholar]
- Eggebrecht AT, White BR, Ferradal SL, Chen C, Zhan Y, Snyder AZ, Dehghani H, Culver JP (2012): A quantitative spatial comparison of high‐density diffuse optical tomography and fMRI cortical mapping. Neuroimage 61:1120–1128. [DOI] [PMC free article] [PubMed] [Google Scholar]
- Fekete T, Wilf M, Rubin D, Edelman S, Malach R, Mujica‐Parodi LR (2013): Combining classification with fMRI‐derived complex network measures for potential neurodiagnostics. PLoS ONE 8:e62867. [DOI] [PMC free article] [PubMed] [Google Scholar]
- Ferradal SL, Eggebrecht AT, Hassanpour M, Snyder AZ, Culver JP (2014): Atlas‐based head modeling and spatial normalization for high‐density diffuse optical tomography: In vivo validation against fMRI. Neuroimage 85:117–126. [DOI] [PMC free article] [PubMed] [Google Scholar]
- Folley BS, Park S (2005): Verbal creativity and schizotypal personality in relation to prefrontal hemispheric laterality: A behavioral and near‐infrared optical imaging study. Schizophr Res 80:271–282. [DOI] [PMC free article] [PubMed] [Google Scholar]
- Fonov V, Evans AC, Botteron K, Almli CR, McKinstry RC, Collins DL, Brain Development Cooperative Group (2011): Unbiased average age‐appropriate atlases for pediatric studies. Neuroimage 54:313–327. [DOI] [PMC free article] [PubMed] [Google Scholar]
- Friston KJ, Holmes AP, Poline JB, Grasby PJ, Williams SC, Frackowiak RS, Turner R (1995): Analysis of fMRI time‐series revisited. Neuroimage 2:45–53. [DOI] [PubMed] [Google Scholar]
- Gagnon L, Yücel MA, Dehaes M, Cooper RJ, Perdue KL, Selb J, Huppert TJ, Hoge RD, Boas DA (2012): Quantification of the cortical contribution to the NIRS signal over the motor cortex using concurrent NIRS‐fMRI measurements. Neuroimage 59:3933–3940. [DOI] [PMC free article] [PubMed] [Google Scholar]
- Genovese CR, Lazar NA, Nichols T (2002): Thresholding of statistical maps in functional neuroimaging using the false discovery rate. Neuroimage 15:870–878. [DOI] [PubMed] [Google Scholar]
- Gregg NM, White BR, Zeff BW, Berger AJ, Culver JP (2010): Brain specificity of diffuse optical imaging: Improvements from superficial signal regression and tomography. Front Neuroenergetics 2. [DOI] [PMC free article] [PubMed] [Google Scholar]
- Habermehl C, Holtze S, Steinbrink J, Koch SP, Obrig H, Mehnert J, Schmitz CH (2012): Somatosensory activation of two fingers can be discriminated with ultrahigh‐density diffuse optical tomography. Neuroimage 59:3201–3211. [DOI] [PMC free article] [PubMed] [Google Scholar]
- Homan RW, Herman J, Purdy P (1987): Cerebral location of international 10–20 system electrode placement. Electroencephalogr Clin Neurophysiol 66:376–382. [DOI] [PubMed] [Google Scholar]
- Huettel S, Song A, McCarthy G (2009): Functional Magnetic Resonance Imaging, 2nd ed Sunderland, MA: Sinauer Associates, Incorporated. [Google Scholar]
- Irani F, Platek SM, Bunce S, Ruocco AC, Chute D (2007): Functional near infrared spectroscopy (fNIRS): An emerging neuroimaging technology with important applications for the study of brain disorders. Clin Neuropsychol 21:9–37. [DOI] [PubMed] [Google Scholar]
- Koch SP, Habermehl C, Mehnert J, Schmitz CH, Holtze S, Villringer A, Steinbrink J, Obrig H (2010): High‐resolution optical functional mapping of the human somatosensory cortex. Front Neuroenergetics 2:12. [DOI] [PMC free article] [PubMed] [Google Scholar]
- Leff DR, Orihuela‐Espina F, Elwell CE, Athanasiou T, Delpy DT, Darzi AW, Yang GZ (2011): Assessment of the cerebral cortex during motor task behaviours in adults: A systematic review of functional near infrared spectroscopy (fNIRS) studies. Neuroimage 54:2922–2936. [DOI] [PubMed] [Google Scholar]
- Lejuez CW, Read JP, Kahler CW, Richards JB, Ramsey SE, Stuart GL, Strong DR, Brown RA (2002): Evaluation of a behavioral measure of risk taking: The balloon analogue risk task (BART). J Exp Psychol Appl 8:75–84. [DOI] [PubMed] [Google Scholar]
- Lin ZJ, Ren M, Li L, Liu Y, Su J, Yang SH, Liu H (2014): Interleaved imaging of cerebral hemodynamics and blood flow index to monitor ischemic stroke and treatment in rat by volumetric diffuse optical tomography. Neuroimage 85:566–582. doi: 10.1016/j.neuroimage.2013.07.020. [DOI] [PMC free article] [PubMed] [Google Scholar]
- Monti MM (2011): Statistical analysis of fMRI time‐series: A critical review of the GLM approach. Front Hum Neurosci 5:28. [DOI] [PMC free article] [PubMed] [Google Scholar]
- Niu H, Lin ZJ, Tian F, Dhamne S, Liu H (2010a): Comprehensive investigation of three‐dimensional diffuse optical tomography with depth compensation algorithm. J Biomed Opt 15:046005. [DOI] [PMC free article] [PubMed] [Google Scholar]
- Niu H, Tian F, Lin ZJ, Liu H (2010b): Development of a compensation algorithm for accurate depth localization in diffuse optical tomography. Opt Lett 35:429–431. [DOI] [PubMed] [Google Scholar]
- Okamoto M, Dan I (2005): Automated cortical projection of head‐surface locations for transcranial functional brain mapping. Neuroimage 26:18–28. [DOI] [PubMed] [Google Scholar]
- Penny D, Holmes P, Friston J (2003): Random effects analysis In: Frackowiak S, Friston J, Frith C, Dolan R, Price J, Zeki S, Ashburner J, Penny D, editors. Human Brain Function. Academic Press, San Diego, CA USA; London, UK. [Google Scholar]
- Petersen SE, Dubis JW (2012): The mixed block/event‐related design. Neuroimage 62:1177–1184. [DOI] [PMC free article] [PubMed] [Google Scholar]
- Plichta MM, Herrmann MJ, Baehne CG, Ehlis AC, Richter MM, Pauli P, Fallgatter AJ (2007): Event‐related functional near‐infrared spectroscopy (fNIRS) based on craniocerebral correlations: Reproducibility of activation? Hum Brain Mapp 28:733–741. [DOI] [PMC free article] [PubMed] [Google Scholar]
- Pogue BW, McBride TO, Prewitt J, Osterberg UL, Paulsen KD (1999): Spatially variant regularization improves diffuse optical tomography. Appl Opt 38:2950–2961. [DOI] [PubMed] [Google Scholar]
- Rajapakse JC, Kruggel F, Maisog JM, von Cramon DY (1998): Modeling hemodynamic response for analysis of functional MRI time‐series. Hum Brain Mapp 6:283–300. [DOI] [PMC free article] [PubMed] [Google Scholar]
- Rao H, Korczykowski M, Pluta J, Hoang A, Detre JA (2008): Neural correlates of voluntary and involuntary risk taking in the human brain: An fMRI study of the balloon analog risk task (BART). Neuroimage 42:902–910. [DOI] [PMC free article] [PubMed] [Google Scholar]
- Schecklmann M, Ehlis AC, Plichta MM, and Fallgatter AJ (2008): Functional near‐infrared spectroscopy: A long‐term reliable tool for measuring brain activity during verbal fluency. Neuroimage 43:147–155. [DOI] [PubMed] [Google Scholar]
- Schroeter ML, Zysset S, Wahl M, von Cramon DY (2004): Prefrontal activation due to Stroop interference increases during development—An event‐related fNIRS study. Neuroimage 23:1317–1325. [DOI] [PubMed] [Google Scholar]
- Singh AK, Okamoto M, Dan H, Jurcak V, Dan I (2005): Spatial registration of multichannel multi‐subject fNIRS data to MNI space without MRI. Neuroimage 27:842–851. [DOI] [PubMed] [Google Scholar]
- Tak S, Jang J, Lee K, Ye JC (2010): Quantification of CMRO2 without hypercapnia using simultaneous near‐infrared spectroscopy and fMRI measurements. Phys Med Biol 55:3249–3269. [DOI] [PubMed] [Google Scholar]
- Tak S, Yoon SJ, Jang J, Yoo K, Jeong Y, Ye JC (2011): Quantitative analysis of hemodynamic and metabolic changes in subcortical vascular dementia using simultaneous near‐infrared spectroscopy and fMRI measurements. Neuroimage 55:176–184. [DOI] [PubMed] [Google Scholar]
- Takeuchi M, Hori E, Takamoto K, Tran AH, Satoru K, Ishikawa A, Ono T, Endo S, Nishijo H (2009): Brain cortical mapping by simultaneous recording of functional near infrared spectroscopy and electroencephalograms from the whole brain during right median nerve stimulation. Brain Topogr 22:197–214. [DOI] [PMC free article] [PubMed] [Google Scholar]
- Tian F, Delgado MR, Dhamne SC, Khan B, Alexandrakis G, Romero MI, Smith L, Reid D, Clegg NJ, Liu H (2010): Quantification of functional near infrared spectroscopy to assess cortical reorganization in children with cerebral palsy. Opt Express 18:25973–25986. [DOI] [PMC free article] [PubMed] [Google Scholar]
- Tian F, Kozel FA, Yennu A, Croarkin PE, McClintock SM, Mapes KS, Husain MM, Liu H (2012): Test‐retest assessment of cortical activation induced by repetitive transcranial magnetic stimulation with brain atlas‐guided optical topography. J Biomed Opt 17:116020. [DOI] [PubMed] [Google Scholar]
- Tian F, Niu H, Khan B, Alexandrakis G, Behbehani K, Liu H (2011): Enhanced functional brain imaging by using adaptive filtering and a depth compensation algorithm in diffuse optical tomography. IEEE Trans Med Imaging 30:1239–1251. [DOI] [PubMed] [Google Scholar]
- Tian F, Liu H (2014): Depth‐compensated diffuse optical tomography enhanced by general linear model analysis and an anatomical atlas of human head. Neuroimage 85:166–180. doi: 10.1016/j.neuroimage.2013.07.016. [DOI] [PMC free article] [PubMed] [Google Scholar]
- Tsujii T, Watanabe S (2009): Neural correlates of dual‐task effect on belief‐bias syllogistic reasoning: a near‐infrared spectroscopy study. Brain Res 1287:118–125. [DOI] [PubMed] [Google Scholar]
- White BR, Culver JP (2010a): Phase‐encoded retinotopy as an evaluation of diffuse optical neuroimaging. Neuroimage 49:568–577. [DOI] [PMC free article] [PubMed] [Google Scholar]
- White BR, Culver JP (2010b): Quantitative evaluation of high‐density diffuse optical tomography: In vivo resolution and mapping performance. J Biomed Opt 15:026006. [DOI] [PMC free article] [PubMed] [Google Scholar]
- Worsley KJ, Friston KJ (1995): Analysis of fMRI time‐series revisited—Again. Neuroimage 2:173–181. [DOI] [PubMed] [Google Scholar]
- Ye JC, Tak S, Jang KE, Jung J, Jang J (2009): NIRS‐SPM: Statistical parametric mapping for near‐infrared spectroscopy. Neuroimage 44:428–447. [DOI] [PubMed] [Google Scholar]
- Yushkevich PA, Piven J, Hazlett HC, Smith RG, Ho S, Gee JC, Gerig G (2006): User‐guided 3D active contour segmentation of anatomical structures: Significantly improved efficiency and reliability. Neuroimage 31:1116–1128. [DOI] [PubMed] [Google Scholar]
- Zhan Y, Eggebrecht AT, Culver JP, Dehghani H (2012): Image quality analysis of high‐density diffuse optical tomography incorporating a subject‐specific head model. Front Neuroenergetics 4:6. [DOI] [PMC free article] [PubMed] [Google Scholar]
- Zhang H, Duan L, Zhang YJ, Lu CM, Liu H, Zhu CZ (2011): Test‐retest assessment of independent component analysis‐derived resting‐state functional connectivity based on functional near‐infrared spectroscopy. Neuroimage 55:607–615. [DOI] [PubMed] [Google Scholar]
- Zhang Q, Brown EN, Strangman GE (2007): Adaptive filtering to reduce global interference in evoked brain activity detection: A human subject case study. J Biomed Opt 12:064009. [DOI] [PubMed] [Google Scholar]
Associated Data
This section collects any data citations, data availability statements, or supplementary materials included in this article.
Supplementary Materials
Fig. S1 Normalized depth‐dependent sensitivity for un‐compensated and compensated Jocabain matrix. It shows that higher sensitivities of reconstructed DOT reside more toward extra‐cerbral region, i.e., skull and scalp when DCA is not applied, while compensated sensitivities move deeper at 1.7 cm below the superficial surface when DCA is implemented.


