Abstract
Multiple myeloma (MM) is the second most common haematological malignancy and results in destructive bone lesions. The interaction between MM cells and the bone microenvironment plays an important role in the development of the tumour cells and MM-induced bone disease and forms a ‘vicious cycle’ of tumour development and bone destruction, intensified by suppression of osteoblast activity and promotion of osteoclast activity. In this paper, a mathematical model is proposed to simulate how the interaction between MM cells and the bone microenvironment facilitates the development of the tumour cells and the resultant bone destruction. It includes both the roles of inhibited osteoblast activity and stimulated osteoclast activity. The model is able to mimic the temporal variation of bone cell concentrations and resultant bone volume after the invasion and then removal of the tumour cells and explains why MM-induced bone lesions rarely heal even after the complete removal of MM cells. The behaviour of the model compares well with published experimental data. The model serves as a first step to understand the development of MM-induced bone disease and could be applied further to evaluate the current therapies against MM-induced bone disease and even suggests new potential therapeutic targets. © 2014 The Authors. International Journal for Numerical Methods in Biomedical Engineering published by John Wiley & Sons Ltd
Keywords: multiple myeloma, MM-induced bone disease, bone microenvironment, mathematical model, osteoblast and osteoclast activities
1 INTRODUCTION
Multiple myeloma (MM) is the second most frequent haematological malignancy, and MM-induced bone disease is a major cause of morbidity for MM patients 1. MM induces increased bone resorption and suppressed bone formation leading to a negative bone balance and osteolytic lesions that rarely heal 2,3. Histomorphometric studies reveal that the increased bone loss arises from enlarged bone resorption surfaces and deeper resorption depths at individual remodelling sites 4,5. In parallel, uncoupling between bone resorption and bone formation is also observed in MM patients 6.
The interaction between MM cells and the bone microenvironment (MM–bone interaction) plays an important role in the development of MM-induced bone disease. It promotes tumour growth and survival, as well as the consequent bone destruction 1. Recently, many biochemical factors have been implicated in the development of MM-induced bone disease, for example, cytokines with osteoclast activating function, such as the receptor activator of nuclear factor kappa-B ligand (RANKL), macrophage colony-stimulating factor, interleukin-6 (IL-6), IL-11 and IL-1β 7, which are produced or stimulated by MM–bone interaction and further stimulate osteoclast activation and proliferation, leading to increased bone resorption. In turn, growth factors released from bone resorption stimulate the growth of myeloma cells 5, including transforming growth factor-beta (TGF-β), bone morphogenetic proteins, heparin-binding fibroblast growth factors and insulin-like growth factor I 8,9. Such reciprocal interaction produces a vicious cycle between MM cells and the bone microenvironment, stimulating both tumour development and bone destruction 1,5.
Mathematical modelling has demonstrated great potential in aiding our understanding and analysis of complex biological systems, and several mathematical models of bone remodelling have been proposed in recent years to integrate our fragmented knowledge of the bone remodelling process 10–20. However, very few mathematical models have been constructed to simulate and investigate the development of MM-induced bone disease. As far as we are aware, currently, only two models have been developed to analyse the role of MM–bone interaction in the development of MM disease. Ayati et al. 21 proposed a model to simulate the dynamics of normal bone remodelling and MM disease. However, this model does not include the specific molecular mechanisms involved in the development of the MM-induced bone disease, and the model parameters lack corresponding biological meaning. Wang et al. 22 constructed another model to mimic MM–bone interaction and identify the signalling mechanisms that are believed to drive the progression of MM disease. This model includes IL-6 and signalling pathways involved in MM and bone marrow stromal cell (BMSC) adhesion. However, Wang et al. 22 do not consider the role of osteoblast inhibition and the antimyeloma effect of small leucine-rich proteoglycans (SLRPs, expressed by mature osteoblasts) in the development of the MM disease – but it is known that both are important in bone destruction and development of tumour cells in MM patients 2,7. Stimulation of osteoblast differentiation is thought to be able to reduce tumour burden and bone destruction in MM patients. Thus, drugs such as bortezomib, a boron-containing molecule with the potential to enhance osteoblast proliferation and bone formation in MM patients, have been proposed as a potential target for MM-induced bone disease 3,23. Similarly, interventions targeting SLRPs are also suggested as potential therapies for MM disease 2. Hence, inclusion of these mechanisms to allow the investigation of such potential management pathways is clearly essential and a key driver of the current work.
Osteoblast inhibition is caused primarily by the blockade of the differentiation of osteoblast precursors into mature osteoblasts, with secreted factors produced by MM cells and MM–bone interaction both resulting in the suppression of osteoblastic activity 3. The suppressed osteoblast activity not only increases the ratio of RANKL to osteoprotegerin (OPG), enhancing osteoclastogenesis and bone resorption, but also stimulates antiapoptotic factors and growth factors for MM cells, which form a positive feedback between osteoblast suppression and the growth of MM cells 1,3. Importantly, several potential therapies against MM disease target the disease's suppression of osteoblastic activity, such as bortezomib-related therapy 3 and inhibition of TGF-β 2. In this paper, a mathematical model of the interaction between the MM cells and the bone microenvironment is described. It was developed in parallel with the recently published model of Wang et al. 22, being similarly based on the earlier work of Pivonka et al. 14, but unlike the model of Wang et al. 22, it also includes the underlying mechanisms of osteoblast inhibition and its role in the development of MM-induced bone disease. The model can simulate the development of MM and the induced bone destruction and explains why MM-induced bone lesions rarely heal even after the complete removal of MM cells. It is based on our current knowledge of the pathogenesis of MM, which inevitably will increase, but the model can easily be refined and improved as more data become available.
2 MODEL DEVELOPMENT
2.1 Basic structure of the model
The bone microenvironment consists of many different components including multiple cell types and matrix proteins. The contribution of each component of the bone microenvironment to the progress and survival of tumour cells is still not completely understood 1,3. However, it is certain that the suppression of osteoblast activity and the enhancement of osteoclast activity are both key factors in the development of tumour cells and the bone destruction 2,7.
The basic structure of the model proposed here is shown in Figure1 and demonstrates the vicious cycle in MM disease, with the appearance of MM cells changing the bone microenvironment, resulting in osteolysis, which in turn promotes the proliferation of further MM cells 5. The model structure consists of two parts: part A (in black and connected in black hollow connecting lines) is associated with osteoclasts and the bone resorption aspects of the disease, whereas part B (in red and connected in red solid connecting lines) deals with osteoblasts and bone formation activities. (Note that, for simplicity, Figure1 does not include the direct interactions between osteoblastic and osteoclastic lineages. These mechanisms are well described in literature [e.g. 14], but for convenience, they are summarised in FigureA1 in Appendix A).
Figure 1.
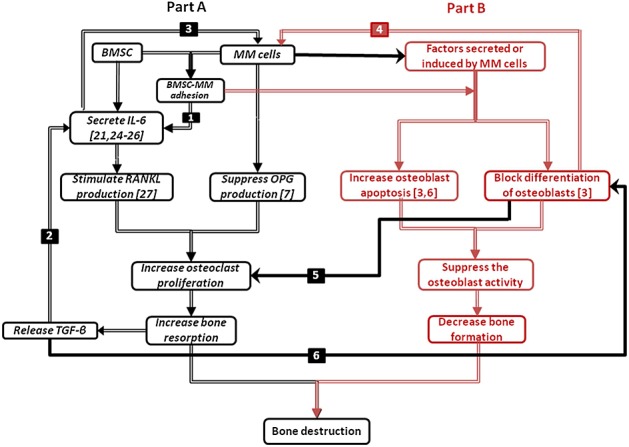
Proposed cellular interactions in multiple myeloma (MM) development. (1) Bone marrow stromal cell (BMSC)-MM cells adhesion enhances the production of interleukin-6 (IL-6) by BMSCs 24; (2) transforming growth factor-beta (TGF-β) stimulates the production of IL-6 25,26; (3) IL-6 stimulates the proliferation of MM cells 25–27; (4) immature osteoblasts support the growth and survival of MM cells, whereas mature osteoblasts enhance the apoptosis of MM cells; (5) the blockade of differentiation into mature osteoblasts contributes to the increase of the ratio of receptor activator of nuclear factor kappa-B ligand/osteoprotegerin (RANKL/OPG) and thus promotes osteoclasts proliferation; (6) and TGF-β potentially inhibits later phases of osteoblast differentiation and maturation. For further information on the significance of the different colours and solid/hollow connecting lines, see the main text.
Part A describes how MM cells increase bone resorption, which in turn stimulates the proliferation of MM cells. Here, two positive feedback cycles exist. Firstly, IL-6 secreted by BMSC stimulates the production of RANKL by osteoblast precursors 28, while MM cells suppress the production of OPG by mature osteoblasts 7. Consequently, the increased RANKL-OPG ratio promotes bone resorption 7. In turn, TGF-β released from bone matrix by the bone resorption stimulates the secretion of IL-6 by BMSC 25,26, where the IL-6 production can also be enhanced by BMSC-MM cell adhesion 20. Secondly, IL-6 and BMSC-MM cell adhesion promotes the proliferation of MM cells, which in turn further stimulates IL-6 production and BMSC-MM cell adhesion 24,25,27.
Part B describes the reciprocal relationship between the suppression of osteoblastic activity and the stimulation of MM cell production. Both BMSC-MM cell adhesion and secreted factors (produced or induced by MM cells) can block the differentiation of BMSCs into mature osteoblasts and at the same time stimulate osteoblast apoptosis, which inhibits osteoblast activity and resultant bone formation 3,6,29–31. On the other hand, the blockade of differentiation into mature osteoblasts can stimulate MM cell production, because immature osteoblasts support growth and survival of myeloma cells, whereas mature osteoblasts enhance apoptosis of myeloma cells 2. Thus, in the underlying mechanism, IL-6 secreted by immature osteoblasts (BMSCs) promotes MM cell growth and resistance to apoptosis 32, whereas matrix components such as SLRPs, including decorin, are expressed mature osteoblasts and have an antimyeloma effect 33.
Parts A and B also have direct connections with each other (the interaction between parts A and B are marked in solid black connecting lines in Figure1), that is, the blockade of differentiation into mature osteoblasts contributes to an increase in the RANKL/OPG ratio, because RANKL is produced primarily by immature osteoblasts, whereas OPG is produced primarily by mature osteoblasts (marked as black solid arrow no. 5 in Figure1) 14,34. In addition, TGF-β released by bone resorption inhibits osteoblast activity, because TGF-β potentially inhibits later phases of osteoblast differentiation and maturation (marked as black solid arrow no. 6 in Figure1) 2.
2.2 Model equations
The model equations are mathematical representations of the basic mechanisms and relationships shown in Figure1. Differentiation into active osteoclasts and osteoblasts from their progenitors involves several intermediate stages. For example, as many as seven stages have been identified for osteoblastic differentiation from BMSCs to osteocytes and bone lining cells 35, whereas the osteoclast lineage develops from haematopoietic precursor cells through monocyte differentiation and fusion to osteoclast formation 36,37. Here and following Pivonka et al. 14, four stages of osteoblastic differentiation (uncommitted progenitors (BMSCs); osteoblasts precursors; active osteoblasts; and osteocytes, bone lining cells or apoptotic osteoblasts) and three stages of osteoclastic differentiation (osteoclast precursors, active osteoclasts and apoptotic osteoclasts) are considered in our model, with three stages of MM cells (MM cell precursors, active MM cells and apoptotic MM cells).
Thus, overall, the proposed model contains four state variables: osteoblast precursors (OBp), active osteoblasts (OBa), active osteoclasts (OCa) and active MM cells (MM). ‘Hill functions’ are used to represent the cellular interaction via the single ligand to receptor binding and are denoted by π functions 14. Thus, Equations (m1) and (m2) denote the stimulating and inhibiting functions of the ligand-receptor binding respectively, where ‘L’ represents the concentration of the ligand, ‘β’ represents maximal expression level of the promoter, ‘n’ is the coefficient that regulates the steepness of the function ‘π’ and ‘k1’ and ‘k2’ represent dissociation constants. To ensure consistency with Pivonka et al. 14, both ‘β’ and ‘n’ are both assumed to equal 1.
| (1) |
 |
(2) |
Using the same nomenclature as Pivonka et al. 14 for convenience, the equations describing the dynamics of cell concentrations are then proposed as follows:
| (3) |
| (4) |
| (5) |
| (6) |
where OBp, OBa, OCa and MM represent concentrations of osteoblast precursors, active osteoblasts, active osteoclasts and active MM cells, respectively, and  is the variation of OBp with time, for example. Similarly, OBu and OCp are concentrations of uncommitted osteoblastic progenitors and osteoclastic precursors and are set as constants in the model, because their populations are relatively large.
  ,
,  ,
,  and DMM represent the differentiation rates of uncommitted osteoblast progenitors, osteoblast precursors, osteoclast precursors and MM cell precursors, respectively, and
  ,
,  and AMM are apoptosis rates of active osteoblasts, active osteoclasts and active MM cells, respectively. MMmax is the maximum concentration of MM cells. The production of MM cells is regulated by several secreted factors, such as IL-6, insulin-like growth factor 1, vascular endothelial growth factor and macrophage inflammatory protein-1 1,5,7,22. DMM represents the proliferation of MM cells regulated by IL-6 and BMSC-MM cell adhesion. Note that under normal/healthy conditions without MM cells, the terms
  and
and  still exist in Equations (m3) and (m4), because vascular cell adhesion molecule 1 (VCAM-1, expressed on BMSCs) is always present 7,25. Pivonka et al. 14 ignored the effect of VCAM-1 in their formulation, and hence, the behaviour of the two models differs under normal conditions.
The RANK-RANKL-OPG pathway plays an important role in the regulation of osteoclast activity, and RANKL can stimulate osteoclastogenesis by binding to RANK on the osteoclast progenitors, while RANKL-mediated osteoclastogenesis is inhibited by OPG, a soluble decoy receptor for RANKL 38. Growth factors, such as TGF-β, released during bone resorption can stimulate osteoblast recruitment and the migration and proliferation of osteoblast precursors 39–41, while inhibiting production of mature osteoblasts. As in the model of Pivonka et al. 14,  ,
,  ,
,  and
and  represent the effect of TGF-β and RANKL on osteoclastic and osteoblastic lineages. Thus,
  represents the stimulation of uncommitted osteoblastic progenitors into osteoblastic precursors,
  represents the inhibition of the differentiation of osteoblastic precursors into active osteoblasts,
  represents the promotion of the apoptosis of active osteoclasts by TGF-β and
  reflects the fact that RANKL produced by osteoblastic precursors stimulates the differentiation of osteoclastic precursors into active osteoclasts.
  also includes OPG secreted by active osteoblasts inhibiting the differentiation osteoclastic precursors, by binding to RANK expressed on osteoclastic precursors. According to the proposed forms of the Hill functions in Equations (m1) and (m2), the π functions involving TGF-β and RANKL are defined as follows:
| (7) |
| (8) |
| (9) |
| (10) |
where
TGF-β and RANKL represent the concentrations of TGF-β and RANKL, respectively, and their definitions are included in Tables1 and 2, and
the definitions and values of KD1,TGFβ, KD2,TGFβ, KD3,TGFβ and KD,RANKL are included in Table3.
Table I.
Definitions of the concentrations of RANKL, OPG, TGF-β, PTH, IL-6, SLRPs, VLA-4 and VCAM-1.
| RANKL |  |
| OPG |  |
| TGFβ |  |
| PTH |  |
| IL6 |  |
| SLRPs |  |
| VLA4 |  |
| VCAM1 |  |
These definitions are derived on the basis of similar principles to those described in Pivonka et al. 14.
RANKL, receptor activator of nuclear factor kappa-B ligand; OPG, osteoprotegerin; TGF-β, transforming growth factor-beta; PTH, parathyroid hormone; IL-6, interleukin-6; SLRP, small leucine-rich proteoglycan; VLA-4, very late antigen-4; VCAM-1, vascular cell adhesion molecule 1.
Table II.
Definitions of the π functions used in the concentration equations in Table1.
| PTH stimulates the production of RANKL |  |
| PTH inhibits the production of OPG |  |
| IL-6 stimulates the production of RANKL |  |
| VAL-4 stimulates the production of IL-6 |  |
| TGF − β stimulates the production of IL-6 |  |
| SLRPs produced by mature osteoblasts suppresses the proliferation of MM cells |  |
RANKL, receptor activator of nuclear factor kappa-B ligand; OPG, osteoprotegerin; TGF-β, transforming growth factor-beta; PTH, parathyroid hormone; IL-6, interleukin-6; SLRP, small leucine-rich proteoglycan; VLA-4, very late antigen-4; MM, multiple myeloma.
Table III.
Definitions and values of model parameters used in the model of multiple myeloma-induced bone disease.
| Parameters | Description | Value |
|---|---|---|
 |
Differentiation rate of osteoblast progenitors | 3.24e + 2/day (estimated) |
 |
Differentiation rate of osteoblast precursors | 3.67e-1/day (estimated) |
 |
Rate of elimination of active osteoblasts | 3.00e-1/day 14 |
 |
Differentiation rate of osteoclast precursors | 1.73e-1/day (estimated) |
 |
Rate of elimination of active osteoclasts | 1.20/day 14 |
| KD1,TGFβ | Activation coefficient related to growth factors binding on OBu | 4.28e-4 pM (calculation by GA) |
| KD2,TGFβ | Repression coefficient related to growth factors binding on OBp | 2.19e-4 pM (estimated) |
| KD3,TGFβ | Activation coefficient related to growth factors binding on OCa | 4.28e-4 pM 14 |
| KD1,PTH | Activation coefficient for RANKL production related to PTH binding | 2.09e + 1 pM (calculation by GA) |
| KD2,PTH | Repression coefficient for OPG production related to PTH binding | 2.21e-1 pM 14 |
| KD,TGFβ,IL6,act | Half-maximal concentration of TGF-β on promoting the production of IL-6 | 1.2e-4 pM (calculation by GA) |
| KD,IL6,RANKL,act | Half-maximal concentration of IL-6 on promoting the production of RANKL | 0.2 pM (calculation by GA) |
| KD,RANKL | Activation coefficient related to RANKL binding to RANK | 4.12e + 1 pM (estimated) |
| α | TGF-β content stored in bone matrix | 1.00 pM/% 14 |
 |
Rate of degradation of TGF - β | 2.00e + 2/day 42 |
| βPTH | Rate of synthesis of systemic PTH | 9.74e + 2 pM/day 43 |
 |
Rate of degradation of PTH | 3.84e + 2/day 43 |
| βIL6 | Rate of synthesis of IL - 6 per cell | 1.20e + 7/day27,44 |
| DIL6 | The degradation rate of IL-6 | 4.99e + 1/day 45 |
| IL6max | The maximum concentration of IL-6 | 8.04e-1 pM 46 |
| βOPG | Minimum rate of production of OPG per active osteoblast | 5.02e + 6/day (estimated) |
 |
Rate of degradation of OPG | 4.16/day 25 |
| OPGmax | Maximum possible OPG concentration | 7.98e + 2 pM 65 |
| βRANKL | Production rate of RANKL per cell | 8.25e + 5/day (estimated) |
 |
Rate of degradation of RANKL | 4.16/day 47 |
| RRANKL | Maximum number of RANKL on the surface of each osteoblastic precursor | 3.00e + 6 14 |
| RANK | Fixed concentration of RANK | 1.28e + 1 pM 14 |
| KA,OPG | Association rate constant for RANKL binding to OPG | 5.68e-2/pM 48 |
| KA,RANK | Association rate constant for RANKL binding to RANK | 7.19e-2/pM 48 |
| Kres | Relative rate of bone resorption (normalised with respect to normal bone resorption) | 2.00e + 2%/(pM day) 49 |
| Kform | Relative rate of bone formation (normalised with respect to normal bone resorption) | 3.32e + 1%/(pM day) (calculation by GA) |
| DMM | MM proliferation controlled by IL-6 and BMSC-MM adhesion | 5.50e-2/day (estimated) |
| AMM | Rate of elimination of active MM cells | 2.00e-3/day 50 |
| MMmax | Maximum possible MM concentration | 1.98 pM 51 |
| KD,VCAM1,MM,act | Half-maximal concentration of VLA - 4 on promoting the MM cells production | 1.5667e-4/pM (calculation by GA) |
| KD,VLA4,IL6,act | Half-maximal concentration of VLA - 4 on promoting the IL-6 production | 1.88e + 4/pM (calculation by GA) |
| KD,IL6,MM,act | Half-maximal concentration of IL - 6 on promoting the MM cells production | 1.2151e-5 pM (calculation by GA) |
| KD,SLRPs,MM,rep | Half-maximal concentration of SLRPs on promoting the MM cells production | 1.306e + 9 pM (calculation by GA) |
 |
Half-maximal concentration of VCAM - 1 on repressing the differentiation of OBp | 1.4e-1 pM (calculation by GA) |
 |
Half-maximal concentration of VCAM - 1 on promoting the apoptosis of OBa | 2.2e-1 pM (calculation by GA) |
| βVLA4 | Rate of synthesis of VLA - 4 per cell | 2.04e + 6/day (estimated) |
 |
Rate of degradation of VLA-4 | 1.5/day (estimated) |
| RVLA4 | Maximum number of VLA-4 expressed on the surface of MM cells | 5.6e + 4 52 |
| VCAM1tot | Total concentration of VCAM-1 | 1.92 pM 52 |
| KA,VCAM1 | The association rate for VLA-4 binding to VCAM-1 | 8.3e-2/pM 53 |
| DOPG,MM | The degradation rate of OPG by MM cells | 4.16/(pM day) (estimated) |
RANKL, receptor activator of nuclear factor kappa-B ligand; OPG, osteoprotegerin; TGF-β, transforming growth factor-beta; PTH, parathyroid hormone; IL-6, interleukin-6; SLRP, small leucine-rich proteoglycan; VLA-4, very late antigen-4; VCAM-1, vascular cell adhesion molecule 1; MM, multiple myeloma; GA, genetic algorithm.
In Equation (m6),  represents IL-6 regulation of the proliferation of MM cells. MM–bone interaction is carried out through the binding of CAMs, such as very late antigen-4 (α4β1 integrin present on the surface of MM cells) to VCAM-1, which is expressed on BMSC 7, and
  is used to represent the effect of MM-BMSC on the proliferation of MM cells. The underlying mechanism of MM-BMSC adhesion regulating the osteoblast lineage is complicated. It inhibits osteoblast activity by reducing the activity and expression of runt-related transcription factor 2, a critical transcription factor for osteoblast differentiation 3. For simplicity,
  represents BMSC-MM cell adhesion that blocks the differentiation of mature osteoblasts from their progenitors, whereas
  represents BMSC-MM cell adhesion stimulating the apoptosis of osteoblasts, and
  represents SLRPs produced by mature osteoblasts suppressing the proliferation of MM cells 3. The definitions of these π functions are as follows:
| (11) |
| (12) |
| (13) |
| (14) |
| (15) |
where IL6, VCAM1 and SLRPs represent the concentrations of IL6, VCAM1 and SLRPs, respectively, and their definitions are included in Tables1 and 2. The definitions and values of the other parameters in Equations (11)–(15) are included in Table3.
Note that in Equations (m3), (m4) and (m6), the osteoblast lineage and MM cells are regulated by two ligands simultaneously, which are incorporated here through the multiplication of their respective Hill functions. Other, for example, additive, approaches are equally possible, and the sensitivity of the results to these different formulations should ideally be compared in the future. It should also be noted that secreted factors produced by MM cells may also suppress osteoblast differentiation by inhibiting Wnt signalling 2,3 but are not currently considered in the model because the underlying mechanisms are not completely clear 54,55. Thus, here, we assume that the effects of these and other secreted factors are minor compared with that of BMSC-MM cell adhesion. This is a limitation of the model.
The model for the bone resorption and formation activities is proposed as follows:
| (16) |
where BV represents the normalised bone volume; Kres and Kform are the relative bone formation and resorption rates, respectively (their values are also included in Table3), and  represents the variation of bone volume with time.
3 SIMULATION RESULTS AND DISCUSSION
In the absence of MM cells, the model (defined by the aforementioned equations) is able to replicate the behaviour of ‘healthy’ bone in that osteoblast and osteoclast interactions are governed by the relationships shown in FigureA1 in Appendix A, and the simulation predicts the correct steady-state cell populations and bone volume. This is discussed and demonstrated in detail in 56; the same information is therefore not repeated here. The bone microenvironment is always found to remain in a dynamic steady state, as do other biological systems under physiological conditions without external stimuli, and is able to return to a steady state after perturbations are removed 13,53. The model is used here to simulate how cell concentrations fluctuate from the steady state because of the invasion of MM cells but then return to the steady state after their removal. The variation in bone volume with time is also calculated to demonstrate the MM-induced bone destruction, and then, the reason for the bone destruction is examined by considering the variation in the ratio of OBa to OCa. Also, a sensitivity study is reported to investigate how variations in the key model parameters ( ,
,  ,
,  ,
,  ,
,  , AMM, βOPG, βRANKL, βPTH, βIL-6 and
  ) affect MM concentration and bone volume. Such studies allow the contributions of the different factors to be investigated and in the future might consider combinations of parameters and thereby allow potential targets for new therapies to be identified. The initial values of cell concentrations used in the model are listed in Table4.
Table 4.
The initial values of cell concentrations in the model.
| Variables | Values | Unit |
|---|---|---|
| OBu | 3.27e-6 [57–58] | pM |
| OBp | 7.67e-4 [19] | pM |
| OBa | 6.39e-4 [59–60] | pM |
| OCp | 1.28e-3 [61] | pM |
| OCa | 1.07e-4 [59–60] | pM |
| MM | 3.26e-1 [51, 62] | pM |
MM cell concentration is at day 201; other cell concentrations are at day 1.
In the model, any unknown parameters (i.e. those parameters where experimental data are unavailable or those that have no direct biological meaning) may be calculated via a genetic algorithm (GA) as summarised in Table3. Thus, because a parameter may be directly or indirectly related with one or more of the initial values of cells concentrations listed in Table4 (e.g.  and
and  involve the experimental data of the initial concentration of OBp in Table4), these initial values are set as targets for the parameter fitting. The calculation of the model parameters is then achieved by trying different values in a domain and then picking those that provide the best fit with corresponding experimental data. On the basis of these values, the remaining unknown model parameters are then calculated according to relevant experimental data through GA. Thus, the GA approach effectively considers all possible combinations of the unknown parameters and predicts the optimal values, taking many hours on a powerful PC and potentially considering billions of combinations in its search for the optimum set. Although the accuracy of its predictions of the unknown parameters obviously cannot be checked, it does avoid the inevitable trial and error and/or guesswork involved in otherwise ‘estimating’ the values. The simulation was carried using the Matlab computational software package (v7.7.0, Mathworks, Natick, USA).
3.1 Simulation of multiple myeloma-induced bone disease
Figure2 confirms that the bone microenvironment remains in a steady state until the invasion of the MM cells, with cell concentrations constant at their initial values as given in Table4. The steady state is disturbed due to the appearance of MM cells after the 200th day, causing a fluctuation of cell concentrations, as illustrated in Figure2. Thus, OBp concentration is seen to increase nearly threefold due to the invasion of MM cells, which arises because the MM cells inhibit the differentiation of OBp into OBa 3,29–31. The increase in concentrations of OBa, OCa and MM cells after the introduction of MM cells agrees with the experimental observations of Alexandrakis et al. 63, Diamond et al. 64 and Terpos et al. 65. The MM cell concentration increases to 578% of its original value, which is similar to the 600% increase reported in the experimental work of Diamond et al. 64. Figure3 confirms that the invasion of MM cells leads to bone destruction, which also agrees with the observation of a decline in bone volume in MM patients by Diamond et al. 64 and can be explained by the variation in the ratio of OBa to OCa as shown in Figure4. In addition, after the invasion of MM cells, OPG concentration decreases to 75% of that in the healthy condition (Figure5), which again compares well with experimental data ranging from 59% to 82% 65–68. Similarly, the increase in the IL-6 concentration to 1077% (shown in Figure6) is consistent with the 979% increase reported by Alexandrakis et al. 46. Also, RANKL concentration increased to 924% (also shown in Figure6), which again is within the observed range of experimental data: 226% 69 to 1567% 70.
Figure 2.
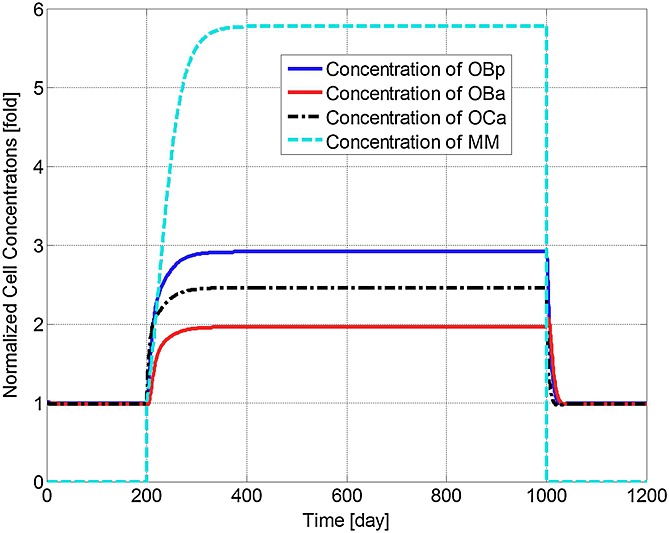
Model simulations of the normalised variation in the concentrations of osteoblast precursors, active osteoblasts, active osteoclasts and active tumour cells with respect to their respective initial values (multiple myeloma (MM) cells are injected at day 201 and removed at day 1001).
Figure 3.
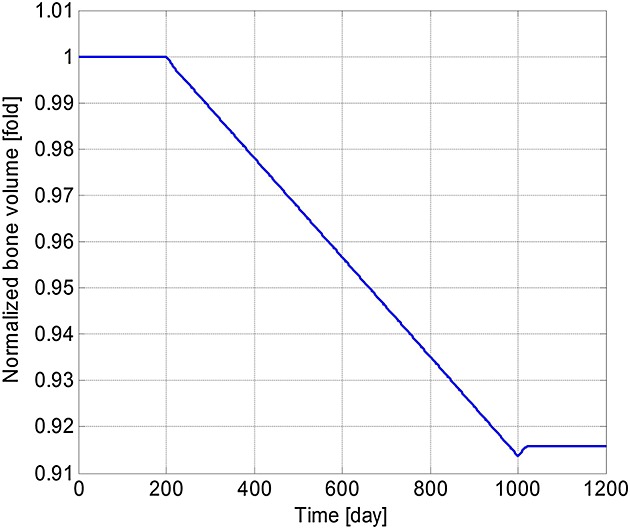
Model simulations of the variation in the normalised bone volume with respect to its initial value (multiple myeloma cells are injected at day 201 and removed at day 1001).
Figure 4.
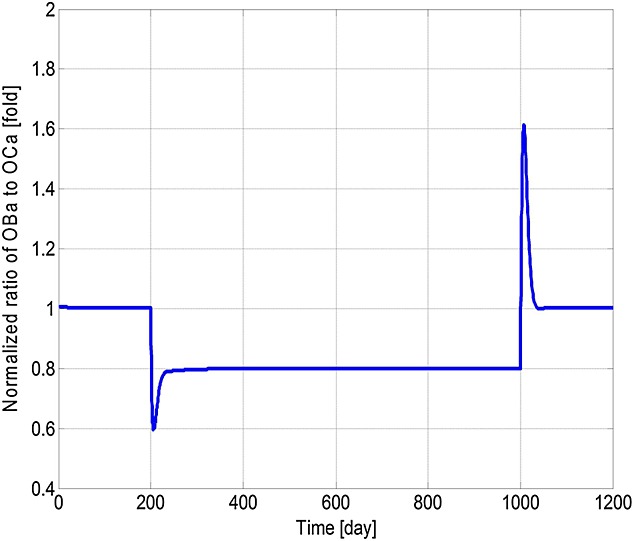
Model simulations of the variation in the normalised ratio of active osteoblasts to active osteoclasts with respect to the initial ratio (multiple myeloma cells are injected at day 201 and removed at day 1001).
Figure 5.
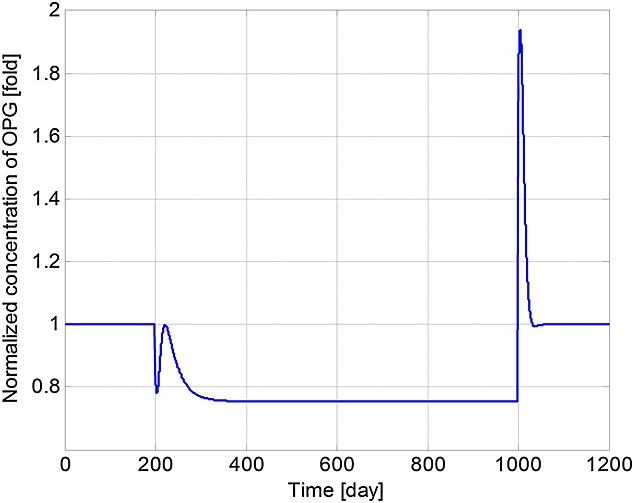
Model simulations of the variation in normalised osteoprotegerin (OPG) concentration with respect to its initial value (multiple myeloma cells are injected at day 201 and removed at day 1001).
Figure 6.
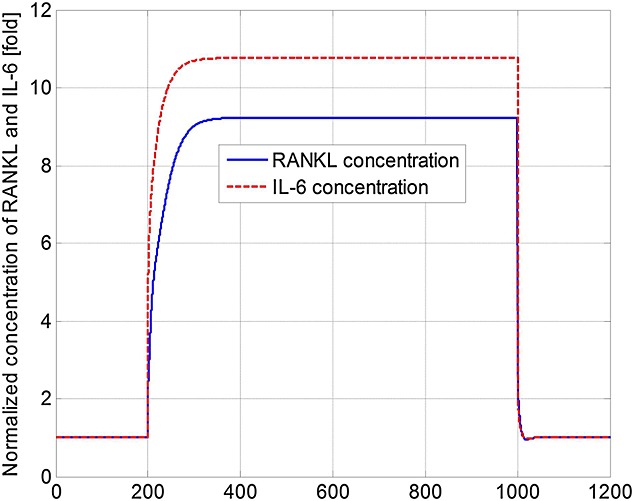
Model simulations of the variation in normalised receptor activator of nuclear factor kappa-B ligand (RANKL) and interleukin-6 (IL-6) concentrations with respect to their initial values (multiple myeloma cells are injected at day 201 and removed at day 1001).
It can be seen that some cell concentrations and the ratio of OBa to OCa undergo a short period of oscillation and then return to their initial steady-state values after the removal of tumour cells (Figures2, 4 and 5), which agrees with the observation that the steady state of biological systems is dynamic, and after the removal of external perturbations, they are capable of restoring themselves to the steady state again 13,71. The MM-induced bone destruction also stops after removal of the tumour cells; however, the bone volume remains at a lower level compared with its initial volume as shown in Figure3. This is because the ratio of OBa to OCa returns to its initial steady-state value after removal of the MM cells (Figure4), so that a near zero bone balance is achieved at the end of each subsequent remodelling cycle. This is consistent with the observation that MM-induced bone lesions rarely heal even after the removal of MM cells 3,7.
3.2 Sensitivity to the model parameters
Further information on the underlying biochemical mechanisms are elucidated by the sensitivity study of 11 of the key parameters of the model (namely,  ,
,  ,
,  ,
,  ,
,  , AMM, βOPG, βRANKL, βPTH, βIL-6 and
  ), thereby suggesting possible strategies for management of MM. The parameters are varied individually between 50% and 150% of their initial base values (as defined in Table3), and the effects on MM concentrations and bone volume are examined, normalised with respect to their (maximal) values at day 1000 (in Figures2 and 3). Thus, Figures7 and 8 demonstrate how the variation in each parameter influences the maximum MM concentration at day 1000, and Figures9 and 10 show how bone volume is affected.
Figure 7.
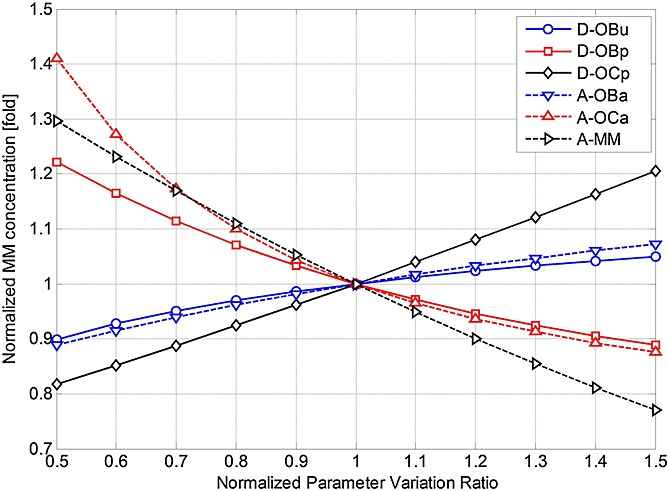
The effects of independently varying each model parameter ( ,
,  ,
,  ,
,  ,
,  and AMM) on multiple myeloma (MM) concentration at day 1000. Parameter variance and MM concentration are normalised to the values of the base case.
Figure 8.
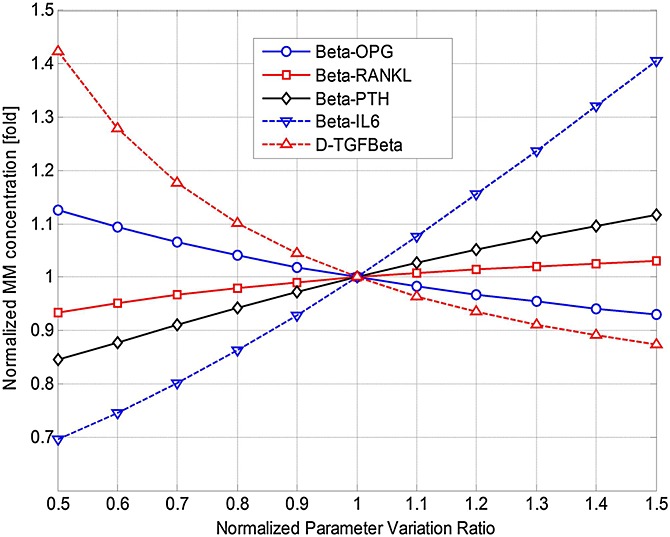
The effects of independently varying each model parameter (βOPG, βRANKL, βPTH, βIL-6 and  ) on multiple myeloma (MM) concentration at day 1000. Parameter variance and MM concentration are normalised to the values of the base case.
Figure 9.
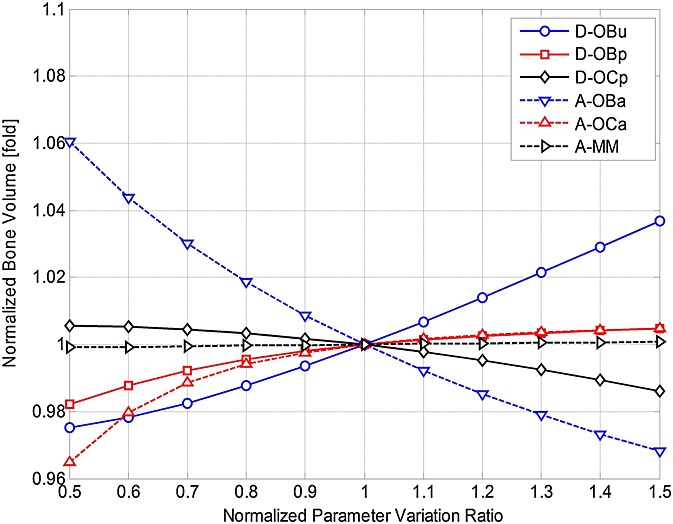
The effects of independently varying each model parameter ( ,
,  ,
,  ,
,  ,
,  and AMM) on bone volume at day 1000. Parameter variance and bone volume are normalised to the values of the base case.
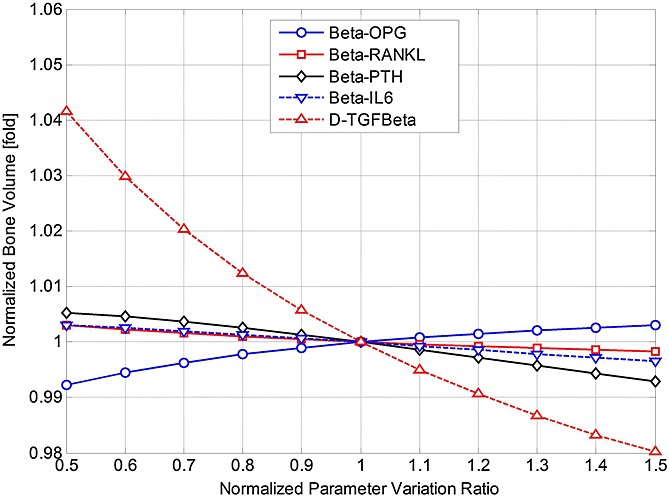
The effects of independently varying each model parameter (βOPG, βRANKL, βPTH, βIL-6 and  ) on bone volume at day 1000. Parameter variance and bone volume are normalised to the values of the base case.
Figures7 and 8 show that many of these 11 parameters have a significant influence on MM concentration. As some parameter values increase (between 50% and 150% of their base values), MM concentration increases, whereas the opposite effect is observed with the other parameters. For example, as DOCp increases from 50% to 150% of its base value, MM concentration varies by 81–121%. Conversely, for the same variation in AOCa, a significant decrease in MM concentration (from 141% to 87% of its base value) is observed. Figures9 and 10 show that this variation in parameter values affects bone volume. For example, a change in AOBa and  (from 50% to 150% of base value) produces a variation in bone volume (between 106% to 97% and 104% to 98%, respectively), whereas the same variation in AMM has a negligible effect. The variations in DOCp and AOCa (from 50% to 150% of its base value) cause a decrease (between 101% and 99%) and an increase (between 96.5% and 100.5%) in bone volume, respectively.
4 CONCLUSION
In this paper, a model is proposed that simulates the interaction between MM cells and the bone microenvironment, and the contribution of that interaction to the progression of the MM cells and the resultant bone destruction. The development of MM-induced bone disease involves many biochemical factors and mechanisms, and most papers published to date have only considered part of those biochemical factors and mechanisms. The model in this paper integrates these partial findings and tries to analyse the progression of MM-induced bone disease comprehensively. It goes further than the recently published model of Wang et al. 22 by considering the key role of osteoblast inhibition and the antimyeloma effect of SLRPs in the development of the MM disease. Osteoblasts play an essential role in the development of MM bone disease, because their inhibition not only enhances osteoclastogenesis and bone resorption but also stimulates antiapoptotic factors and growth factors for MM cells. Thus, our model provides a more complete picture on how the equilibrium of the bone microenvironment is disturbed by the invasion of MM cells and then restored after their removal.
It should be noted that the effects of soluble factors responsible for inhibiting osteoblast activity are not considered in the current model. The model also only describes the temporal characteristics of the bone microenvironment, with no reference to spatial variations; it is also a population-based model rather than patient specific. As our knowledge of the pathogenesis of MM increases and we gain a better understanding of the key model parameters, it should be possible to further refine the model and integrate new findings and possibly move towards a patient-specific analysis.
In the meantime, the model demonstrates how bone cell concentrations fluctuate after the invasion of MM cells and how these variations result in bone destruction. The simulation results agree with published experimental data and explain why the lesions resulting from MM-induced bone destruction rarely heal even after the disappearance of MM cells. A sensitivity study is conducted to show how the variations in model parameters influence MM concentration and bone volume and thereby suggests potential treatment options for MM-induced bone disease. For example, the sensitivity study indicates that DOCp and AOCa are tightly related to MM concentration and bone volume. Thus, an intervention targeting these two factors could be a potential treatment for reducing the tumour burden. Indeed, bisphosphonate treatment for management of MM-induced bone disease does just that, by inhibiting the differentiation of osteoclast precursors into mature osteoclasts and promoting osteoclast apoptosis 72,73.
It is hoped that this paper will serve a first step to a more detailed analysis and understanding of the development of MM-induced bone disease. In the future, the model will be used to test and evaluate the efficacy of current therapeutic interventions for MM-induced bone disease, such as bisphosphonate and bortezomib, and inhibition of TGF-β and even propose new, more effective therapies for MM-induced bone diseases.
APPENDIX
Figure A1.
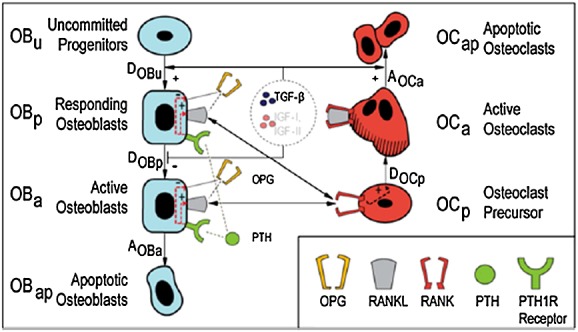
Schematic representation of the basic structure of interaction between osteoclastic and osteoblastic lineages. Reproduced from Pivonka et al. 14.
Acknowledgments
This work was partly supported by the UK Engineering and Physical Sciences Research Council through grant EP/E057365/1, National Natural Science Foundation of China through grant 81301294 and the Independent Innovation Foundation of SHANDONG University through grant 2013HW009.
REFERENCES
- Fowler JA, Edwards CM, Croucher PI. Tumor-host cell interactions in the bone disease of myeloma. Bone. 2011;48(1):121–128. doi: 10.1016/j.bone.2010.06.029. [DOI] [PMC free article] [PubMed] [Google Scholar]
- Matsumoto T, Abe M. TGF-beta-related mechanisms of bone destruction in multiple myeloma. Bone. 2011;48(1):129–134. doi: 10.1016/j.bone.2010.05.036. [DOI] [PubMed] [Google Scholar]
- Roodman GD. Osteoblast function in myeloma. Bone. 2011;48(1):135–140. doi: 10.1016/j.bone.2010.06.016. [DOI] [PubMed] [Google Scholar]
- Taube T, Beneton MN, McCloskey EV, Rogers S, Greaves M, Kanis JA. Abnormal bone remodelling in patients with myelomatosis and normal biochemical indices of bone resorption. Eur J Haematol. 1992;49(4):192–198. doi: 10.1111/j.1600-0609.1992.tb00046.x. [DOI] [PubMed] [Google Scholar]
- Wittrant Y, Theoleyre S, Chipoy C, Padrines M, Blanchard F, Heymann D, Redini F. RANKL/RANK/OPG: new therapeutic targets in bone tumours and associated osteolysis. Biochim Biophys Acta. 2004;1704(2):49–57. doi: 10.1016/j.bbcan.2004.05.002. [DOI] [PubMed] [Google Scholar]
- Calvani N, Silvestris F, Cafforio P, Dammacco F. Osteoclast-like cell formation by circulating myeloma B lymphocytes: role of RANK-L. Leukemia Lymphoma. 2004;45(2):377–380. doi: 10.1080/10428190310001595696. [DOI] [PubMed] [Google Scholar]
- Terpos E, Dimopoulos MA. Myeloma bone disease: pathophysiology and management. Ann Oncol. 2005;16(8):1223–1231. doi: 10.1093/annonc/mdi235. [DOI] [PubMed] [Google Scholar]
- Guise TA, Chirgwin JM. Transforming growth factor-beta in osteolytic breast cancer bone metastases. Clin Orthop Relat Res. 2003;(415 Suppl):S32–S38. doi: 10.1097/01.blo.0000093055.96273.69. [DOI] [PubMed] [Google Scholar]
- Blum B, Moseley J, Miller L, Richelsoph K, Haggard W. Measurement of bone morphogenetic proteins and other growth factors in demineralized bone matrix. Orthopedics. 2004;27(1 Suppl):s161–s165. doi: 10.3928/0147-7447-20040102-17. [DOI] [PubMed] [Google Scholar]
- Kroll MH. Parathyroid hormone temporal effects on bone formation and resorption. Bull Math Biol. 2000;62(1):163–188. doi: 10.1006/bulm.1999.0146. [DOI] [PubMed] [Google Scholar]
- Komarova SV, Smith RJ, Dixon SJ, Sims SM, Wahl LM. Mathematical model predicts a critical role for osteoclast autocrine regulation in the control of bone remodeling. Bone. 2003;33(2):206–215. doi: 10.1016/s8756-3282(03)00157-1. [DOI] [PubMed] [Google Scholar]
- Rattanakul C, Lenbury Y, Krishnamara N, Wollkind DJ. Modeling of bone formation and resorption mediated by parathyroid hormone: response to estrogen/PTH therapy. Biosystems. 2003;70(1):55–72. doi: 10.1016/s0303-2647(03)00040-6. [DOI] [PubMed] [Google Scholar]
- Lemaire V, Tobin FL, Greller LD, Cho CR, Suva LJ. Modeling the interactions between osteoblast and osteoclast activities in bone remodeling. J Theor Biol. 2004;229(3):293–309. doi: 10.1016/j.jtbi.2004.03.023. [DOI] [PubMed] [Google Scholar]
- Pivonka P, Zimak J, Smith DW, Gardiner BS, Dunstan CR, Sims NA, Martin TJ, Mundy GR. Model structure and control of bone remodeling: a theoretical study. Bone. 2008;43(2):249–263. doi: 10.1016/j.bone.2008.03.025. [DOI] [PubMed] [Google Scholar]
- Pivonka P, Zimak J, Smith DW, Gardiner BS, Dunstan CR, Sims NA, Martin TJ, Mundy GR. Theoretical investigation of the role of the RANK-RANKL-OPG system in bone remodeling. J Theor Biol. 2010;262(2):306–316. doi: 10.1016/j.jtbi.2009.09.021. [DOI] [PubMed] [Google Scholar]
- Ryser MD, Komarova SV, Nigam N. The cellular dynamics of bone remodeling: a mathematical model. SIAM J Appl Math. 2010;70(6):1899–1921. [Google Scholar]
- Ji B, Genever P, Patton R, Putra D, Fagan M. A novel mathematical model of bone remodelling cycles for trabecular bone at the cellular level. Biomech Model Mechanobiol. 2012;11:973–982. doi: 10.1007/s10237-011-0366-3. [DOI] [PubMed] [Google Scholar]
- Calmelet C, Prokop A, Mensah J, McCawley LJ, Crooke PS. Modeling the cancer stem cell hypothesis. Math Model Nat Phenom. 2010;5(3):40–62. [Google Scholar]
- Silva AS, Gatenby RA. A theoretical quantitative model for evolution of cancer chemotherapy resistance. Biol Direct. 2010;5:25. doi: 10.1186/1745-6150-5-25. [DOI] [PMC free article] [PubMed] [Google Scholar]
- Dingli D, Cascino MD, Josic K, Russell SJ, Bajzer Z. Mathematical modeling of cancer radiovirotherapy. Math Biosci. 2006;199:55–78. doi: 10.1016/j.mbs.2005.11.001. [DOI] [PubMed] [Google Scholar]
- Ayati BP, Edwards CM, Webb GF, Wikswo JP. A mathematical model of bone remodeling dynamics for normal bone cell populations and myeloma bone disease. Biol Direct. 2010;5(1):28–45. doi: 10.1186/1745-6150-5-28. [DOI] [PMC free article] [PubMed] [Google Scholar]
- Wang Y, Pivonka P, Buenzli PR, Smith DW, Dunstan CR. Computational modeling of interactions between multiple myeloma and the bone microenvironment. PLoS One. 2011;6(11):e27494. doi: 10.1371/journal.pone.0027494. [DOI] [PMC free article] [PubMed] [Google Scholar]
- Yaccoby S. Osteoblastogenesis and tumor growth in myeloma. Leuk Lymphoma. 2010;51(2):213–220. doi: 10.3109/10428190903503438. [DOI] [PMC free article] [PubMed] [Google Scholar]
- Urashima M, Ogata A, Chauhan D, Hatziyanni M, Vidriales MB, Dedera DA, Schlossman RL, Anderson KC. Transforming growth factor-beta1: differential effects on multiple myeloma versus normal B cells. Blood. 1996;87(5):1928–1938. [PubMed] [Google Scholar]
- Hideshima T, Mitsiades C, Tonon G, Richardson PG, Anderson KC. Understanding multiple myeloma pathogenesis in the bone marrow to identify new therapeutic targets. Nat Rev Cancer. 2007;7(8):585–598. doi: 10.1038/nrc2189. [DOI] [PubMed] [Google Scholar]
- Teoh G, Anderson KC. Interaction of tumor and host cells with adhesion and extracellular matrix molecules in the development of multiple myeloma. Hematol Oncol Clin North Am. 1997;11(1):27–42. doi: 10.1016/s0889-8588(05)70413-5. [DOI] [PubMed] [Google Scholar]
- Klein B, Zhang XG, Lu ZY, Bataille R. Interleukin-6 in human multiple myeloma. Blood. 1995;85(4):863–872. [PubMed] [Google Scholar]
- Kwan Tat S, Padrines M, Theoleyre S, Heymann D, Fortun Y. IL-6, RANKL, TNF-alpha/IL-1: interrelations in bone resorption pathophysiology. Cytokine Growth Factor Rev. 2004;15(1):49–60. doi: 10.1016/j.cytogfr.2003.10.005. [DOI] [PubMed] [Google Scholar]
- Bataille R, Chappard D, Alexandre C, Dessauw P, Sany J. Importance of quantitative histology of bone changes in monoclonal gammopathy. Br J Cancer. 1986;53(6):805–810. doi: 10.1038/bjc.1986.136. [DOI] [PMC free article] [PubMed] [Google Scholar]
- Bataille R, Chappard D, Marcelli C, Rossi JF, Dessauw P, Baldet P, Sany J, Alexandre C. Osteoblast stimulation in multiple-myeloma lacking lytic bone-lesions. Br J Haematol. 1990;76(4):484–487. doi: 10.1111/j.1365-2141.1990.tb07904.x. [DOI] [PubMed] [Google Scholar]
- Bataille R, Chappard D, Marcelli C, Dessauw P, Baldet P, Sany J, Alexandre C. Recruitment of new osteoblasts and osteoclasts is the earliest critical event in the pathogenesis of human multiple-myeloma. J Clin Invest. 1991;88(1):62–66. doi: 10.1172/JCI115305. [DOI] [PMC free article] [PubMed] [Google Scholar]
- Stewart JP, Shaughnessy JD. Role of osteoblast suppression in multiple myeloma. J Cell Biochem. 2006;98(1):1–13. doi: 10.1002/jcb.20774. [DOI] [PubMed] [Google Scholar]
- Li X, Pennisi A, Yaccoby S. Role of decorin in the antimyeloma effects of osteoblasts. Blood. 2008;112(1):159–168. doi: 10.1182/blood-2007-11-124164. [DOI] [PMC free article] [PubMed] [Google Scholar]
- Atkins GJ, Kostakis P, Pan BQ, Farrugia A, Gronthos S, Evdokiou A, Harrison K, Findlay DM, Zannettino ACW. RANKL expression is related to the differentiation state of human osteoblasts. J Bone Miner Res. 2003;18(6):1088–1098. doi: 10.1359/jbmr.2003.18.6.1088. [DOI] [PubMed] [Google Scholar]
- Aubin JE. Advances in the osteoblast lineage. Biochem Cell Biol. 1998;76(6):899–910. [PubMed] [Google Scholar]
- Roodman GD. Cell biology of the osteoclast. Exp Hematol. 1999;27(8):1229–1241. doi: 10.1016/s0301-472x(99)00061-2. [DOI] [PubMed] [Google Scholar]
- Teitelbaum SL. Bone resorption by osteoclasts. Science. 2000;289(5484):1504–1508. doi: 10.1126/science.289.5484.1504. [DOI] [PubMed] [Google Scholar]
- Boyce BF, Xing LP. Functions of RANKL/RANK/OPG in bone modeling and remodeling. Arch Biochem Biophys. 2008;473(2):139–146. doi: 10.1016/j.abb.2008.03.018. [DOI] [PMC free article] [PubMed] [Google Scholar]
- Eriksen EF, Kassem M. The cellular basis of bone remodelling. Triangle. 1992;31(2):45–57. [Google Scholar]
- Bonewald LF, Dallas SL. Role of active and latent transforming growth-factor-beta in bone-formation. J Cell Biochem. 1994;55(3):350–357. doi: 10.1002/jcb.240550312. [DOI] [PubMed] [Google Scholar]
- Mundy GR, Boyce BF, Yoneda T, Bonewald LF, Roodman GD. Cytokines and bone remodelling. In: Marcus R, Feldman D, Kelsey J, editors. Osteoporosis. Academic Press: New York; 1996. pp. 301–313. [Google Scholar]
- Wakefield LM, Winokur TS, Hollands RS, Christopherson K, Levinson AD, Sporn MB. Recombinant latent transforming growth factor beta 1 has a longer plasma half-life in rats than active transforming growth factor beta 1, and a different tissue distribution. J Clin Invest. 1990;86(6):1976–1984. doi: 10.1172/JCI114932. [DOI] [PMC free article] [PubMed] [Google Scholar]
- Schmitt CP, Huber D, Mehls O, Maiwald J, Stein G, Veldhuis JD, Ritz E, Schaefer F. Altered instantaneous and calcium-modulated oscillatory PTH secretion patterns in patients with secondary hyperparathyroidism. J Am Soc Nephrol. 1998;9(10):1832–1844. doi: 10.1681/ASN.V9101832. [DOI] [PubMed] [Google Scholar]
- Wong PKK, Campbell IK, Egan PJ, Ernst M, Wicks IP. The role of the interleukin-6 family of cytokines in inflammatory arthritis and bone turnover. Arthritis Rheum. 2003;48(5):1177–1189. doi: 10.1002/art.10943. [DOI] [PubMed] [Google Scholar]
- van Zaanen HC, Koopmans RP, Aarden LA, Rensink HJ, Stouthard JM, Warnaar SO, Lokhorst HM, van Oers MH. Endogenous interleukin 6 production in multiple myeloma patients treated with chimeric monoclonal anti-IL6 antibodies indicates the existence of a positive feed-back loop. J Clin Invest. 1996;98(6):1441–1448. doi: 10.1172/JCI118932. [DOI] [PMC free article] [PubMed] [Google Scholar]
- Alexandrakis MG, Passam FH, Sfiridaki A, Kandidaki E, Roussou P, Kyriakou DS. Elevated serum concentration of hepatocyte growth factor in patients with multiple myeloma: correlation with markers of disease activity. Am J Hematol. 2003;72(4):229–233. doi: 10.1002/ajh.10304. [DOI] [PubMed] [Google Scholar]
- Fan X, Roy E, Zhu L, Murphy TC, Ackert-Bicknell C, Hart CM, Rosen C, Nanes MS, Rubin J. Nitric oxide regulates receptor activator of nuclear factor-kappaB ligand and osteoprotegerin expression in bone marrow stromal cells. Endocrinology. 2004;145(2):751–759. doi: 10.1210/en.2003-0726. [DOI] [PubMed] [Google Scholar]
- Cheng X, Kinosaki M, Takami M, Choi Y, Zhang H, Murali R. Disabling of receptor activator of nuclear factor-kappaB (RANK) receptor complex by novel osteoprotegerin-like peptidomimetics restores bone loss in vivo. J Biol Chem. 2004;279(9):8269–8277. doi: 10.1074/jbc.M309690200. [DOI] [PubMed] [Google Scholar]
- Kuehl WM, Bergsagel PL. Multiple myeloma: evolving genetic events and host interactions. Nat Rev Cancer. 2002;2(3):175–187. doi: 10.1038/nrc746. [DOI] [PubMed] [Google Scholar]
- Wols HAM, Underhill GH, Kansas GS, Witte PL. The role of bone marrow-derived stromal cells in the maintenance of plasma cell longevity. J Immunol. 2002;169(8):4213–4221. doi: 10.4049/jimmunol.169.8.4213. [DOI] [PubMed] [Google Scholar]
- Salmon SE, Smith BA. Immunoglobulin synthesis and total body tumor cell number in IgG multiple myeloma. J Clin Invest. 1970;49(6):1114–1121. doi: 10.1172/JCI106327. [DOI] [PMC free article] [PubMed] [Google Scholar]
- Zwartz G, Chigaev A, Foutz T, Larson RS, Posner R, Sklar LA. Relationship between molecular and cellular dissociation rates for VLA-4/VCAM-1 interaction in the absence of shear stress. Biophys J. 2004;86(2):1243–1252. doi: 10.1016/S0006-3495(04)74198-3. [DOI] [PMC free article] [PubMed] [Google Scholar]
- Chigaev A, Blenc AM, Braaten JV, Kumaraswamy N, Kepley CL, Andrews RP, Oliver JM, Edwards BS, Prossnitz ER, Larson RS, Sklar LA. Real time analysis of the affinity regulation of alpha 4-integrin. The physiologically activated receptor is intermediate in affinity between resting and Mn(2+) or antibody activation. J Biol Chem. 2001;276(52):48670–48678. doi: 10.1074/jbc.M103194200. [DOI] [PubMed] [Google Scholar]
- Yeh HS, Berenson JR. Myeloma bone disease and treatment options. Eur J Cancer. 2006;42(11):1554–1563. doi: 10.1016/j.ejca.2005.11.035. [DOI] [PubMed] [Google Scholar]
- Edwards CM, Zhuang J, Mundy GR. The pathogenesis of the bone disease of multiple myeloma. Bone. 2008;42(6):1007–1013. doi: 10.1016/j.bone.2008.01.027. [DOI] [PMC free article] [PubMed] [Google Scholar]
- Ji B. 2012. Mathematical modelling of bone remodelling at the cellular level and the interaction between myeloma cells and the bone microenvironment. PhD Thesis, University of Hull, UK, (Available from: https://hydra.hull.ac.uk/catalog/hull:6373) [Accessed 5 April 2013]
- Caplan AI. Adult mesenchymal stem cells for tissue engineering versus regenerative medicine. J Cell Physiol. 2007;213:341–347. doi: 10.1002/jcp.21200. [DOI] [PubMed] [Google Scholar]
- Cristy M. Active bone marrow distribution as a function of age in humans. Phys Med Biol. 1981;26:389–400. doi: 10.1088/0031-9155/26/3/003. [DOI] [PubMed] [Google Scholar]
- Lerner UH. New molecules in the tumor necrosis factor ligand and receptor superfamilies with importance for physiological and pathological bone resorption. Crit Rev Oral Biol Med. 2004;15:64–81. doi: 10.1177/154411130401500202. [DOI] [PubMed] [Google Scholar]
- Cowin SC. Bone Mechanics Handbook. 2nd. New York: CRC Press LLC; 2001. [Google Scholar]
- Parfitt AM. Osteonal and hemi-osteonal remodeling – the spatial and temporal framework for signal traffic in adult human bone. J Cell Biochem. 1994;55:273–286. doi: 10.1002/jcb.240550303. [DOI] [PubMed] [Google Scholar]
- Morgan G. Criteria for the classification of monoclonal gammopathies, multiple myeloma and related disorders: a report of the International Myeloma Working Group. Br J Haematol. 2003;121(5):749–757. [PubMed] [Google Scholar]
- Alexandrakis MG, Passam FH, Malliaraki N, Katachanakis C, Kyriakou DS, Margioris AN. Evaluation of bone disease in multiple myeloma: a correlation between biochemical markers of bone metabolism and other clinical parameters in untreated multiple myeloma patients. Clin Chim Acta. 2002;325(1-2):51–57. doi: 10.1016/s0009-8981(02)00246-2. [DOI] [PubMed] [Google Scholar]
- Diamond T, Levy S, Day P, Barbagallo S, Manoharan A, Kwan YK. Biochemical, histomorphometric and densitometric changes in patients with multiple myeloma: effects of glucocorticoid therapy and disease activity. Br J Haematol. 1997;97(3):641–648. doi: 10.1046/j.1365-2141.1997.1042920.x. [DOI] [PubMed] [Google Scholar]
- Terpos E, Szydlo R, Apperley JF, Hatjiharissi E, Politou M, Meletis J, Viniou N, Yataganas X, Goldman JM, Rahemtulla A. Soluble receptor activator of nuclear factor kappaB ligand-osteoprotegerin ratio predicts survival in multiple myeloma: proposal for a novel prognostic index. Blood. 2003;102(3):1064–1069. doi: 10.1182/blood-2003-02-0380. [DOI] [PubMed] [Google Scholar]
- Seidel C, Hjertner O, Abildgaard N, Heickendorff L, Hjorth M, Westin J, Nielsen JL, Hjorth-Hansen H, Waage A, Sundan A, et al. Serum osteoprotegerin levels are reduced in patients with multiple myeloma with lytic bone disease. Blood. 2001;98(7):2269–2271. doi: 10.1182/blood.v98.7.2269. [DOI] [PubMed] [Google Scholar]
- Lipton A, Ali SM, Leitzel K, Chinchilli V, Witters L, Engle L, Holloway D, Bekker P, Dunstan CR. Serum osteoprotegerin levels in healthy controls and cancer patients. Clin Cancer Res. 2002;8(7):2306–2310. [PubMed] [Google Scholar]
- Standal T, Seidel C, Hjertner O, Plesner T, Sanderson RD, Waage A, Borset M, Sundan A. Osteoprotegerin is bound, internalized, and degraded by multiple myeloma cells. Blood. 2002;100(8):3002–3007. doi: 10.1182/blood-2002-04-1190. [DOI] [PubMed] [Google Scholar]
- Goranova-Marinova V, Goranov S, Pavlov P, Tzvetkova T. Serum levels of OPG, RANKL and RANKL/OPG ratio in newly-diagnosed patients with multiple myeloma. Clinical correlations. Haematologica. 2007;92(7):1000–1001. doi: 10.3324/haematol.10943. [DOI] [PubMed] [Google Scholar]
- Terpos E, Heath DJ, Rahemtulla A, Zervas K, Chantry A, Anagnostopoulos A, Pouli A, Katodritou E, Verrou E, Vervessou EC, et al. Bortezomib reduces serum dickkopf-1 and receptor activator of nuclear factor-kappaB ligand concentrations and normalises indices of bone remodelling in patients with relapsed multiple myeloma. Br J Haematol. 2006;135(5):688–692. doi: 10.1111/j.1365-2141.2006.06356.x. [DOI] [PubMed] [Google Scholar]
- Zumsande M, Stiefs D, Siegmund S, Gross T. General analysis of mathematical models for bone remodeling. Bone. 2011;48(4):910–917. doi: 10.1016/j.bone.2010.12.010. [DOI] [PubMed] [Google Scholar]
- Rogers MJ, Gordon S, Benford HL, Coxon FP, Luckman SP, Monkkonen J, Frith JC. Cellular and molecular mechanisms of action of bisphosphonates. Cancer. 2000;88(12 Suppl):2961–2978. doi: 10.1002/1097-0142(20000615)88:12+<2961::aid-cncr12>3.3.co;2-c. [DOI] [PubMed] [Google Scholar]
- Shay G, Rogers M. Bisphosphonates and cancer: current controversies. Osteoporosis Rev. 2011;19(3):9–12. [Google Scholar]


