

Abstract
The rates and properties of new mutations affecting fitness have implications for a number of outstanding questions in evolutionary biology. Obtaining estimates of mutation rates and effects has historically been challenging, and little theory has been available for predicting the distribution of fitness effects (DFE); however, there have been recent advances on both fronts. Extreme-value theory predicts the DFE of beneficial mutations in well-adapted populations, while phenotypic fitness landscape models make predictions for the DFE of all mutations as a function of the initial level of adaptation and the strength of stabilizing selection on traits underlying fitness. Direct experimental evidence confirms predictions on the DFE of beneficial mutations and favors distributions that are roughly exponential but bounded on the right. A growing number of studies infer the DFE using genomic patterns of polymorphism and divergence, recovering a wide range of DFE. Future work should be aimed at identifying factors driving the observed variation in the DFE. We emphasize the need for further theory explicitly incorporating the effects of partial pleiotropy and heterogeneity in the environment on the expected DFE.
Keywords: mutation, distribution of fitness effects, experimental evolution, population genomics, mutational landscape models
Introduction
The ultimate source of heritable variation is mutation, and the characteristics of these arising mutations define the range of possible evolutionary trajectories a population can follow. Details about the attributes of mutations affecting fitness define central parameters in evolutionary theory and have implications for a number of outstanding questions in evolutionary biology. For example, the rate of adaptation of a population is expected to depend on the rate of mutation and on the distribution of fitness effects (DFE) of the arising beneficial mutations, as the presence of even a few large-effect mutations can have a big impact on how quickly a population moves toward its fitness optimum. On the other hand, the DFE of deleterious mutations, in particular the proportion of weakly deleterious mutations, determine a population's expected drift load—the reduction in fitness due to multiple small-effect deleterious mutations that individually are close enough to neutral to occasionally escape selection, but can collectively have important impacts on fitness. The DFE of new mutations influences many evolutionary patterns, such as the expected degree of parallel evolution,1 the evolutionary potential and capacity of populations to respond to novel environments,2,3 the evolutionary advantage of sex,4 and the maintenance of variation on quantitative traits,5 to name a few. Thus, an understanding of the DFE of mutations is a pivotal part of our understanding of the process of evolution.
Obtaining reliable estimates of mutation rates and the effects of new mutations on fitness has been historically challenging for a number of reasons. Three factors conspire to make this a difficult empirical endeavor. First, until recently, evolutionary genetics theory typically assumed the existence of heritable variation rather than modeling its origin. Thus, we had very few theoretical expectations for what the mutation rates and effects of new mutations on fitness should be. Second, the rarity of mutations, especially mutations that are beneficial for fitness,6,7 meant that it was experimentally difficult to obtain samples sizes compatible with testing hypotheses relating to mutation parameters. Third, until recently, it was technically very difficult to locate the molecular basis of new mutations in genomes, and many empirical studies inferred the occurrence of new mutations through their phenotypic effects instead of exhibiting the actual molecular variants underlying observed fitness-associated changes. Things have changed rapidly on these three fronts, as (1) several theoretical models now make explicit predictions regarding the fitness effects of new mutations, (2) the experimental evolution approach has greatly expanded within evolutionary biology, and (3) the advent of cost-effective high-throughput sequencing makes molecular detection of new mutations in genomes a routine procedure.
The goals of this review are to critically assess the progress made on these three fronts and the gains made in our understanding of spontaneous mutations and their effects, with a special focus on the properties of beneficial mutations. Our review is organized broadly into three sections. We first review existing theory for rates and effects of new mutations affecting fitness. In particular, we compare the relative merits of heuristic models relying on purely statistical arguments and those explicitly tackling the prediction of the phenotypic and fitness effects of new mutations. Our review of the theory is biased toward phenotypic fitness-landscape models, as much progress has been made recently on deriving theoretical expectations for DFE using this modeling approach. We then review empirical evidence from various types of experimental settings that yield insight into the effect of new mutations. We first review the studies that aim at directly isolating individual mutations and measuring their effects. We then examine other experimental strategies that seek to obtain insight into the occurrence and effect of mutations by monitoring fitness trajectories of populations over time. Finally, we review approaches that use observable levels of standing genetic variation within a population and divergence between populations to make inferences about mutation rates and effects on fitness. We close by discussing to what degree insights from both approaches can be reconciled and what outstanding questions remain.
Models for the fitness effects of new mutations
Many models of adaptation assume that some form of genetic variation is present and are aimed at predicting the evolutionary response of a population to natural or artificial selection. Some models will assume an explicit amount of allelic variation is segregating at a number of discrete loci underlying genetic variation for fitness or any trait of interest, whereas other models will only keep track of a phenotypic variable and operate under idealized conditions where the amount of genetic diversity available is a fixed parameter (i.e., a certain amount of genetic variance considered as fixed, see the multivariate breeder's equation8). Other models aim to make predictions both about (1) the origin of variation (through new mutations) and (2) how sieving that variation through a natural selection filter generates adaptation. These will be the focus of this review, and we begin by reviewing models that make predictions on the DFE of new mutations.
Modeling the origin of variation amounts to specifying a space of possible: how many mutations can arise per generation and what is the range of their fitness effects? The way we quantify the mutational input is by defining a genome-wide mutation rate for fitness (U) and by assuming that replication of each new genome entails a variable number of mutations that is stochastic and, more specifically, will follow a Poisson distribution with mean U. The space of possible is then specified by characterizing the change in fitness incurred by a new mutation relative to a mutation-free reference genotype, and the fitness difference between these two genotypes is defined as the fitness effect s of the new mutation. In order to account for a range of fitness effects, each new mutation arising in the genome gets an associated fitness effect s drawn at random from an underlying distribution. Thus, we describe the DFE of new mutations by characterizing (estimating) that underlying distribution.
The family of statistical distribution chosen to parameterize the DFE can reflect a merely statistical choice—either chosen out of pure convenience or justified through heuristics, see below—or can be derived using biologically plausible fitness landscape models. Mathematical population–genetic models can, in turn, make predictions on observable quantities such as the rate of adaptation in experimental populations or the patterns of polymorphism/divergence within or among species. We focus our review on both types of approaches and how they have generated testable predictions about the DFE of new mutations.
Heuristic models relying on extreme-value theory (EVT)
If adaptation is seen as a fine tuning of genotypes to their environment, an important intuition is that, within a well-adapted population, most mutations with detectable fitness effects tend to be deleterious. This assertion is often implicit in many models that consider only unconditional deleterious mutations and their evolutionary consequences.9 Another important insight that follows from this assertion is that if mutations that are beneficial (s > 0) are rare, then surprisingly general predictions can be made. In brief, the whole DFE might be very hard to predict (some hypothetical DFE are illustrated in Fig.1), but if a population is well adapted to its current environment, and therefore if beneficial mutations are rare, these can be seen as extreme events (draws from the tail of a distribution or past a certain threshold (Fig.1)). An important insight from statistical theory is that many distributions that have a rather different appearance have very similar tails. It can actually be shown, using results from EVT, that draws from tails of virtually any distribution converge to a unifying distribution (the generalized Pareto distribution) characterized by a specific scale and, more importantly, shape parameter10 (see Fig.2 for examples of possible distributions from that family). Knowing which type of limiting distribution characterizes beneficial mutations can be, in turn, used for predictions about the dynamics of adaptation.11 Before reviewing empirical evidence bearing on DFE, we present another route to derive the expected DFE, through the use of an explicit mapping for the phenotypic effect of mutation and, in turn, by specifying what type of selection operates on phenotypes. This approach then allows prediction of the whole DFE (not just the DFE of beneficial mutations).
Figure 1.
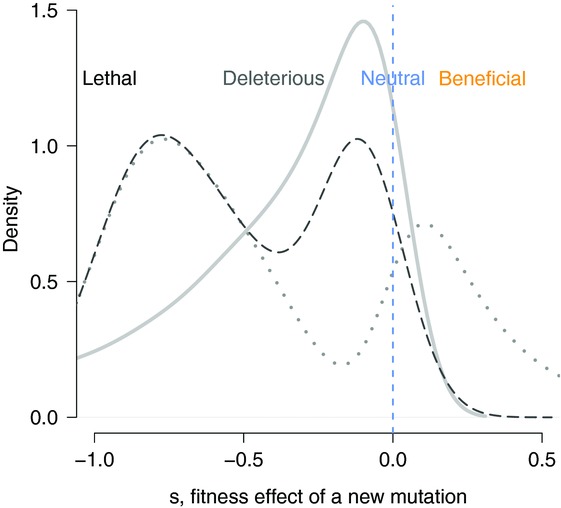
Hypothetical whole distributions of fitness effects. The whole distribution of fitness effect can comprise, in principle, a continuum of fitness effects ranging from lethal to strongly or mildly deleterious to beneficial. Three distributions are pictured here that comprise different amounts of deleterious and beneficial mutations. The dotted and dashed distributions are arbitrarily chosen, while the continuous distribution (solid gray) is one of the type predicted by a Fisherian fitness landscape (a displaced and reflected Γ distribution).
Figure 2.
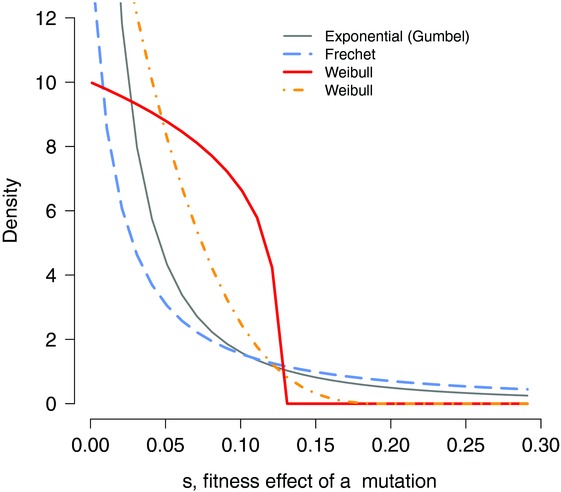
Alternative distribution of beneficial fitness effects as predicted by extreme-value theory (EVT). All distributions displayed here are specific cases of a generalized Pareto distribution9 that differ by their shape. A shape of 1 corresponds to an exponential distribution (gray), a shape parameter >1 will yield a DFE with a much heavier tail (so-called Frechet domain, in blue). Alternatively, a shape parameter <1 will yield distributions that decay much more rapidly than the exponential (so-called Weibull domain), and the beneficial mutations cannot exceed a maximum beneficial effect.
Explicit fitness landscape models
Fitness landscapes mathematically map the large space of possible genetic differences to fitness differences. A large variety of fitness landscape models have been devised. Here, we will focus on predictions from so-called phenotypic fitness landscape models that consider the fitness effects of new mutations by modeling their phenotypic effects on a series of quantitative traits that together determine fitness. Phenotypic fitness landscapes were originally proposed by Fisher as a means to argue for the fact that beneficial mutations were of small effect.12 This argument was later refined by Kimura,13 who also argued that mutations of very small effect were unlikely to make much contribution to adaptation because they had a relatively low probability of escaping genetic drift.
These models also have the potential to accommodate different initial levels of adaptation and, possibly, different genetic architectures.14–16 These are—together with, for instance, mutation rates and population size—key parameters that we expect to affect the supply of new adaptive mutations in a population and, therefore, govern its speed of adaptation. These models assume that fitness is determined by n traits and that, in a given environment, there is an optimal value for each of these traits. Fitness decreases smoothly as the phenotypic values get further from the optimum. Models differ in their specific assumptions regarding the way that mutations affect the underlying traits. Phenotypic effects of mutations are modeled as being drawn in a multivariate normal distribution with mean 0 and covariance matrix M (n*n matrix when positing n dimension). Selection in this phenotypic space is specified by a multivariate Gaussian fitness function (with covariance matrix S), although different mappings have also been explored.17 Models can either assume that every mutation is fully pleiotropic and will affect the phenotypes of all n traits14 or only partially pleiotropic, thus only affecting m out of n traits.16 Finally, some models also model locus–locus heterogeneity by assuming a specific mutational matrix M for each locus or class of loci in a genome.1 A number of important predictions emerge from this class of models: notably, the current distance to the optimum of a genotype in the multivariate space, together with the M matrix, determines the complete DFE of new mutations arising in that genotype and the proportion of mutations that will be favorable.
These types of models have been explored extensively over the last decade. One of their main merits is that an important biological intuition can be formalized: the current level of adaptation of a population to a given environment might strongly influence the probability that a new mutation might be beneficial in that environment. When a genotype resides at the multivariate optimum, any new mutation will move phenotypes away from the optimum and, therefore, will be deleterious; but if a genotype resides further from the optimum, a greater proportion of mutations will entail phenotypic changes that bring the resulting genotype closer to the optimum and, thus, are beneficial for fitness. In that case, a displaced reflected Γ DFE is predicted (Fig.1). Another benefit of that type of modeling is that the model can also generate predictions for further properties of mutations (beyond their DFE), such as how mutations interact through either dominance or epistasis to determine fitness.18 Last, but not least, if one defines the complexity of an organism through the number of phenotypic dimensions n, these models can also make predictions about how differences in complexity will translate to differences in the flux of beneficial mutations available for further adaptation in a given environment.
Below, we review the empirical evidence available for the DFE of mutations. We cover both studies where an experimental evolution approach has been used, and these studies are therefore heavily based on microbial organisms. We then review how patterns of polymorphism and divergence can also be used to infer the DFE of new mutations. Here, we tend to focus on mutations occurring explicitly in protein-coding regions and focus on the DFE of nonsynonymous mutations. Throughout, our discussion is biased toward studies that analyze more quantitative data bearing on the DFE using the theoretical expectations sketched above.
Empirical studies from experimental evolution
In the past, experimental studies have made estimates of the DFE of mutations using two main methods. The first method obtains direct measurements of fitness from a collection of (presumably) single-step mutants. In the second method, inferences are drawn about the fitness effects of new mutations from changes in population fitness or trait measures under conditions where the selection regime (or lack of selection) is known. Both methods have their advantages and limitations, and we discuss each of them in turn, along with the general patterns and insights drawn from these data. It is important to point out that, while many studies attempt to characterize the DFE of mutations by statistically rejecting one type of distribution in favor of another, studies focusing on the DFE of beneficial mutations often have very little power to do this, simply because the number of beneficial mutations recovered is usually very small. A crucial aspect of these experimental approaches for characterizing the DFE is the quantification of changes in fitness. This task is not straightforward and continues to be an area for discussion in evolutionary biology (e.g., Ref. 19). Thus, we touch on it briefly before moving on to the details of empirical studies of DFE.
In studies with multicellular organisms, fitness is usually estimated by either measuring a component of fitness (e.g., viability20) or measuring a trait known to be correlated with fitness (e.g., body size21). In microbes, fitness is generally quantified using either a growth assay or a competitive fitness assay. With a growth assay, the strain of interest is grown in the environment of interest and repeated measures of cell density are obtained over time. Fitness is usually estimated from the exponential growth rate of the strain.22 With a competitive growth assay, the strain of interest is grown in coculture with a comparison strain (usually the ancestral strain), and repeated measures of the frequency of the two types are obtained over time. Fitness is estimated from the change in relative frequency of the two types.23 While fitness estimates using these two types of assay are usually positively correlated,24 the two types of fitness measures can only be equal when both density- and frequency-dependent selection are negligible.25 Competitive assays can be a comprehensive and appropriate way to estimate fitness when one is interested in, for example, the fitness of a mutant arising in an isogenic population of wild types. However, in cases where the appropriate competitor with which to compete is unclear or difficult to obtain (for example, a mutant arising in a diverse population or community), growth assays may be the best, albeit not truly accurate, choice. Unless the mutations of interest alter the relationship between what is measured and the true value of fitness, the specifics of the method employed are unlikely to affect the shape of the inferred DFE from any given experiment. Although quantitative comparisons of fitness-effect sizes across studies can be difficult, there are ways to minimize these potential problems.25
Directly measuring the fitness effects of mutations
In order to directly measure the fitness effects of mutations, a collection of mutants must first be created. There are two main methods used for generating mutant collections: (1) a fluctuation assay procedure and (2) site-directed mutagenesis.
Side effects of beneficial mutations with conspicuous fitness effects
The classic Luria–Delbruck fluctuation assay26 was originally conceived as a method for estimating spontaneous mutation rates in bacteria. In this procedure, a number of parallel cultures are initiated with identical wild-type cells. After some period of growth in a permissive medium (often overnight), each culture is then transferred to a selective medium (often solid agar with an antibiotic). Any cells in which a resistance mutation arose during the permissive growth period are then able to grow on the selective media, whereas cells with the wild-type genotype perish. The arising mutants are usually assumed to be single-step mutants because of the short period of time during which they arise, although the probability of this being the case for a given experiment can be explicitly estimated.27 The distribution of the number of mutants arising in these parallel cultures can then be used to estimate mutation rate.26,28 Further details about the mutations arising, including their DFE, can be obtained by collecting the mutants and assaying their fitness under whatever conditions are of interest. Although mutants generated in this way are all beneficial in the selective media on which they were isolated, the assumption is that they represent a random collection of fitness effects (deleterious, neutral, and potentially beneficial) in other unrelated environments.
This method has been used to make inferences about the DFE of beneficial mutations in bacterial systems (Table1). Kassen and Bataillon27 and MacLean and Buckling29 characterized the DFE of beneficial mutations in environments where wild-type fitness is high (i.e., close to the fitness optimum) and showed that the observed DFE is not significantly different from an exponential distribution. Bataillon et al.30 later assayed a set of favorable mutants in a large set of very simple environments (95 different carbon sources). Although in each environment, small sample sizes were available for testing distributions, overall the null hypothesis of an exponential DFE for beneficial mutation was strongly rejected, and point estimates of the shape of the DFE consistently pointed toward distributions that are bounded to the right (i.e., in the Weibull domain (Fig.2)).
Table 1.
DFE inferred from experimental studies relying on the isolation of individual mutations
| Strategy used to isolate mutations | Organism | Mutational target | Number of beneficial mutations | Mutations characterized | DFE inferred | References |
|---|---|---|---|---|---|---|
| Resistance to antibiotic | Pseudomonas fluorescens | gyrA and others | 18 | Beneficial | Exponential | 27 |
| Resistance to antibiotic | P. aeruginosa | rpoB | 15 | Beneficial | Exponential | 29 |
| Reporter construct | P. fluorescens | 11 genes total | 100 | Beneficial | Normal | 31 |
| Increased growth rate | ssDNA bacteriophage Id11 | WG | 9 | Beneficial | Weibull | 34 |
| Novel host growth | RNA phage ϕ6 | P3 (host attachment gene) | 16 | Beneficial | Weibull | 34 |
| Site-directed mutagenesis | VSV (RNA virus) | WG | 16 | (A) Beneficial | (A) Γ, significantly leptokurtic | 16 |
| (B) Deleterious | (B) log-normal + uniform | |||||
| Site-directed mutagenesis | RNA bacteriophage Qβ; ssDNA bacteriophage ΦX174 | WG | 0 | All | Γ, but β and exponential also fit well | 72 |
| Site-directed mutagenesis | RNA virus pTEV-7DA | WG | 0 | Viable mutations only | β, but all distributions tested were significant | 38 |
| Site-directed mutagenesis | ssDNA bacteriophage f1 | WG | 2 | All | Log-normal or Weibull | 73 |
| Site-directed mutagenesis | E. coli | β-lactamase TEM-1 | 0 | All | Γ; biophysical model of protein stability | 39 |
| Site-directed mutagenesis | Salmonella typhimurium | rpsT and rplA | 0 | All | Γ | 36 |
| Site-directed mutagenesis (EMPIRIC) | iG170D S. cerevisiae + plasmid w/Hsp90 | 9 AAs in HSP90 | 0 | All | Bimodal (nearly neutral + deleterious) | 37 |
| Tn insertion | E. coli | WG | 0 | All | Γ + uniform | 23 |
WG, whole genome.
MacLean and Buckling29 also characterized the DFE of beneficial mutations in environments where wild-type fitness is low, and in those cases they rejected the exponential distribution. McDonald et al.31 used a modified version of the fluctuation assay procedure involving a reporter construct to characterize the DFE of beneficial mutations in an environment where wild-type fitness is low, and found that a normal distribution provided the best fit to their data.
Mutations generated using a fluctuation assay can, in principle, arise anywhere in the genome; however, in practice these mutations very often arise in a handful of genes known to be important in whatever selective medium was used. This can be beneficial, as it can facilitate explicit identification of mutations through targeted sequencing.29 On the other hand, it also suggests that the types of mutations that are collected using this method may be idiosyncratic, as they tend to arise only in particular types of genes. Furthermore, the size of a bacterial genome—106 base pairs—and the measured genome-wide mutation rates for fitness of U around 0.00332 make it very difficult to ensure that strategies for isolating single-step mutants based on fluctuation assays reliably yield only single-step mutations. In fact, further scrutiny of large mutant collections collected using this strategy sometimes reveals a sizable portion (up to 20–30%) of genomes carrying a second-site mutation affecting fitness.30 Although the presence of these second mutations is not fatal to tests of the theory, it might complicate/compromise the initial goal of these studies: direct inference on DFE before the biasing effects of selection and drift.
Another potential bias in this type of data can arise if fitness in the selective environment is correlated with fitness in the environment in which the DFE is being characterized. This is because only mutants with conspicuous fitness effects are detected and isolated during the mutant selection process, and so the class of mutations with weakly beneficial effects (translating into slower growth) in the selection environment is undersampled. If this class of mutation also tends to have weakly beneficial fitness effects in the environment of interest, the result may be an observed peaked distribution11,33 (Fig.1), while the real DFE might be more L-shaped. This could be the reason McDonald et al.31 detect a normal DFE for beneficial mutations; however, the authors find no correlation between fitness in the selective and test environments, suggesting that the peaked distribution reflects real properties of the system.
This potential bias is realized to its fullest extent when the DFE of beneficial mutation is tested in the environment from which the mutants were originally collected. Rokyta et al.34 characterize the DFE of beneficial mutations using two virus data sets with this potential bias—mutants were both identified and their fitness was tested by growth on a particular host bacteria. However, the authors acknowledge this potential bias and use a statistical approach suggested by Beisel et al.,10 shifting the data with the aim of characterizing just the tail of the DFE, instead of the entire data set.
Systematic gene-by-gene mutagenesis
Mutagenesis is the other widely used method for generating collections of spontaneous mutants. This can be a targeted or an untargeted process. Elena et al.23 used untargeted mutagenesis to generate a set of Escherichia coli mutants through the random insertion of transposon (Tn) elements throughout the genome. Of the distributions tested, the authors found a compound Γ+ uniform distribution was the best fit to the DFE of all mutations (no beneficial mutations were detected). The authors note, however, that the high frequency of large-effect deleterious mutations that they observed may be an artifact of the particular type of mutants generated. Insertions (used in this study) may be more likely to result in gene loss of function compared to point mutations, and so it may be that the DFE of all random mutations is closer to a Γ distribution.
Site-directed mutagenesis removes some of the potential biases inherent to fluctuation assays and some untargeted mutagenesis methods by systematically generating a known set of mutations. This method has been used to examine the DFE of mutations in a number of viral, bacterial, and yeast systems. Most of these studies have recovered few to no beneficial mutations and so characterize the DFE of all mutations combined instead of focusing on beneficial ones. A study by Sanjuán et al.35 is an exception, separately characterizing the DFE of beneficial and deleterious mutations. Here, the DFE of beneficial mutations best fits a Γ distribution, skewed toward small-effect mutations and significantly leptokurtic.
Most site-directed mutagenesis studies that look at the DFE of all mutations across a range of mutational targets report Γ or unimodal similarly shaped distributions (Table1). Even a comparison of synonymous and nonsynonymous mutations suggested that the fitness effects of both categories of mutations followed Γ distributions, although the mean effect size of the synonymous mutations was less than that of the nonsynonymous ones.36 However, Hietpas et al.37 report a clear bimodal DFE of mutations, comprising a set of nearly neutral mutations and a set of highly deleterious mutations; in fact, a closer look indicates that many site-directed mutagenesis studies reporting Γ-like DFE of mutations do actually see bimodal DFE if they include the set of lethal mutations.38 Jacquier et al.39 found that a Γ distribution fit their data reasonably well, but suggest that a mechanistic approach to fitting the data is more appropriate. The authors used protein-stability estimates to predict the fitness effects of mutations in their experiment and found that this provided a better fit than all the classical distributions tested.
Site-directed mutagenesis can provide an unbiased and extremely thorough look at the DFE of mutations. However, for logistical reasons, its use has been restricted to examination of the DFE of mutations in very small genomes (i.e., viruses), a few genes, or even particular regions within a given gene. For this reason, the development of high-throughput methods for generating mutations37 is very exciting, potentially greatly extending the power of this method of DFE characterization.
Inferring the rate and fitness effects of new mutations from fitness trajectories over time
The DFE of new mutations can also be inferred from changes in fitness (or a trait closely related to fitness) of a collection of populations over time. These fitness changes can be observed in populations where selection has been relaxed (mutation-accumulation experiments) or in large populations under selection (adapting populations). Under these different conditions, different sets of mutations are observed. In mutation-accumulation experiments, mutations accumulate at the rate at which they appear, while in adapting populations, we expect that virtually only beneficial mutations will persist.
Mutation-accumulation experiments
Mutation-accumulation experiments have historically been the approach for estimating the characteristics of spontaneous mutations in eukaryotes. In these experiments, selection is relaxed by propagating populations at as small an effective population size as is feasible. Much work has been done characterizing mutations in this way, beginning with Drosophila melanogaster40,41 and expanding over the years to a range of other species.42 A major benefit of this method is that the characteristics of mutations affecting fitness can be estimated without having to directly identify the mutations involved. Classic methods for analyzing mutation-accumulation data assume equal unidirectional mutation effects and so only give estimates of mutation rates and mean fitness-effect size. Newer methods tend to assume that the DFE is Γ distributed and then find Γ distribution–parameter estimates that best fit with the observed changes in the mean and variance of fitness among replicate populations.
It is important to note that mutation accumulation inference methods only make predictions about mutations that have moderate fitness effects—mutations with weak fitness effects are difficult to detect, and neutral mutations are impossible to detect. Another potential bias is that although selection is relaxed in these experiments, it is very difficult to eliminate it completely. For example, Estes et al.43 found that even in Caenorhabditis. elegans populations made up of only three individuals, selection was able to maintain fitness at high levels relative to populations of size one. Relaxing selection is even more difficult in microbial populations, because although the populations can be bottlenecked to a single individual, selection can still occur during colony growth phase (albeit at a much reduced level).
We do not discuss in detail characterizations of DFE from mutation-accumulation experiments, as Halligan and Keightley42 have recently reviewed mutation-accumulation studies and, in doing so, have summarized predicted DFE of mutations from this method (see Table2 in Ref. 42). In general, they saw that estimates of DFE tended to be more fat-tailed (platykurtic) than the exponential distribution. The authors suggest that this tendency does not agree with the long-held assumption that the DFE of mutations is strongly leptokurtic,13 so it could indicate that the Γ distribution does not capture the true distribution, which may instead be complex and multimodal.
Table 2.
Summaries of studies inferring mutational properties through fitness/marker trajectories over time
| Method | Organism | Sample size (# of mutations) | DFE | Beneficial mutation rate | References |
|---|---|---|---|---|---|
| Marker frequencies | E. coli | 66 | Exponential or Γ | 4 × 10⁻⁹ | 74 |
| Marker frequencies | E. coli | 30 | Peaked, unimodal | 5.9 × 10⁻⁸ | 44 |
| Marker frequencies | E. coli | 72 | Exponential, uniform, and Dirac δ | 2 × 10⁻⁷ | 46 |
| Marker frequencies | E. coli | 75 and 87 | Γ | 10−5 | 64 |
| Marker frequencies | E. coli | K43N: 81; K88E: 102 | K43N: cannot reject log-normal (Weibull domain) | K43N: 5 × 10⁻⁵; K88N: 4 × 10⁻⁵ | 45 |
| K88E: β (reject Weibull) | |||||
| Marker frequencies | P. fluorescens | 68 | Weibull | 3.8 × 10⁻⁸ | 75 |
| Mean fitness over time | A. nidulans | 260 | Unimodal, positively skewed | – | 65 |
| Mean fitness over time | P. aeruginosa | 288 | Unimodal for one genotype, bimodal for the other two. | 6.6 × 10⁻⁸ | 22 |
Fitness trajectories in adapting populations
With this method, beneficial mutations are characterized as they arise in adapting populations. One strategy is to detect the first (or first few) by monitoring the frequencies of competing strains that are differentiated by neutral markers (e.g., antibiotic resistance, colony color, microsatellite markers) over a relatively short time period. Another strategy is to estimate the fitness effects of fixed mutations from changes in population fitness as those populations adapt, usually over a longer period of time. Studies using this type of method are summarized in Table2.
This method identifies contending or fixed beneficial mutations (depending on the details of the particular experiment), as opposed to the full distribution of beneficial mutations, because weakly beneficial mutations that may arise will be comparatively less likely to escape drift. Some studies simply characterize the DFE of mutations that they have identified while acknowledging this potential bias.22,44 Other studies attempt to characterize the tail of the distribution using a statistical approach: the assumption is made that unobserved mutations fall below some fitness threshold, but the fitness effect of the smallest-effect mutation must be just above that threshold. With this in mind, the data can simply be shifted, and the DFE is characterized above that threshold.10,45 Since this approach is based on EVT, it is only appropriate when the wild type in question has high fitness (i.e., the DFE of beneficial mutations is adequately modeled as the tail of a distribution). Another approach is to compare the fitness or marker dynamics generated by population genetic models with different underlying DFE and to try to identify the type of DFE that generates dynamics most closely resembling that of the observed data. While it can be difficult to distinguish between alternate types of DFE when fitting short time series of marked strains that typically only track the initial spread of a favorable mutation,46 these difficulties can be alleviated by collecting additional types of data spanning longer evolutionary time periods.47,48
Population genomic studies and estimation of DFE
Since the first empirical data on patterns of nucleotide polymorphism (within species) and divergence (between species) were available for natural populations, a large fraction of population genetics studies have been devoted to speculating verbally or sometimes testing more quantitatively theories regarding which evolutionary mechanisms drive these empirical patterns.49,50 A fraction of the studies have the primary goal of exhibiting instances of adaptation where the footprints of natural selection are detectable at the molecular level of polymorphism and divergence.51 Others are aimed at solving the old riddle of what accounts for differences in polymorphism between species.52 Here, we do not attempt to review that very active field comprehensively, but instead focus on studies that explicitly aim at inferring the DFE from this type of empirical data.
We first provide some intuition for why patterns of polymorphism and divergence can inform us—albeit indirectly—about the DFE. We then review the available methods, their working assumptions, and the results obtained so far on a handful of model organisms. We close by sketching directions in which the current methods could/should be extended to provide further information on the DFE and genome-wide mutational parameters. Reviewing these methods is timely, given that the democratization of sequencing methods has opened the way to carry out population genomics surveys for nonmodel organisms.53 We can therefore expect, in the near future, to be able to provide insights into patterns of polymorphism and divergence, and thus potentially the DFE, for a much broader range of organisms.
Why does polymorphism data contain information on DFE?
A key insight is that deleterious mutations might contribute to polymorphism as low-frequency alleles, but rarely to divergence. A strongly deleterious mutation will only be found at a low frequency and will virtually never go to fixation because natural selection keeps it in check. On the other hand, a weakly deleterious mutation (Ns < 1, where N is the effective population size and s is the selection coefficient) will behave essentially like a completely neutral mutation, and thus might have a sizable chance to contribute to both polymorphism and divergence. We expect this outcome because natural selection has an inadequate grip on very weakly deleterious mutations, so they can rise to higher frequencies, and rarely even to fixation, thus contributing to divergence between species. Beyond this verbal intuition, one can use population genetic theory to specify the frequency at which we expect to see a nonsynonymous single nucleotide polymorphism (SNP) as a function of its deleterious fitness effect, and in turn make predictions about observable patterns of polymorphism and divergence (Fig.3). Population genetics theory predicts that the product S = 4Nes (where Ne is the effective size of a population54 and s the selection coefficient of a new mutation) determines the expectation for the number and frequencies of polymorphisms observed within species, as well as the amount of divergence between species. Expectations for total amounts of polymorphism (and amounts of polymorphism segregating in a given class of frequency) and divergence can then be compared to amounts expected for a class of mutations that are hypothesized to be neutral (Fig.4). Thus, empirical polymorphism and divergence data contain information on the distribution of scaled fitness effects, S, of new mutations. The emphasis here is on scale, as the selective effect of mutations can only be estimated up to a constant, the effective population size. Current methods seek to estimate the distribution of S values associated with new mutations, and possibly the fraction of mutations that are beneficial, from patterns of polymorphism and divergence. In the next section, we briefly review the assumptions common to most methods and then evaluate the empirical studies utilizing these methods to gain knowledge about the scaled fitness effects of new mutations.
Figure 3.
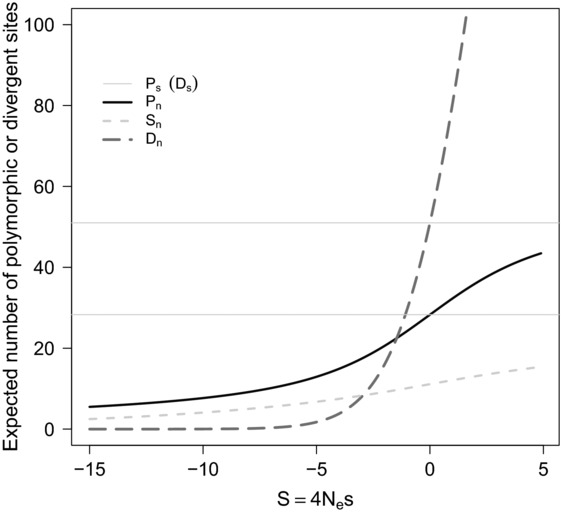
Expected amounts of polymorphism and divergence contributed by nonsynonymous mutations as a function of the scaled selection coefficient of a mutation. The expected amount of polymorphism in a genomic region can be summarized as the total number of polymorphic sites for both nonsynonymous (Pn) and synonymous sites (Ps, lower horizontal line), and the number of rare mutations using, for example, the number of singletons (mutations seen only once) at nonsynonymous sites (Sn). Amounts of divergence are quantified using the number of divergent synonymous (Ds, upper horizontal line) and nonsynonymous sites (Dn) relative to an out-group sequence. For a given mutation rate and effective population size, sample size n of chromosomes resequenced and size of a genomic fragment population genetic theory and diffusion results on the Wright-Fisher model can be used to compute these quantities as a function of the scaled mutation effect S of a nonsynonymous mutation. Here for illustration, we assume 1000 synonymous neutral sites, 3000 nonsynonymous nucleotide sites with a scaled mutation rate θ = 4Nμ = 0.01, a scaled divergence to the out-group of λ = 0.05, and a sample comprising n = 10 chromosomes.
Figure 4.
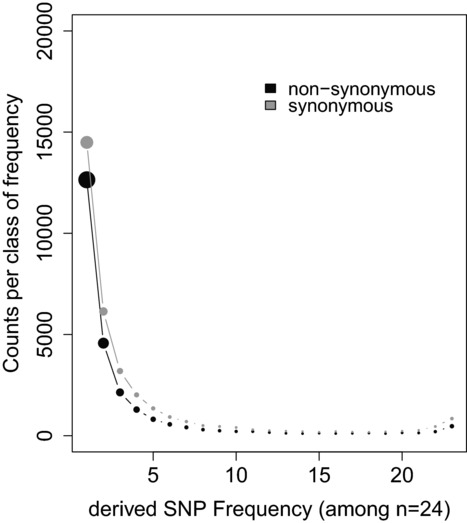
An example of site frequency spectrum (SFS) data in chimpanzee (Pan troglodytes troglodytes). Data comprising the resequencing of the exome of 12 individuals (n = 24 chromosomes) is redrawn using the data of Ref. 76. Circle size is proportional to counts of polymorphism. Synonymous counts are in gray (upper set of L-shaped dots) and nonsynonymous counts in black (lower set of L-shaped dots).
Methods inferring DFE from amounts of polymorphism and divergence
Most currently available methods first summarize observed polymorphism data through the site-frequency spectrum (SFS) of synonymous and nonsynonymous mutations (i.e., how many times do we observe a SNP present in 1, 2, 3, …, n – 1 copies in a sample comprising n sequenced chromosomes (Fig.4). These methods tend to assume that synonymous mutations are selectively neutral (but see the interesting exception in Drosophila55), and thus model the SFS of synonymous mutations as the by-product of mutation (bringing new alleles) and drift. The effect of drift is modeled by assuming a Wright–Fisher population genetic model where the population size can be either constant (Ne accounting for the data) or variable through time. At this time, most methods tend to assume very simplistic scenarios to account for variation in population size through time,56 but development of methods accounting for more complicated underlying demographics is ongoing.57 The joint effects of mutation, drift, and selection are expected to shape the patterns of polymorphism of nonsynonymous mutations, and thus comparison of the synonymous and nonsynonymous counts in the various frequency classes spanning the SFS are the basis for inferring the scaled mutation effects, S, of nonsynonymous mutations. The probability (likelihood) of a given set of SFS counts (the data) is computed by assuming a simplified demographic model (constant population size or a single population-size change in recent history), and that only deleterious mutations contribute to nonsynonymous polymorphism. Values for the scaled mutation rates per site (θ = 4Nμ) and a distribution of scaled fitness effects (scaled DFE) are typically fit by maximum likelihood.
The possible contribution of beneficial mutations to polymorphism is ignored in most methods. The argument for this simplification is that beneficial mutations should make a negligible contribution to patterns of polymorphism because they are rare and tend to sweep rapidly through the population. On the other hand, beneficial mutations are expected to significantly boost the amount of nonsynonymous divergence (Fig.3). Accordingly, several methods use divergence data in combination with SFS data to estimate the fraction of nonsynonymous divergence that is driven by beneficial mutations.56–58 A closer inspection of Figure3 confirms the intuition that beneficial mutations are expected to make a large contribution to nonsynonymous divergence (Dn), but also suggests that the intuition that the contribution of beneficial mutation to polymorphism is negligible may be flawed: a single beneficial mutation is actually expected to contribute comparatively more to amounts of polymorphism (Pn) than a neutral or a deleterious one!
Empirical DFE inferred from population genomics data
The methods for estimation of the scaled DFE from this type of data differ slightly by (1) the nature of demographic assumptions underlying the likelihood calculations; (2) whether diffusion or an exact matrix version of the Wright–Fisher model is used to compute theoretical expectations and, in turn, the likelihood of SFS data; (3) the underlying distribution used to model the scaled DFE; and (4) whether only polymorphism data are considered (via SFS counts) or divergence data are also analyzed.
Table3 contains empirical estimates of scaled DFE obtained from these types of data. Comparison of the distributions inferred from these studies is not always straightforward, as different methods can assume quite different parametric distributions to model the underlying DFE. One of the easiest ways to make more meaningful comparisons across studies is to discretize the type of distribution used in broad categories of S values. Commonly used categories are the effectively neutral mutations (–1 < S < 0), the slightly deleterious mutations (–10 < S < –1), and the strongly deleterious ones (S < –10). The rationale for the number of categories is rather arbitrary,59 but the choice of boundaries are based on the fact that deleterious mutations with S > 100 will make a negligible contribution to polymorphism unless a very large number of individuals (n > 1000) are resequenced.60 Moreover, one might be interested in the proportion of mutations with S around 1, as this class of mutation might be impossible to select out and yet might be damaging to the mean fitness of populations.9
Table 3.
Summary of studies inferring the distribution of scaled fitness effects, Ns, of nonsynonymous mutations
| Organism | Method/dem model | –1 < Ns < 0 | –10 < Ns < 1 | –10 < Ns | Distribution(s) fitted | References |
|---|---|---|---|---|---|---|
| Human | Diffusion + complex demography | 0.27 | 0.30 | 0.43 | Mix of normal exponential/neutral | 57 |
| Human | EWK2009 | 0.35 | 0.09 | 0.56 | Γ | 56 |
| Mus musculus castaneus | K&K | 0.19 | 0 | 0.81 | LN, Γ, β, Spikes | 59 |
| Pan troglodytes | EWK2009 | 0.09 | 0.06 | 0.74 | Γ | 76 |
| D. melanogaster | EWK2009 | 0.06 | 0.07 | 0.87 | Γ | 56 |
| Saccharomyces cerevisae | 0.25 | 0.25 | 0.5 | Γ | 63 | |
| S. paradoxus | 0.2 | 0.2 | 0.6 | |||
| Angiosperms | EWK2009 | 0.1–0.35 | 0.05–0.15 | 0.7–0.8 | Γ | 77 |
| Medicago truncatula | EWK2009 | 20–35 | 12–15 | 50–65 | Γ | 78 |
EWK200956: diffusion based, simple demographic model fitted featuring a possible step change from population size N1 to population size N2 at some time t in the past (N1, N2, and t become “nuisance parameters” estimated alongside DFE and the fraction of favorable mutations).
K&K: discrete W–F matrix based, demographic model identical to EWK2009.
Dem, demographic; LN, log normal; spikes, spikes at different Ns class values.
The observed differences among the species studied so far are not easy to parse into differences, owing to the broad demographics of the species (affecting, in turn, the underlying effective size and efficacy of natural selection) versus genuine differences in their DFE (i.e., differences in s among mutations). However, the most striking difference lies in the proportion of mutations in the effectively neutral range (–1 < S < 0), which varies fivefold depending on the species examined (i.e., barely 6% in Drosophila versus over 30% in most studies of human populations). Curiously, species believed to evolve at fairly large population size, such as yeast, still exhibit a fairly large proportion of effectively neutral mutations; as discussed above, at this point it is not clear whether these differences reflect overall demographics or the existence of a class of mutations with very small fitness effects.
Another challenge for this type of method is to reliably estimate the scaled DFE in the presence of potentially complicated demographics. One current effort pursues the development of methods that can accommodate more complicated demographic scenarios, but a fruitful direction might also be to develop methods that are more robust with respect to underlying demographic assumptions. In this respect, methods that seek to correct for the effects of demographics on SFS counts, rather than estimating a specific demographic scenario,61 might be the way forward (see also Ref. 62 for a review on interaction of selection and demographics).
As genome sequence data becomes increasingly available, more rigorous comparative approaches can be used to analyze data of polymorphism and divergence from numerous pairs of fairly recently diverged species. Assuming identical DFE for both species, but possibly different population size histories, might lead to more reliable inference of DFE (Elyashiv et al.63 are explicitly doing so). This approach also rests on the assumption that DFE tend to be well conserved over evolutionary time; however, direct insights into DFE obtained through recent experimental evolution studies seem to challenge this assumption and show that the current level of adaptation is a factor strongly determining the DFE of new mutations.64–66
Conclusions
What can we say about the DFE of new mutations? For the DFE of beneficial mutations, experimentally inferred distributions seem to support theory for the most part. When the wild-type genotype is close to a fitness optimum, experiments uncover distributions that fit with EVT predictions of the generalized Pareto distribution. Distributions with shapes ranging from close to exponential to uniform are recovered. There is variation between studies, but estimates consistently suggest shape parameters in the Weibull domain (Fig.2), although some cases yield distributions that are difficult to distinguish from a strict exponential.
Some of this variation is likely statistical noise inherent to the use of a very small number of data points (typically less than 15) to distinguish between sometimes quite similar distributions. However, variation in the DFE of beneficial mutations is also predicted in fitness landscape models when the number of character dimensions are varied, with a right-truncated DFE of beneficial mutations predicted when the number of character dimensions is low, only converging toward an exponential DFE of beneficial mutations when the number of character dimensions is large.33,67 Interestingly, the most extreme examples of right-truncated DFE of beneficial mutations have been recovered in viruses,34 arguably less complex organisms than bacteria, where more exponential-like DFE tend to be recovered.27 Recent tentative estimates for the complexity of bacterial genomes, operationally measured by inferring the number of independent traits underlying fitness, are rather low: likely 10 or fewer.30,47 Note, however, that these estimates of complexity are obtained under the strong assumption that these mutations are fully pleiotropic.
For wild-type genotypes initially residing farther from the optimum, experimentally characterized DFE of beneficial mutations tend to be peaked (Fig.1), no longer conforming with the EVT predictions but still fitting with the general predictions of fitness-landscape models. A few experiments have started to give us an idea of how DFE change as populations move closer to, or further from, a fitness optimum, and in some cases even show the transition from a peaked to an EVT tail DFE.29 However, predicting distance from the optimum a priori is impossible without an understanding of the underlying fitness landscape—something that is notoriously difficult to characterize.
The conventional assumption in comparative genomics, starting with the neutral theory of molecular evolution championed by Kimura,13 is that populations are very close to their fitness optimum, and so beneficial mutations are exceedingly rare and can safely be ignored. Thus, in most cases, assumptions of the models used do not allow for beneficial fitness effects to be estimated at all (but see Ref. 68 for an exception). However, beneficial mutations are not so rare that they cannot be detected when looked for in evolution experiments, and depending on the particular selection environment, beneficial mutations can even be quite numerous.31 It could be argued that these data represent the DFE of extremely maladapted populations, important only in the artificial environment of the lab. However, even if these experiments do represent DFE at the extremes, understanding the DFE of beneficial mutations in maladapted populations is of direct importance for at least two applied evolutionary problems. The first is that of antibiotic resistance in microbes. The presence of antibiotics throws populations far off their fitness optimum, and so predicting how pathogens evolve in the presence of antibiotics requires an understanding of the DFE and resulting dynamics of populations in extremely stressful environments. Another potential application is in understanding the evolutionary dynamics of populations at risk of extinction. Populations at risk may decline to census sizes so low that many deleterious mutations can be no longer be filtered out by selection. Models of this process, called mutational meltdown, tend to deal only with deleterious mutations. However, data from experimental evolution and fitness landscape models suggest that the farther these populations move from their fitness optima, the greater the number of potential beneficial mutations—also termed compensatory mutations—and the greater the fitness effects of those mutations. Poon and Otto69 show that incorporating beneficial mutations when modeling this process can change the predicted outcome and suggest that beneficial mutations, while still rare compared to deleterious mutations, can have important effects on evolution even in small populations and, thus, should not be ignored.
Experimental evolution has allowed for the examination of the DFE of beneficial mutations in a number of microbes; however, it is still impossible to characterize the DFE of beneficial mutations in this way in eukaryotes. On the other hand, estimates of mutation rate and the mean effect size of beneficial mutations are parameters that can potentially be extracted from polymorphism data. With these parameters, one can calculate the expected waiting time for new mutations (assuming the distribution is close to exponential). Predictions of evolutionary rescue models depend on these parameters, and so these kinds of estimates may be important in predicting a species’ ability to adapt to climate shifts and other human-induced environmental changes (see Ref. 70 for a lucid and quantitative account of this process). In a similar way, these same parameters will also be crucial for modeling the evolution of antibiotic resistance and host shifts in pathogens.
As one broadens the focus from beneficial mutations to the DFE of all mutations, experimental evolution and genome polymorphism data do not always match as well with current theoretical models. For the genotype–phenotype mapping that is typically used in mutational landscape models, the prediction is that the DFE of mutations is Γ distributed with a shift that depends on the current distance to the fitness optima (Fig.1). Although some of the data appear to be adequately described by Γ distributions, other are clearly bimodal and complex.37,59 Thus, while many techniques for inferring the DFE in experimental evolution and genomics analysis assume that the DFE is Γ distributed, discrepancies in these results suggest that this is not always appropriate (as discussed in Ref. 42).
It would be nice to also compare predicted DFE inferred using the two very different approaches discussed in this review; however, direct comparisons of the DFE of mutations inferred by experimental evolution methods and genome polymorphism data are currently very difficult. This is due to an inability to distinguish between DFE shape differences due to selection versus demography in the polymorphism data (as discussed earlier). It is also difficult to know if a comparison is appropriate because of the potentially large differences in the type of selective environments driving adaptation in these two types of data. In evolution experiments, the environment used for natural selection to operate tends to be fixed and is usually relatively simple, while the observed polymorphism data are likely the result of much more complex and potentially fluctuating environments. It is difficult to know how these potential complexities have affected the DFE that is inferred from population genomics data, and accounting for this may be important. A model by Huerta-Sanchez et al.71 explores how temporal fluctuation in selection regimes can affect patterns in SFS data, but this approach has not yet been turned into a practical inference method.
One general conclusion arising from a comparison of DFE inferred from all types of data is that there is a great deal of variation in observed DFE shapes. A factor that seems to have an overwhelming effect is the distance from the optimum (current level of maladaptation). Genetic background is another factor that may play an important role through organism complexity, variation in the amount of pleiotropy, and epistasis. Advances in the implementation of high-throughput methods in both experimental evolution and sequencing now allow for the thorough characterization of the DFE of mutations across a wide range of organisms and environments, allowing for direct experimental tests of potential mechanisms driving observed differences in DFE. In addition, the rapidly growing abundance of genome sequence data, now available for an ever-widening range of species, will allow for better identification of any general patterns in the characteristics of arising mutations and their fitness effects. Future work should be focused on understanding what drives the observed variation. Mutational-landscape models make explicit predictions regarding a number of factors that could drive variation in DFE and, thus, offer an important guide on this front. In that regard, two particular factors that have been overlooked for interpreting data are the roles of partial pleiotropy and heterogeneity in the environment. Fitness-landscape models incorporating partial pleiotropy have been formulated but have not yet been used for inference. The effect of heterogeneity in the environment on DFE has largely been unexplored and there is a need to extend both theory and experiment in this area.
Acknowledgments
SB and TB acknowledge financial support from the ERC Grant ADAPT (Grant number 311341).
Conflicts of interest
The authors declare no conflicts of interest.
References
- 1.Chevin L-M, Martin G. Lenormand T. Fisher's model and the genomics of adaptation: restricted pleiotropy, heterogeneous mutation, and parallel evolution. Evolution. 2010;64:3213–3231. doi: 10.1111/j.1558-5646.2010.01058.x. [DOI] [PubMed] [Google Scholar]
- 2.Chevin L-M, Lande R. Mace GM. Adaptation, plasticity, and extinction in a changing environment: towards a predictive theory. PLoS Biol. 2010;8:e1000357. doi: 10.1371/journal.pbio.1000357. [DOI] [PMC free article] [PubMed] [Google Scholar]
- 3.Hoffmann AA. Sgrò CM. Climate change and evolutionary adaptation. Nature. 2011;470:479–485. doi: 10.1038/nature09670. [DOI] [PubMed] [Google Scholar]
- 4.Otto SP. Lenormand T. Resolving the paradox of sex and recombination. Nat. Rev. Genet. 2002;3:252–261. doi: 10.1038/nrg761. [DOI] [PubMed] [Google Scholar]
- 5.Hill WG. Understanding and using quantitative genetic variation. Philos. Trans. R. Soc. Lond. B Biol. Sci. 2010;365:73–85. doi: 10.1098/rstb.2009.0203. [DOI] [PMC free article] [PubMed] [Google Scholar]
- 6.Bataillon T. Estimation of spontaneous genome-wide mutation rate parameters: whither beneficial mutations? Heredity. 2000;84:497–501. doi: 10.1046/j.1365-2540.2000.00727.x. [DOI] [PubMed] [Google Scholar]
- 7.Orr HA. The population genetics of beneficial mutations. Philos. Trans. R. Soc. Lond. B Biol. Sci. 2010;365:1195–1201. doi: 10.1098/rstb.2009.0282. [DOI] [PMC free article] [PubMed] [Google Scholar]
- 8.Walsh B. Blows MW. Abundant genetic variation + strong selection = multivariate genetic constraints: a geometric view of adaptation. Annu. Rev. Ecol. Evol. Syst. 2009;40:41–59. [Google Scholar]
- 9.Lande R. Risk of population extinction from fixation of deleterious and reverse mutations. Genetica. 1998;102:21–27. [PubMed] [Google Scholar]
- 10.Beisel CJ, Rokyta DR, Wichman HA. Joyce P. Testing the extreme value domain of attraction for distributions of beneficial fitness effects. Genetics. 2007;176:2441–2449. doi: 10.1534/genetics.106.068585. [DOI] [PMC free article] [PubMed] [Google Scholar]
- 11.Joyce P, Rokyta DR, Beisel CJ. Orr HA. A general extreme value theory model for the adaptation of DNA sequences under strong selection and weak mutation. Genetics. 2008;180:1627–1643. doi: 10.1534/genetics.108.088716. [DOI] [PMC free article] [PubMed] [Google Scholar]
- 12.Fisher RA. The Genetical Theory of Natural Selection. Clarendon: Oxford; 1930. [Google Scholar]
- 13.Kimura M. The Neutral Theory of Molecular Evolution. Cambridge, U.K: Cambridge University Press; 1984. [Google Scholar]
- 14.Martin G. Lenormand T. A general multivariate extension of Fisher's geometrical model and the distribution of mutation fitness effects across species. Evolution. 2006;60:893–907. [PubMed] [Google Scholar]
- 15.Gros P-A, Le Nagard H. Tenaillon O. The evolution of epistasis and its links with genetic robustness, complexity and drift in a phenotypic model of adaptation. Genetics. 2009;182:277–293. doi: 10.1534/genetics.108.099127. [DOI] [PMC free article] [PubMed] [Google Scholar]
- 16.Lourenço J, Galtier N. Glémin S. Complexity, pleiotropy, and the fitness effect of mutations. Evolution. 2011;65:1559–1571. doi: 10.1111/j.1558-5646.2011.01237.x. [DOI] [PubMed] [Google Scholar]
- 17.Tenaillon O, Silander OK, Uzan J-P. Chao L. Quantifying organismal complexity using a population genetic approach. PLoS One. 2007;2:e217. doi: 10.1371/journal.pone.0000217. [DOI] [PMC free article] [PubMed] [Google Scholar]
- 18.Martin G, Elena SF. Lenormand T. Distributions of epistasis in microbes fit predictions from a fitness landscape model. Nat. Genet. 2007;39:555–560. doi: 10.1038/ng1998. [DOI] [PubMed] [Google Scholar]
- 19.Orr HA. Fitness and its role in evolutionary genetics. Nat. Rev. Genet. 2009;10:531–539. doi: 10.1038/nrg2603. [DOI] [PMC free article] [PubMed] [Google Scholar]
- 20.Charlesworth B, Borthwick H, Bartolomé C. Pignatelli P. Estimates of the genomic mutation rate for detrimental alleles in Drosophila melanogaster. Genetics. 2004;167:815–826. doi: 10.1534/genetics.103.025262. [DOI] [PMC free article] [PubMed] [Google Scholar]
- 21.Azevedo RB, Keightley PD, Laurén-Määttä C, et al. Spontaneous mutational variation for body size in Caenorhabditis elegans. Genetics. 2002;162:755–765. doi: 10.1093/genetics/162.2.755. [DOI] [PMC free article] [PubMed] [Google Scholar]
- 22.MacLean R, Perron GG. Gardner A. Diminishing returns from beneficial mutations and pervasive epistasis shape the fitness landscape for rifampicin resistance in Pseudomonas aeruginosa. Genetics. 2010;186:1345–1354. doi: 10.1534/genetics.110.123083. [DOI] [PMC free article] [PubMed] [Google Scholar]
- 23.Elena SF, Ekunwe L, Hajela N, et al. Distribution of fitness effects caused by random insertion mutations in Escherichia coli. Genetica. 1998;102/103:349–358. [PubMed] [Google Scholar]
- 24.Bell G. Experimental genomics of fitness in yeast. Proc. R. Soc. B. Biol. Sci. 2010;277:1459–1467. doi: 10.1098/rspb.2009.2099. [DOI] [PMC free article] [PubMed] [Google Scholar]
- 25.Chevin L-M. On measuring selection in experimental evolution. Biol. Lett. 2011;7:210–213. doi: 10.1098/rsbl.2010.0580. [DOI] [PMC free article] [PubMed] [Google Scholar]
- 26.Luria SE. Delbrück M. Mutations of bacteria from virus sensitivity to virus resistance. Genetics. 1943;28:491. doi: 10.1093/genetics/28.6.491. [DOI] [PMC free article] [PubMed] [Google Scholar]
- 27.Kassen R. Bataillon T. Distribution of fitness effects among beneficial mutations before selection in experimental populations of bacteria. Nat. Genet. 2006;38:484–488. doi: 10.1038/ng1751. [DOI] [PubMed] [Google Scholar]
- 28.Rosche WA. Foster PL. Determining mutation rates in bacterial populations. Methods. 2000;20:4–17. doi: 10.1006/meth.1999.0901. [DOI] [PMC free article] [PubMed] [Google Scholar]
- 29.MacLean RC. Buckling A. The distribution of fitness effects of beneficial mutations in Pseudomonas aeruginosa. PLoS Genet. 2009;5:e1000406. doi: 10.1371/journal.pgen.1000406. [DOI] [PMC free article] [PubMed] [Google Scholar]
- 30.Bataillon T, Zhang T. Kassen R. Cost of adaptation and fitness effects of beneficial mutations in Pseudomonas fluorescens. Genetics. 2011;189:939–949. doi: 10.1534/genetics.111.130468. [DOI] [PMC free article] [PubMed] [Google Scholar]
- 31.McDonald MJ, Cooper TF, Beaumont HJ. Rainey PB. The distribution of fitness effects of new beneficial mutations in Pseudomonas fluorescens. Biol. Lett. 2011;7:98–100. doi: 10.1098/rsbl.2010.0547. [DOI] [PMC free article] [PubMed] [Google Scholar]
- 32.Drake JW, Charlesworth B, Charlesworth D. Crow JF. Rates of spontaneous mutation. Genetics. 1998;148:1667–1686. doi: 10.1093/genetics/148.4.1667. [DOI] [PMC free article] [PubMed] [Google Scholar]
- 33.Martin G. Lenormand T. The distribution of beneficial and fixed mutation fitness effects close to an optimum. Genetics. 2008;179:907–916. doi: 10.1534/genetics.108.087122. [DOI] [PMC free article] [PubMed] [Google Scholar]
- 34.Rokyta DR, Beisel CJ, Joyce P, et al. Beneficial fitness effects are not exponential for two viruses. J. Mol. Evol. 2008;67:368–376. doi: 10.1007/s00239-008-9153-x. [DOI] [PMC free article] [PubMed] [Google Scholar]
- 35.Sanjuán R, Moya A. Elena SF. The distribution of fitness effects caused by single-nucleotide substitutions in an RNA virus. Proc. Natl. Acad. Sci. U. S. A. 2004;101:8396–8401. doi: 10.1073/pnas.0400146101. [DOI] [PMC free article] [PubMed] [Google Scholar]
- 36.Lind PA, Berg OG. Andersson DI. Mutational robustness of ribosomal protein genes. Science. 2010;330:825–827. doi: 10.1126/science.1194617. [DOI] [PubMed] [Google Scholar]
- 37.Hietpas RT, Jensen JD. Bolon DN. Experimental illumination of a fitness landscape. Proc. Natl. Acad. Sci. 2011;108:7896–7901. doi: 10.1073/pnas.1016024108. [DOI] [PMC free article] [PubMed] [Google Scholar]
- 38.Carrasco P, de la Iglesia F. Elena SF. Distribution of fitness and virulence effects caused by single-nucleotide substitutions in tobacco etch virus. J. Virol. 2007;81:12979–12984. doi: 10.1128/JVI.00524-07. [DOI] [PMC free article] [PubMed] [Google Scholar]
- 39.Jacquier H, Birgy A, Le Nagard H, et al. Capturing the mutational landscape of the beta-lactamase TEM-1. Proc. Natl. Acad. Sci. 2013;110:13067–13072. doi: 10.1073/pnas.1215206110. [DOI] [PMC free article] [PubMed] [Google Scholar]
- 40.Muller H. The measurement of gene mutation rate in Drosophila, its high variability, and its dependence upon temperature. Genetics. 1928;13:279. doi: 10.1093/genetics/13.4.279. [DOI] [PMC free article] [PubMed] [Google Scholar]
- 41.Mukai T. The genetic structure of natural populations of Drosophila melanogaster. I. Spontaneous mutation rate of polygenes controlling viability. Genetics. 1964;50:1. doi: 10.1093/genetics/50.1.1. [DOI] [PMC free article] [PubMed] [Google Scholar]
- 42.Halligan DL. Keightley PD. Spontaneous mutation accumulation studies in evolutionary genetics. Annu. Rev. Ecol. Evol. Syst. 2009;40:151–172. [Google Scholar]
- 43.Estes S, Phillips PC, Denver DR, et al. Mutation accumulation in populations of varying size: the distribution of mutational effects for fitness correlates in Caenorhabditis elegans. Genetics. 2004;166:1269–1279. doi: 10.1534/genetics.166.3.1269. [DOI] [PMC free article] [PubMed] [Google Scholar]
- 44.Rozen DE, De Visser J. Gerrish PJ. Fitness effects of fixed beneficial mutations in microbial populations. Curr. Biol. 2002;12:1040–1045. doi: 10.1016/s0960-9822(02)00896-5. [DOI] [PubMed] [Google Scholar]
- 45.Sousa A, Magalhães S. Gordo I. Cost of antibiotic resistance and the geometry of adaptation. Mol. Biol. Evol. 2012;29:1417–1428. doi: 10.1093/molbev/msr302. [DOI] [PMC free article] [PubMed] [Google Scholar]
- 46.Hegreness M, Shoresh N, Hartl D. Kishony R. An equivalence principle for the incorporation of favorable mutations in asexual populations. Science. 2006;311:1615–1617. doi: 10.1126/science.1122469. [DOI] [PubMed] [Google Scholar]
- 47.Perfeito L, Sousa A, Bataillon T. Gordo I. Rates of fitness decline and rebound suggest pervasive epistasis. Evolution. 2014;68:150–162. doi: 10.1111/evo.12234. [DOI] [PMC free article] [PubMed] [Google Scholar]
- 48.de Sousa JAM, Campos PR. Gordo I. An ABC method for estimating the rate and distribution of effects of beneficial mutations. Genome Biol. Evol. 2013;5:794–806. doi: 10.1093/gbe/evt045. [DOI] [PMC free article] [PubMed] [Google Scholar]
- 49.Sella G, Petrov DA, Przeworski M. Andolfatto P. Pervasive natural selection in the Drosophila genome? PLoS Genet. 2009;5:e1000495. doi: 10.1371/journal.pgen.1000495. [DOI] [PMC free article] [PubMed] [Google Scholar]
- 50.Stephan W. Genetic hitchhiking versus background selection: the controversy and its implications. Philos. Trans. R. Soc. Lond. B Biol. Sci. 2010;365:1245–1253. doi: 10.1098/rstb.2009.0278. [DOI] [PMC free article] [PubMed] [Google Scholar]
- 51.Olson-Manning CF, Wagner MR. Mitchell-Olds T. Adaptive evolution: evaluating empirical support for theoretical predictions. Nat. Rev. Genet. 2012;13:867–877. doi: 10.1038/nrg3322. [DOI] [PMC free article] [PubMed] [Google Scholar]
- 52.Leffler EM, Bullaughey K, Matute DR, et al. Revisiting an old riddle: what determines genetic diversity levels within species? PLoS Biol. 2012;10:e1001388. doi: 10.1371/journal.pbio.1001388. [DOI] [PMC free article] [PubMed] [Google Scholar]
- 53.Gayral P, Melo-Ferreira J, Glémin S, et al. Reference-free population genomics from next-generation transcriptome data and the vertebrate–invertebrate gap. PLoS Genet. 2013;9:e1003457. doi: 10.1371/journal.pgen.1003457. [DOI] [PMC free article] [PubMed] [Google Scholar]
- 54.Charlesworth B. Effective population size and patterns of molecular evolution and variation. Nat. Rev. Genet. 2009;10:195–205. doi: 10.1038/nrg2526. [DOI] [PubMed] [Google Scholar]
- 55.Lawrie DS, Messer PW, Hershberg R. Petrov DA. Strong purifying selection at synonymous sites in D. melanogaster. PLoS Genet. 2013;9:e1003527. doi: 10.1371/journal.pgen.1003527. [DOI] [PMC free article] [PubMed] [Google Scholar]
- 56.Eyre-Walker A. Keightley PD. Estimating the rate of adaptive molecular evolution in the presence of slightly deleterious mutations and population size change. Mol. Biol. Evol. 2009;26:2097–2108. doi: 10.1093/molbev/msp119. [DOI] [PubMed] [Google Scholar]
- 57.Boyko AR, Williamson SH, Indap AR, et al. Assessing the evolutionary impact of amino acid mutations in the human genome. PLoS Genet. 2008;4:e1000083. doi: 10.1371/journal.pgen.1000083. [DOI] [PMC free article] [PubMed] [Google Scholar]
- 58.Wilson DJ, Hernandez RD, Andolfatto P. Przeworski M. A population genetics-phylogenetics approach to inferring natural selection in coding sequences. PLoS Genet. 2011;7:e1002395. doi: 10.1371/journal.pgen.1002395. [DOI] [PMC free article] [PubMed] [Google Scholar]
- 59.Kousathanas A. Keightley PD. A comparison of models to infer the distribution of fitness effects of new mutations. Genetics. 2013;193:1197–1208. doi: 10.1534/genetics.112.148023. [DOI] [PMC free article] [PubMed] [Google Scholar]
- 60.Messer PW. Measuring the rates of spontaneous mutation from deep and large-scale polymorphism data. Genetics. 2009;182:1219–1232. doi: 10.1534/genetics.109.105692. [DOI] [PMC free article] [PubMed] [Google Scholar]
- 61.Eyre-Walker A, Woolfit M. Phelps T. The distribution of fitness effects of new deleterious amino acid mutations in humans. Genetics. 2006;173:891–900. doi: 10.1534/genetics.106.057570. [DOI] [PMC free article] [PubMed] [Google Scholar]
- 62.Li J, Li H, Jakobsson M, et al. Joint analysis of demography and selection in population genetics: where do we stand and where could we go? Mol. Ecol. 2012;21:28–44. doi: 10.1111/j.1365-294X.2011.05308.x. [DOI] [PubMed] [Google Scholar]
- 63.Elyashiv E, Bullaughey K, Sattath S, et al. Shifts in the intensity of purifying selection: an analysis of genome-wide polymorphism data from two closely related yeast species. Genome Res. 2010;20:1558–1573. doi: 10.1101/gr.108993.110. [DOI] [PMC free article] [PubMed] [Google Scholar]
- 64.Perfeito Li, Fernandes L, Mota C. Gordo I. Adaptive mutations in bacteria: high rate and small effects. Science. 2007;317:813–815. doi: 10.1126/science.1142284. [DOI] [PubMed] [Google Scholar]
- 65.Schoustra SE, Bataillon T, Gifford DR. Kassen R. The properties of adaptive walks in evolving populations of fungus. PLoS Biol. 2009;7:e1000250. doi: 10.1371/journal.pbio.1000250. [DOI] [PMC free article] [PubMed] [Google Scholar]
- 66.Gifford DR, Schoustra SE. Kassen R. The length of adaptive walks is insensitive to starting fitness in Aspergillus nidulans. Evolution. 2011;65:3070–3078. doi: 10.1111/j.1558-5646.2011.01380.x. [DOI] [PubMed] [Google Scholar]
- 67.Orr HA. The distribution of fitness effects among beneficial mutations in Fisher's geometric model of adaptation. J. Theor. Biol. 2006;238:279–285. doi: 10.1016/j.jtbi.2005.05.001. [DOI] [PubMed] [Google Scholar]
- 68.Schneider A, Charlesworth B, Eyre-Walker A. Keightley PD. A method for inferring the rate of occurrence and fitness effects of advantageous mutations. Genetics. 2011;189:1427–1437. doi: 10.1534/genetics.111.131730. [DOI] [PMC free article] [PubMed] [Google Scholar]
- 69.Poon A. Otto SP. Compensating for our load of mutations: freezing the meltdown of small populations. Evolution. 2000;54:1467–1479. doi: 10.1111/j.0014-3820.2000.tb00693.x. [DOI] [PubMed] [Google Scholar]
- 70.Martin G, Aguilée R, Ramsayer J, et al. The probability of evolutionary rescue: towards a quantitative comparison between theory and evolution experiments. Philos. Trans. R. Soc. Lond. B Biol. Sci. 2013;368:20120088. doi: 10.1098/rstb.2012.0088. [DOI] [PMC free article] [PubMed] [Google Scholar]
- 71.Huerta-Sanchez E, Durrett R. Bustamante CD. Population genetics of polymorphism and divergence under fluctuating selection. Genetics. 2008;178:325–337. doi: 10.1534/genetics.107.073361. [DOI] [PMC free article] [PubMed] [Google Scholar]
- 72.Domingo-Calap P, Cuevas JM. Sanjuán R. The fitness effects of random mutations in single-stranded DNA and RNA bacteriophages. PLoS Genet. 2009;5:e1000742. doi: 10.1371/journal.pgen.1000742. [DOI] [PMC free article] [PubMed] [Google Scholar]
- 73.Peris JB, Davis P, Cuevas JM, et al. Distribution of fitness effects caused by single-nucleotide substitutions in bacteriophage f1. Genetics. 2010;185:603–609. doi: 10.1534/genetics.110.115162. [DOI] [PMC free article] [PubMed] [Google Scholar]
- 74.Imhof M. Schlötterer C. Fitness effects of advantageous mutations in evolving Escherichia coli populations. Proc. Natl. Acad. Sci. 2001;98:1113–1117. doi: 10.1073/pnas.98.3.1113. [DOI] [PMC free article] [PubMed] [Google Scholar]
- 75.Barrett RD, MacLean RC. Bell G. Mutations of intermediate effect are responsible for adaptation in evolving Pseudomonas fluorescens populations. Biol. Lett. 2006;2:236–238. doi: 10.1098/rsbl.2006.0439. [DOI] [PMC free article] [PubMed] [Google Scholar]
- 76.Hvilsom C, Qian Y, Bataillon T, et al. Extensive X-linked adaptive evolution in central chimpanzees. Proc. Natl. Acad. Sci. 2012;109:2054–2059. doi: 10.1073/pnas.1106877109. [DOI] [PMC free article] [PubMed] [Google Scholar]
- 77.Gossmann TI, Song B-H, Windsor AJ, et al. Genome wide analyses reveal little evidence for adaptive evolution in many plant species. Mol. Biol. Evol. 2010;27:1822–1832. doi: 10.1093/molbev/msq079. [DOI] [PMC free article] [PubMed] [Google Scholar]
- 78.Loewe L, Charlesworth B, Bartolomé C. Nöel V. Estimating selection on nonsynonymous mutations. Genetics. 2006;172:1079–1092. doi: 10.1534/genetics.105.047217. [DOI] [PMC free article] [PubMed] [Google Scholar]