

Abstract
The exit of a stem cell out of quiescence into an activated state is characterized by major metabolic changes associated with increased biosynthesis of proteins and macromolecules. The regulation of this transition is poorly understood. Using muscle stem cells, or satellite cells (SCs), we found that autophagy, which catabolizes intracellular contents to maintain proteostasis and to produce energy during nutrient deprivation, was induced during SC activation. Inhibition of autophagy suppressed the increase in ATP levels and delayed SC activation, both of which could be partially rescued by exogenous pyruvate as an energy source, suggesting that autophagy may provide nutrients necessary to meet bioenergetic demands during this critical transition from quiescence to activation. We found that SIRT1, a known nutrient sensor, regulates autophagic flux in SC progeny. A deficiency of SIRT1 led to a delay in SC activation that could also be partially rescued by exogenous pyruvate. These studies suggest that autophagy, regulated by SIRT1, may play an important role during SC activation to meet the high bioenergetic demands of the activation process.
Keywords: activation, autophagy, quiescence, satellite cell, SIRT1
See also: AJ Wagers (December 2014)
Introduction
Macroautophagy, hereafter referred to as autophagy, is a homeostatic process with dual functions as a cellular quality control mechanism and a recycling system (Mizushima & Komatsu, 2011; Singh & Cuervo, 2011). Double-membraned structures engulf cytoplasmic components into vesicles called autophagosomes that later fuse with lysosomes to break down their contents from which amino acids and other degradation products may be recycled for protein synthesis or for the tricarboxylic acid (TCA) cycle to generate energy (Ravikumar et al, 2010; Yang & Klionsky, 2010). In this way, autophagy can protect cells against nutrient stress (Mizushima & Komatsu, 2011). Nitrogen-starved yeast, for example, induce autophagy to produce amino acids to maintain viability (Onodera & Ohsumi, 2005). Similarly, lymphocytes subjected to growth factor deprivation that prevents nutrient uptake activate autophagy to survive (Lum et al, 2005). Autophagy can also safeguard against nutrient deprivation at the organismal level, as studies have shown that mice rely on autophagy to survive the neonatal starvation period (Kuma et al, 2004; Komatsu et al, 2005).
More recent studies have demonstrated that autophagy also serves as an adaptive response to many other stressors including intense exercise, ER stress, infection, hypoxia, and oxidative stress (He & Klionsky, 2009; Kroemer et al, 2010; He et al, 2012). For example, autophagy responds to oxidative stress by removing damaged mitochondria (Wen et al, 2013). Furthermore, autophagy can also eliminate intracellular pathogens, such as viruses and bacteria (Yano & Kurata, 2011). Interestingly, autophagy may also facilitate the immune response to infection, as resting T cells in which autophagy is inhibited cannot activate (Hubbard et al, 2010). Blocking autophagy would therefore hinder the ability of a cell to respond to stress.
Stem cells depend on intact autophagic machinery for the maintenance of states, characteristics, and processes that underlie stem cell functions. When autophagy is inhibited, defects in quiescence, differentiation, and self-renewal have been reported (Guan et al, 2013; Phadwal et al, 2013). It has been proposed that long-lived stem cells that rarely divide rely on autophagy to remove damaged proteins and organelles for the maintenance of quiescence (Guan et al, 2013). This is supported by findings that HSCs that accumulate mitochondria and reactive oxygen species fail to maintain quiescence when blocked for autophagy (Liu et al, 2010; Mortensen et al, 2011). Additionally, autophagy can selectively dispose of proteins and organelles that can inhibit normal differentiation and self-renewal of stem cells (Mortensen et al, 2010, 2011; Mizushima & Komatsu, 2011).
While the autophagic removal of damaged or extraneous cellular components has been shown to be necessary for the maintenance and function of stem cells, the contribution of autophagy to the metabolic needs of stem cells has been less well studied. Pathways and molecules that sense and regulate cellular energy status, however, have been well documented to influence stem cell function (Rafalski & Brunet, 2011; Folmes et al, 2012). Manipulations of the mTOR pathway, for example, have been reported to perturb pluripotency, proliferation, differentiation, and self-renewal of stem cells (Murakami et al, 2004; Chen et al, 2008; Sampath et al, 2008; Zhou et al, 2009; Easley et al, 2010). Since downstream targets of these metabolic pathways include components of the autophagic machinery, the significance of the bioenergetic contributions from autophagy in stem cell function has yet to be directly tested.
Stem cells activating out of quiescence to generate proliferating progeny that will differentiate or self-renew encounter different bioenergetic requirements at each juncture (Folmes et al, 2012). One crucial bioenergetic hurdle occurs during activation. Quiescent stem cells, characterized by their low metabolic state and lower mitochondrial content and activity, must meet a high demand for energy, reducing cofactors, and amino acids needed to support cellular growth during activation (Lunt & Vander Heiden, 2011; Hsu & Qu, 2013). It is known that quiescent hematopoietic stem cells (HSCs) generate ATP primarily through glycolysis rather than the more productive oxidative phosphorylation (Mantel et al, 2010; Simsek et al, 2010; Miharada et al, 2011; Suda et al, 2011). The level of ATP production in a quiescent state may be insufficient during stem cell activation and may activate nutrient sensors that mediate cellular metabolic homeostasis. Identifying those mediators would enhance our understanding of the metabolic contribution to the regulation of stem cell activation.
In this report, we studied the role of autophagy in the activation of muscle stem cells, or ‘satellite cells’ (SCs), from the quiescent state into the cell cycle. SCs, which are responsible for the regenerative capacity of skeletal muscle (Brack & Rando, 2012; Yin et al, 2013), exist primarily in the quiescent state until they receive signals to activate in order to begin proliferating. We found that autophagic flux is induced as quiescent SCs (QSCs) activate and proceed to enter the cell cycle and that inhibition of that flux leads to a delay in the activation process. SC activation is associated with a large increase in cellular ATP, an increase that is suppressed when autophagy is inhibited. Both delayed SC activation and suppressed ATP increases by inhibition of autophagy could be partially rescued by providing SCs with an exogenous energy source in the form of the nutrient pyruvate. This suggests the possibility that autophagy may degrade cellular components in order to provide substrates for energy generation during SC activation. Consistent with this hypothesis, we also show that SIRT1, a key nutrient sensor, modulates autophagic flux during SC activation and that knocking out sirt1 in SCs results in a phenotype similar to that observed when autophagy is inhibited. Together, these data suggest a model in which the metabolic demands of SC activation are sensed by SIRT1 which in turn activates the autophagic machinery in order to generate nutrients that are essential for the generation of ATP to support that enormous increase in synthetic activity associated with the activation process.
Results
Autophagic flux is induced during SC activation
To determine whether autophagy is induced in SCs during the process of muscle regeneration, we used LC3-GFP transgenic mice, in which an integral protein in autophagosome formation, LC3, is tagged with GFP (Mizushima et al, 2004). We examined LC3 expression in QSCs in uninjured muscle and in ASCs and SC progeny (i.e., proliferating cell populations derived from activated SCs) between 1.5 and 5 days after the induction of activation by muscle injury. LC3 was not detectable in QSCs but was detectable early during SC activation and remained elevated during the phase of proliferative expansion of SC progeny (Fig 1A). We also analyzed LC3 expression by immunohistochemical analysis with an LC3B antibody in muscles of Pax7CreER/+; ROSAeYFP/+ mice (Srinivas et al, 2001; Nishijo et al, 2009), in which tamoxifen treatment marks SCs with an enhanced yellow fluorescent protein (eYFP) reporter, and confirmed that SCs expressed LC3 by 1.5 days after injury (Supplementary Fig S1A). By 5 days after injury, as self-renewal, characterized as Pax7+/MyoD−, is occurring for many SC progeny that have not already initiated the differentiation process (Wang & Rudnicki, 2012), LC3 was no longer detectable in those cells (Fig 1A; Supplementary Fig S1B). These observations suggest that autophagy is induced in SCs during activation from the quiescent state.
Figure 1. Autophagy is induced during SC activation after muscle injury.

- Immunostaining of cryosections from tibialis anterior (TA) muscles of LC3-GFP mice to detect LC3 expression. Arrows indicate SCs in resting muscle (‘uninjured’; top row) and ASCs and SC progeny in injured muscles 1.5 days (second row) and 2.5 days (third row), respectively, after injury. Arrows and dotted circles indicate self-renewing (i.e., Pax7+/MyoD−) SCs 5 days after injury (bottom row). LC3 is expressed in ASCs and SC progeny but not in quiescent SCs (or in self-renewing SCs). In uninjured fibers, LC3 is expressed at a low, diffuse level that becomes elevated from 2.5 to 5 days after injury. Scale bar: 30 μm.
- Autophagic flux in SCs, ASCs, and SC progeny freshly sorted from uninjured and injured lower hindlimbs of LC3-GFP mice. To test for changes in autophagic flux, QSCs, ASCs, and SC progeny were sorted by FACS to a purity of ˜98% from uninjured muscles and from 1.5 or 2.5 days after injury, respectively. Cells were plated onto chamber slides and treated in vitro with chloroquine (CQ) or control vehicle for 2 h prior to fixing. GFP punctae, indicative of autophagosomes, accumulate upon CQ treatment and reflect autophagic flux. The punctae are indicated by arrows. Scale bar: 16 μm.
- Percentage of SCs with induced autophagic flux (IAF). LC3-GFP punctae were counted from replicate experiments illustrated in (B); those with greater than three punctae are considered to have induced autophagic flux (*P < 0.05; **P < 0.01).
- Western blot analysis of SCs from WT mice. FACS-sorted SCs and ASCs from uninjured muscle or from muscle 1.5 days after injury, respectively, were plated and treated with CQ for 2 h in vitro. Western blots of cell lysates were probed with anti-LC3B and anti-β-actin antibodies.
- Quantification of autophagic flux. The intensities of bands for LC3B-II in three independent Western blot analyses, of which Fig3D is a representative, were first normalized to levels of GAPDH, and then ratios of the intensities of +CQ to –CQ conditions were calculated for each time point (*P < 0.05).
Source data are available online for this figure.
Because QSCs in situ are small and compact with little cytoplasm for the detection of autophagosomes, we confirmed the induction of autophagy by assessing autophagic flux in QSCs from uninjured LC3-GFP mice and in ASCs and SC progeny from injured LC3-GFP mice. We isolated these cells to a purity of ∼98% by fluorescence-activated cell sorting (FACS) (Cheung et al, 2012; Liu et al, 2013) (Supplementary Fig S2). We have demonstrated, based on detailed transcriptional analyses, that this FACS scheme allows us to purify QSCs and ASCs (Liu et al, 2013). We treated both QSCs and ASCs in vitro with an inhibitor of autophagy, chloroquine (CQ), for 2 h to allow the accumulation of autophagosomes that appear as GFP+ punctae (Mizushima et al, 2010). QSCs showed no detectable autophagic flux (only diffuse LC3 expression), whereas more than half of the ASCs showed an induction of autophagic flux within 1.5 days after injury (Fig1B and C). That proportion increased to more than 80% in SC progeny by 2.5 days after injury (Fig1C). Moreover, ASCs from wild-type (WT) mice showed an increase in the lipidated, membrane-bound form of LC3b, LC3b-II, in response to CQ treatment (Fig1D and E). These data demonstrate that autophagic flux increases during SC activation in vivo.
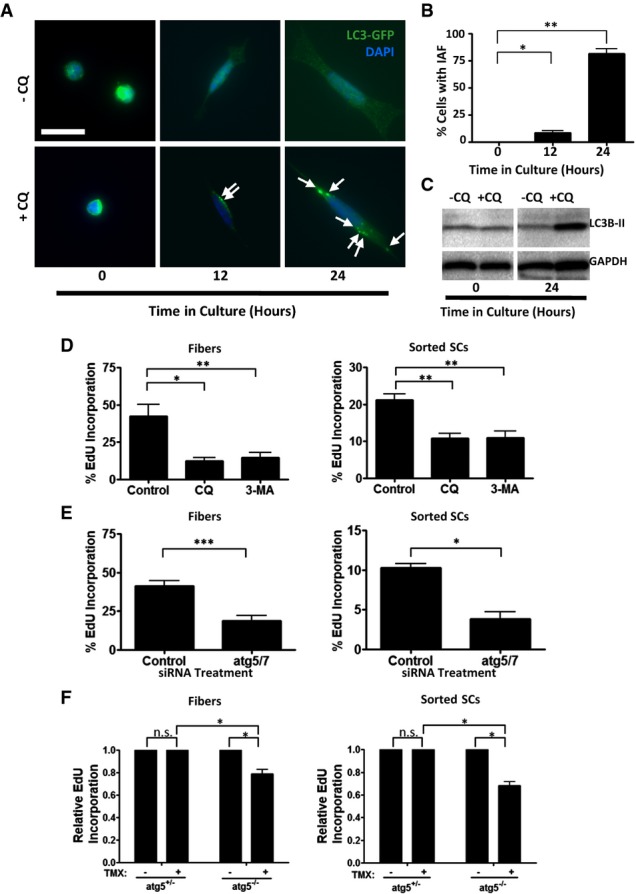
We found further evidence for induction of autophagy during SC activation by examining fiber-associated SCs in fiber explants ex vivo (Brack et al, 2007; Boutet et al, 2012). Single muscle fibers were isolated from LC3-GFP mice and allowed to activate in culture over the course of 48 h in the presence of EdU, which we use to identify the final stage of SC activation during which they enter the cell cycle. We assessed autophagic flux at 12-h intervals by treating fibers for 2 h with CQ prior to fixation. Autophagic flux was not detected in SCs during the first 12 h in culture with CQ treatment (Supplementary Fig S3A). Within the next 12 h, as ASCs were just beginning to enter the cell cycle (Supplementary Fig S3B), an increase in autophagic flux could already be detected in just over 5% of the SCs (Fig2A–C). That percentage dramatically increased to > 80% over the following 24 h (Fig2C). Notably, autophagy was induced in ASCs that had not initiated DNA synthesis and hence had not entered the cell cycle; only about two-thirds of the ASCs with induced autophagy after 36 h were EdU positive (Fig2C). These data confirm that autophagy is induced early during SC activation, prior to the initiation of DNA synthesis.
Figure 2. Autophagy is induced in fiber-associated SCs during ex vivo activation.

- Immunostaining and EdU detection of single fibers from LC3-GFP mice cultured in the presence of EdU for up to 48 h. Parallel cultures were assessed at 12-h intervals between 24 and 48 h and were treated with CQ for 2 h prior to fixing. Arrows indicate LC3-GFP punctae. Scale bar: 5 μm.
- Higher resolution images of CQ-treated fiber-associated SCs acquired at 63× magnification. Arrows indicate LC3-GFP punctae. Scale bar: 5 μm.
- Percentage of fiber-associated SCs with induced autophagic flux (IAF). A cell exhibiting IAF was defined as one having greater than three GFP punctae after CQ treatment. The percentage of cells with IAF was calculated and categorized according to EdU incorporation status (i.e., EdU+ or EdU−) at each time point (*P < 0.05; ***P < 0.001).
Inhibition of autophagy leads to a delay in SC activation
To determine the functional significance of the increase in autophagic flux during SC activation, we tested the effect of inhibiting autophagy during ex vivo activation of fiber-associated SCs and in vitro activation of QSCs. Autophagic flux increases in isolated QSCs just as it does during ex vivo activation of fiber-associated SCs (Fig 3A–C; Supplementary Fig S4A and B). Administration of CQ or 3-methyladenine (3-MA), chemical inhibitors at two different stages of the autophagic process (Klionsky et al, 2008; Mizushima et al, 2010), inhibited SC activation, measured as a reduction of the number of SCs entering the cell cycle, in fiber-associated SCs ex vivo and sorted SCs in vitro from WT mice (Fig 3D). In addition, we blocked autophagy more specifically with siRNAs against atg5 and atg7, essential genes of the autophagic pathway (Kuma et al, 2004; Komatsu et al, 2005). We confirmed that this led to a reduction in transcript levels for these two genes (Supplementary Fig S5A), a lower autophagic flux (Supplementary Fig S5B), and an inhibition of SC activation (Fig 3E). To rule out the possibility that inhibition of autophagy either by pharmacological or siRNA treatment caused irreversible cell cycle arrest, we cultured the SCs for an additional 12 h after inhibitor or siRNA treatment and found that the cumulative measure of cell cycle entry was not significantly affected (Supplementary Fig S5C). This indicates that the inhibition of SC activation observed at 24 h was not due to a permanent cell cycle arrest but rather to a delay in activation. We also confirmed with anti-active-caspase-3 staining that atg5/7 siRNA-transfected SCs were not prone to cell death (Supplementary Fig S5D). To further confirm the results of delayed activation due to pharmacologic or siRNA inhibition of autophagy, we genetically knocked out atg5 in SCs using a mouse transgenic for a SC-specific, tamoxifen-inducible CreER allele and homozygous for floxed atg5 alleles (Hara et al, 2006; Nishijo et al, 2009). Because autophagy may have an additional role in clearing damaged proteins and organelles in long-lived quiescent stem cells (Guan et al, 2013), we performed an acute knockout of atg5 to observe only the short-term effects of inhibiting autophagy during SC activation. We first confirmed that recombination in the atg5 locus had occurred (Supplementary Fig S5E). Similar to pharmacologic inhibition of autophagy and by atg5 and atg7 siRNA transfection, acute genetic deletion of atg5 likewise led to a delay in DNA synthesis in fiber-associated SCs and sorted SCs (Fig3F). We conclude from these data that the increase in autophagic flux is essential for normal activation kinetics of quiescent SCs.
Figure 3. Blocking autophagy inhibits SC activation.
- Induced autophagy in in vitro-activated SCs. QSCs were FACS-sorted from uninjured LC3-GFP mice and cultured for 24 h. The cultures were treated with CQ for 2 h at 12-h time points prior to fixing. Arrows indicate LC3-GFP punctae. Scale bar: 16 μm.
- Percentage of SCs with IAF. LC3-GFP punctae were counted in SCs from replicate experiments as illustrated in (A); those with greater than three punctae were considered to have induced autophagy (*P < 0.05; ***P < 0.001).
- Western blot analysis of QSCs and in vitro-activated SCs. Sorted QSCs were plated and treated in vitro with CQ for 2 h after 0 or 24 h (at which point they are ASCs) in culture. The Western blot was probed with anti-LC3B and anti-GAPDH antibodies.
- Inhibition of SC activation by pharmacological inhibition of autophagy. Freshly isolated single fibers (left) or FACS-sorted QSCs (right) were cultured for 24 h in the presence of EdU and treated with CQ or 3-MA for 8 h prior to fixing. The percentage of cells positive for EdU was assessed. Control cultures were treated with no autophagic inhibitors (*P < 0.05; **P < 0.01).
- Inhibition of SC activation by atg5 and atg7 knockdown. Freshly isolated single fibers (left) or FACS-sorted QSCs (right) were transfected with siRNAs against atg5 and atg7, cultured with EdU for 24 h, and assessed for EdU incorporation. Control cultures were transfected with cyclophilin B siRNA (*P < 0.05; ***P < 0.001).
- Inhibition of activation by genetic loss of atg5. Freshly isolated single fibers (left) or FACS-sorted QSCs (right) were isolated from Pax7CreER/+; ATG5fl/fl mice in media containing 4-hydroxytamoxifen, cultured in media with EdU and 4-hydroxytamoxifen for 24 h, and assessed for EdU incorporation (n.s., not significant; *P < 0.05).
Since DNA synthesis is a late component of the process of SC activation, we investigated cell cycle proteins governing the progression through the G1/S checkpoint. An increase in cyclin A, cyclin E, and phosphorylated retinoblastoma protein (Rb) and a decrease in p27 levels are among the changes typically observed during this progression (Morgan, 1997; Lundberg & Weinberg, 1998). We found that SCs transfected with atg5/7 siRNAs had lower levels of cyclins A and E and phospho-Rb but higher levels of p27 relative to control SCs (Supplementary Fig S6). These data show that inhibition of autophagy impacts cell cycle entry prior to S phase for SCs activating out of quiescence.
Autophagy contributes bioenergetically to the process of SC activation
Since one role of autophagy is to produce energy by catabolizing intracellular contents (Rabinowitz & White, 2010), we reasoned that autophagy may support the cellular energy demands occurring during the activation process. It has been shown that quiescent HSCs have lower mitochondrial content and activity than fast-cycling HSCs or hematopoietic progenitors and generate energy primarily through glycolysis, whereas increased ATP production and mitochondrial membrane potential are associated with progression through the G1 phase of the cell cycle (Schieke et al, 2008; Folmes et al, 2012). This increase in oxidative metabolism is necessary to fuel increased biosynthesis for DNA replication as well as transcriptional and translational processes to support cell growth prior to cell division (Lunt & Vander Heiden, 2011). Recently, we reported the identification of an alert phase of the quiescent state, termed GAlert, in which SCs, though still quiescent, have higher mitochondrial activity and correlatively larger cellular volume than QSCs in G0 (Rodgers et al, 2014). We therefore compared mitochondrial activity, ATP content, and cellular volumes in QSCs, ASCs, and SC progeny. MitoTracker labeling was about 5- and 10-fold higher in ASCs and SC progeny, respectively, reflecting a significant increase in mitochondrial activity compared with QSCs (Fig 4A and B). ATP levels, too, increased with SC activation, with ASCs and SC progeny exhibiting 10 and 100 times greater levels, respectively, than those in QSCs (Fig4C). Cellular size, as determined by relative cell volume, increased by 1.4 and 2.7 times in ASCs and SC progeny, respectively, compared to that of QSCs (Fig4D; Supplementary Fig S7). These data confirm that cellular metabolism increases during activation, with ATP levels increasing in far greater proportion than cell volume.
Figure 4. ASCs and SC progeny have increased metabolic activity than QSCs.
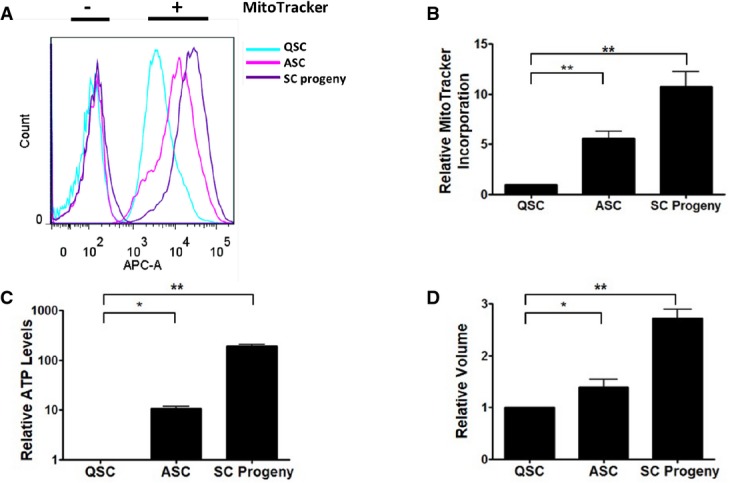
- Increase in functional mitochondria of ASCs and SC progeny versus QSCs. Mononuclear cells from uninjured and injured muscles were stained with antibodies for the sorting of myogenic cells, treated with MitoTracker Deep Red FM, and analyzed by FACS.
- Relative MitoTracker incorporation of QSCs, ASCs, and SC progeny. MitoTracker signal intensities obtained from replicate experiments as illustrated in (A) were normalized to levels in QSCs from uninjured muscles (**P < 0.01).
- Relative ATP contents of QSCs, ASCs, and SC progeny. QSCs, ASCs, and SC progeny were sorted from uninjured muscles or from muscles 1.5 or 2.5 days after injury, respectively. ATP contents were normalized to levels obtained from QSCs from uninjured muscles (*P < 0.05; **P < 0.01).
- Cell volumes in ASCs and SC progeny versus QSCs. Volumes of QSCs, ASCs, and SC progeny were determined based on forward scatter from FACS analyses. Relative volumes were calculated from standard curves from beads of standard sizes (*P < 0.05; **P < 0.01).
Since ATP content in ASCs is much greater than in QSCs, we next tested whether autophagy contributes to this increase. We inhibited autophagy in freshly isolated QSCs with atg5 and atg7 siRNAs and found a reduction in the increase in their ATP content during activation (Fig 5A). We therefore conclude that autophagy serves to provide bioenergetic resources to SCs undergoing activation from the quiescent state. To test whether the delay in QSC activation by inhibition of autophagy can be attributed to insufficient energy levels, we blocked autophagy in freshly isolated QSCs and fiber-associated SCs and supplemented the media with an exogenous metabolite, sodium pyruvate, as an energy source. We found that the delay in activation resulting from the siRNA transfections could be partially rescued by sodium pyruvate (Fig5B). Moreover, ATP levels in atg5/7 siRNA-transfected SCs could also be partially rescued by sodium pyruvate addition (Supplementary Fig S8). These data suggest that the delay of SC activation that occurs when autophagy is inhibited is due to a failure in the generation of sufficient energetic resources necessary for the biosynthetic processes required for the activation process.
Figure 5. Blocking autophagy leads to a bioenergetic deficiency during SC activation.

- Decrease in ATP levels of ASCs after inhibition of autophagy. FACS-sorted QSCs were transfected with siRNAs against atg5 and atg7, cultured for 24 h to allow in vitro activation and at which point they are ASCs, and then collected for ATP assay. Control cultures were transfected with a negative control siRNA (*P < 0.05).
- Partial rescue of delay in activation by addition of exogenous metabolite. Freshly isolated single fibers (left) and FACS-sorted QSCs (right) were transfected with siRNAs against atg5 and atg7 and cultured for 24 h with EdU and 20 μM sodium pyruvate. The samples were then assessed for EdU incorporation. Control cultures were transfected with a cyclophilin B siRNA (n.s., not significant; *P < 0.05).
SIRT1 induces autophagy during SC activation
How the need for more energy during QSC activation induces an autophagic response is not yet understood. Because regulators of cellular metabolism have increasingly been shown to regulate stem cell maintenance and function (Rafalski & Brunet, 2011; Folmes et al, 2012), we reasoned that molecules or processes known to sense and respond to a cell's nutritional status may signal for the induction of autophagy during SC activation. We hypothesized that SIRT1, which responds to metabolic changes and mediates the benefits of caloric restriction (Herranz & Serrano, 2010; Chalkiadaki & Guarente, 2012), may regulate autophagic flux in SCs in response to increased energy needs during activation. In addition to its function in metabolism, SIRT1 has previously been shown to deacetylate a number of autophagy proteins in vitro and to modulate autophagic flux under starvation conditions (Lee et al, 2008; Hariharan et al, 2010). In order to test whether SIRT1 could modulate the autophagic response in proliferative SC progeny, we used a small molecular inhibitor of SIRT1, EX-527 (Napper et al, 2005), and found that it led to a dose-dependent decrease in autophagic flux (Fig 6A). To confirm this, we examined autophagic flux in sirt1−/− SC progeny obtained from mice transgenic for a SC-specific, tamoxifen-inducible Pax7CreER allele and homozygous for floxed sirt1 alleles (Li et al, 2007). Administration of 4-hydroxytamoxifen leads to CRE-mediated recombination that excises exon 4 of sirt1, thus creating sirt1−/− cells in the SC lineage. These cells also showed reduced autophagic flux by immunocytochemical staining and by Western blotting (Fig6B and C). To test whether loss of sirt1 affects autophagic flux during SC activation, we transfected siRNAs against sirt1 into SCs from LC3-GFP mice and found that this also decreased autophagic flux (Fig6D; Supplementary Fig S9). These data confirm that SIRT1 normally functions to induce autophagic flux during SC activation and in SC progeny.
Figure 6. SIRT1 mediates autophagic flux.

- Reduction of autophagic flux resulting from chemical inhibition of SIRT1. SC progeny obtained from WT mice were incubated with SIRT1 inhibitor EX527, treated with CQ for 2 h, and immunostained with anti-LC3B antibody. Arrows indicate LC3B punctae. Scale bar: 16 μm.
- Reduction of autophagic flux resulting from genetic loss of sirt1. SC progeny obtained from WT or Pax7CreER/+; SIRT1fl/fl mice were treated with vehicle control or 4-hydroxytamoxifen in vitro to generate sirt1+/+ and sirt1−/− cells, respectively. The cells were then treated with CQ or vehicle control, fixed, and immunostained with anti-LC3B antibody. Scale bar: 16 μm.
- Western blot analysis of the inhibition of autophagic flux resulting from genetic loss of sirt1. Lysates of sirt1+/+ and sirt1−/− cells were analyzed by Western blot analysis (left panel). Blots were probed with anti-LC3B and anti-β-actin antibodies. To quantify autophagic flux (right panel), the intensities of bands for LC3B-II from three independent Western blots were first normalized to levels of GAPDH, and then ratios of the intensities of +CQ to –CQ conditions were calculated for each time point (*P < 0.05).
- Decrease in autophagic flux in in vitro-activated SCs resulting from sirt1 knockdown. Sorted QSCs from LC3-GFP mice were transfected with siRNAs against sirt1, cultured for 24 h, and treated with CQ. LC3-GFP punctae were counted, and cells with greater than three punctae were characterized as having induced autophagic flux (IAF). Control cultures were treated with a negative control siRNA (**P < 0.01).
Because SIRT1 is a positive regulator of autophagic flux, we next tested whether loss of sirt1 would phenocopy the inhibition of autophagy with respect to QSC activation. We found that FACS-sorted and fiber-associated sirt1−/− SCs were delayed in activation (Fig 7A). We next tested whether this delay was due to a metabolic deficiency. We therefore stained sirt1+/− and sirt1−/− QSCs with MitoTracker and found that the latter had lower mitochondrial activity than the former (Supplementary Fig S10). Supplementing the culture media with sodium pyruvate partially rescued the delay in activation in sirt1−/− SC populations (Fig7B). Taken together, these results demonstrate that SIRT1 is necessary for the normal induction of autophagy during SC activation, a process that fulfills a bioenergetic need during this critical cellular transition. Clearly, however, a considerable degree of autophagy is induced even in the absence of SIRT1 (Fig6C and D), reflecting the fact that there are likely multiple parallel pathways of autophagy inductions and regulation.
Figure 7. SIRT1 mediates SC activation.

- Delay in activation of SCs with genetic loss of sirt1. Pax7CreER/+; SIRT1fl/+ and Pax7CreER/+; SIRT1fl/fl mice were treated with tamoxifen to create sirt1−/− and sirt1+/− genotypes in the SC lineage. Single fibers (left) and QSCs (right) sorted by FACS to a purity of ˜98% from these animals were cultured for 24 h in the presence of EdU. EdU incorporation was then determined (*P < 0.05).
- Partial rescue of delay in activation by addition of an exogenous metabolite. sirt1−/− and sirt1+/− fiber-associated (left) and sorted QSCs (right) were obtained as in (A) and cultured with EdU and 20 μM sodium pyruvate. EdU incorporation was assessed after 24 h in culture (n.s., not significant; *P < 0.05).
Mechanism of SIRT1 regulation of autophagy in SCs
To investigate how SIRT1 may regulate autophagy, we first examined components of the autophagic machinery as potential targets of SIRT1. Lee et al (2008) had previously shown that SIRT1 interacts with and deacetylates ATG5, 7, and 8 in a nutrient-deprivation model using murine embryonic fibroblasts. To determine whether a similar mechanism occurs in SCs, we tested for endogenous protein–protein interactions between SIRT1 and ATG5 and ATG7 and found that SIRT1 indeed interacted with ATG7 but not with ATG5 (Fig8A). Moreover, we found higher levels of acetylated ATG7 in sirt1−/− SC progeny than in the sirt1+/+ population (Fig8B), suggesting that SIRT1 deacetylates ATG7. These data also suggest that the regulation of autophagy by SIRT1 occurs at least in part through its interaction with ATG7. The absence of a physical interaction between SIRT1 and ATG5 in our studies suggests that our findings of delayed SC activation by conditional deletion of atg5 may be SIRT1 independent.
Figure 8. The regulation of autophagy in SCs by SIRT1.

- SIRT1 interacts with ATG7. Anti-ATG5 or anti-ATG7 antibodies were used in immunoprecipitation (IP) reactions with protein lysates from sirt+/+ and sirt−/− SC progeny. Western blots were probed with an anti-SIRT1 antibody.
- Loss of sirt1 leads to hyperacetylation of ATG7. An anti-acetylated lysine antibody was used in IP reactions with protein lysates from sirt+/+ and sirt−/− SC progeny. Western blots were probed with an anti-ATG7 antibody (left panel). ATG7 bands from IP reactions on three independent Western blots were normalized to ATG7 input bands prior to calculating relative amounts of protein (right panel) (**P < 0.01).
- Effect of loss of sirt1 on AMPK and mTOR pathways. Protein lysates from sirt+/+ and sirt−/− SC progeny were subjected to Western analysis and probed with antibodies against the phosphorylated and non-phosphorylated forms of AMPKα, S6, and 4E-BP1 proteins (left panel). Bands for phosphoproteins were normalized to bands for total protein prior to calculating relative amounts of phosphoproteins (right panel) (n.s., not significant; *P < 0.05).
In another approach, we explored two metabolic pathways, the AMPK and mTOR pathways, that have been shown to link SIRT1 activity to the regulation of autophagy (Ghosh et al, 2010; Dunlop & Tee, 2013; Parzych & Klionsky, 2014; Hong et al, 2014; Ou et al, 2014). When we knocked out sirt1 in SC progeny, AMPKα became hypophosphorylated, whereas the phosphorylation levels of mTOR targets, S6 and 4E-BP1, remained unchanged (Fig8C). These data suggest that SIRT1 may modulate autophagy in SCs through the AMPK pathway and support the hypothesis that autophagy is induced during SC activation in response to a relative lack of nutrient availability, contributing to the evidence that autophagy may play a critical role in cellular bioenergetics during times of relative nutrient deprivation.
Discussion
Our results demonstrate the importance of autophagy in SC activation. Autophagic flux appears to be too low to be detectable in QSCs, but increases along with ATP content occur during SC activation. Notably, the increased flux is detected at a time point when the majority of the cells have not yet entered the cell cycle. We show that inhibiting autophagy leads to a decrease in autophagic flux, a reduction in ATP content, and a delay in activation, suggesting a causal link between autophagic flux, bioenergetic status, and SC activation. That a partial rescue in the delay in activation can be achieved with sodium pyruvate confirms a bioenergetic requirement that autophagy may fulfill during activation. We also show that SIRT1, a known nutrient sensor, induces autophagic flux during SC activation and that its inhibition also causes a delay in SC activation.
Our findings parallel to those of Hubbard et al (2010) who demonstrated that autophagy produces energy required for another cellular process with a high bioenergetic demand, the activation of resting T cells in response to antigen recognition. Similar to our observations during SC activation, they detected an induction of autophagy after T-cell stimulation and showed that blocking autophagy leads to reduced ATP production and hinders T-cell activation, which can be rescued by exogenous pyruvate. Intriguingly, they observed a difference in autophagosomal cargo selection in resting and activated T cells, highlighting the importance of substrate specificity of autophagy in its quality control and energy production modes. Along these lines, the possibility that the role of substrate-specific autophagy in that study or in our study could involve the selective degradation of inhibitors of the activation processes has not been excluded.
Whereas several studies have demonstrated the importance of autophagy in the maintenance and function of stem cells (Guan et al, 2013; Phadwal et al, 2013), none have specifically addressed stem cell activation from a quiescent state. One study in which atg7 is genetically knocked out in Myf5+ progenitor cells that give rise to muscle and brown adipose tissue demonstrated the requirement for autophagy in proper brown fat and skeletal muscle development (Martinez-Lopez et al, 2013). Another recent study using an HSC-specific knockout of atg7 suggests that inhibition of autophagy may lead to a loss of quiescence (Mortensen et al, 2011). Other studies perturbing metabolic pathways that may regulate autophagy show defects in the maintenance of quiescence. For example, knocking out Pten or TSC1 in HSCs de-represses the mTOR pathway, a major negative regulator of autophagy, and causes inappropriate proliferation (Yilmaz et al, 2006; Zhang et al, 2006; Gan et al, 2008). A similar loss of HSC quiescence is seen in knockouts of FoxO1 or FoxO3 (Miyamoto et al, 2007; Tothova et al, 2007), proteins which also function in promoting autophagy (Sengupta et al, 2009; Hariharan et al, 2010). Because deletions of Pten or FoxO1, 3, and 4 also lead to a greater propensity for neural stem cells to enter the cell cycle (Groszer et al, 2006; Paik et al, 2009; Renault et al, 2009), metabolic regulation may be a general mechanism governing stem cell quiescence. However, autophagy as a downstream effector of these pathways has not been reported.
Using multiple approaches, we show that the inhibition of autophagy does not lead to a loss of SC quiescence but rather delays the activation of these cells out of the quiescent state. Unlike previous studies which used genetic knockout approaches and analyses long after the gene deletions, we used pharmacological and siRNA approaches to inhibit autophagy acutely. As such, our studies were designed to avoid compensatory or secondary effects associated with chronic autophagy inhibition. Even in our conditional knockout studies of atg5, we examined the process of SC activation immediately after gene deletion. It will be interesting to determine whether the phenotypes of chronic inhibition of autophagy are indeed secondary or tertiary effects of the kinds of defects in stem cell activation that we demonstrate here. It will also be interesting to examine the effects of inhibition of autophagy on later stages of SC activation, proliferation, and differentiation that we did not examine here.
Stem cells have unique metabolic hallmarks that characterize their quiescent, proliferative, and differentiated states (Folmes et al, 2012). For example, quiescent HSCs, which have low mitochondrial content and oxidative activity, primarily generate ATP from glycolysis rather than oxidative phosphorylation (Piccoli et al, 2005; Lonergan et al, 2007; Simsek et al, 2010; Miharada et al, 2011). Proliferating cells, on the other hand, have an increased demand for biogenesis and primarily use oxidative phosphorylation to generate ATP (Hsu & Qu, 2013). As proliferating cells cycle, aerobic ATP production and oxidative phosphorylation fluctuate, increasing in G1 phase (Schieke et al, 2008). In fact, without sufficient energy and metabolites, proliferating cells will arrest in G1 phase (Holley & Kiernan, 1974; Jones et al, 2005). Stem cells activating out of a quiescent state have lower levels of mitochondria and lower oxidative capacity than proliferating progenitor cells (Hsu & Qu, 2013; Shyh-Chang et al, 2013). We show that activating SCs have increased mitochondrial activity with a concomitant increase in ATP content relative to QSCs. Of course, these observations do not exclude the possibility that the increase in ATP was not a direct consequence of the increase in mitochondrial activity since increases in ATP content could result from metabolic processes unrelated to mitochondrial function, such as an increase in glycolytic flux that is decoupled from oxidative phosphorylation. However, our data are consistent with many others showing increased oxidative activity in proliferating progenitor cells relative to stem cells (Folmes et al, 2012; Hsu & Qu, 2013; Shyh-Chang et al, 2013). Furthermore, our observations that inhibiting autophagy suppresses the increase in ATP content of activating SCs and delays their activation support the hypothesis that autophagy provides energy sources that are needed during activation from quiescence. We hypothesize that activation out of quiescence leads to a state of relative nutrient deprivation as cells face a tremendous increase in bioenergetic demand for all of the processes of growth, macromolecular synthesis, and organellogenesis. This state of nutrient-deprivation stress could be the signal that activates the SIRT1 pathway.
Notably, the fact that inhibition of autophagy delays, rather than prevents, cell cycle entry suggests that other processes may compensate for the bioenergetic insufficiency in autophagy-deficient SCs. Possibilities include glycolysis to generate additional ATP and pyruvate and fatty acid oxidation (FAO) to generate NADH, FADH2, and acetyl CoA (Carracedo et al, 2013; Hsu & Qu, 2013). If QSCs have a substantial glycolytic reserve, then glycolytic flux may increase in response to the shortfall in energy during activation (Nicholls et al, 2010; Pelletier et al, 2014). FAO, which can produce twice as much ATP as carbohydrate metabolism when normalized to dry mass (Carracedo et al, 2013), has been shown to support HSC maintenance as well as promote ATP production in response to metabolically stressed cancer cells (Zaugg et al, 2011; Carracedo et al, 2012; Ito et al, 2012). Furthermore, FAO can generate anaplerotic fuels that can feed into the TCA cycle as succinyl-CoA (Velez et al, 2013). FAO could therefore be another potential source of energy for SC activation.
Cells have an intricate system of metabolic pathways and nutrient sensors to ensure that their bioenergetic needs are fulfilled (Shanware et al, 2013). How these pathways trigger an autophagic response is not fully understood. Two pathways that have been shown to regulate autophagy in response to nutrient levels are the AMPK and mTOR pathways (Parzych & Klionsky, 2014). mTOR can inhibit autophagy by disrupting the ULK1–ATG13–FIP200 complex that initiates autophagy (Ganley et al, 2009; Hosokawa et al, 2009; Jung et al, 2009), while AMPK can activate autophagy directly through ULK1 or indirectly through the inhibition of the mTOR pathway (Inoki et al, 2003; Egan et al, 2011; Kim et al, 2011; Dunlop & Tee, 2013). SIRT1, in turn, can negatively regulate the mTOR pathway and positively regulate AMPK (Lan et al, 2008; Ghosh et al, 2010; Kapahi et al, 2010; Takeda-Watanabe et al, 2012). Our studies indicate that SIRT1, perhaps in relation to its role as a nutrient sensor, may be a mediator of the induction of autophagic flux during SC activation when nutrient demands are likely to be extremely high. Our findings that AMPK is hypophosphorylated in sirt1−/− SC progeny while phospho-S6 and phospho-4E-BP1 remain unchanged suggest that SIRT1 signals through AMPK rather than the mTOR pathway to regulate autophagy in SC progeny.
Previous studies have shown that SIRT1 induces autophagy in starvation or pathological conditions (Lee et al, 2008; Hariharan et al, 2010; Jeong et al, 2013). Lee et al (2008) demonstrated in vitro interaction between SIRT1 and three ATG proteins, leading to the deacetylation of those proteins. They also showed early perinatal lethality in sirt1−/− animals that could be delayed by injections of an exogenous metabolite. In our studies, we show that sirt1 deletion phenocopies the inhibition of autophagy with respect to a delay in SC activation and a decrease in autophagic flux. In addition, we demonstrate a direct interaction between SIRT1 and ATG7 in SC progeny and hyperacetylated ATG7 levels in sirt1−/− SC progeny relative to sirt1+/+ SC progeny. We therefore corroborate the findings of Lee et al that SIRT1 can regulate components of the autophagic process (Lee et al, 2008). Unlike the previous studies which used nutrient deprivation and induced neurotoxicity as stressors (Lee et al, 2008; Hariharan et al, 2010; Jeong et al, 2013), we show that the induction of autophagy can be mediated, at least in part, by SIRT1 under conditions of normal nutrient availability.
Our studies demonstrating that autophagy contributes to the metabolic adaptation that SCs undergo during activation add to the understanding of the importance of metabolic flexibility in stem cell fate determination. Stem cells adapt their energy usage and production via the manipulation of different metabolic pathways to support the changing bioenergetic needs during quiescence, proliferation, differentiation, or self-renewal (Folmes et al, 2012). The studies reported here suggest that the activation out of quiescence is an example of a stem cell function that requires rapid and dramatic changes in the metabolic activity and that the induction of autophagic activity may be a critical component of those metabolic shifts. Autophagy may therefore be an additional general mechanism which confers on stem cells another degree of metabolic flexibility to respond to fluctuating bioenergetic demands.
Materials and Methods
Mouse strains
LC3-GFP transgenic mice and ATG5fl/fl mice, in which exon 3 of atg5 is flanked by loxP sites, were obtained from the Riken BioResource Center (Mizushima et al, 2004; Hara et al, 2006). ATG5fl/fl mice were crossed with Pax7CreER mice, in which inducible Cre recombinase is knocked into the SC-specific Pax7 locus, to create Pax7CreER/+; ATG5fl/+ control or Pax7CreER/+; and ATG5fl/fl experimental animals. C57BL6, ROSAeYFP/eYFP, and SIRT1fl/fl mice, in which exon 4 of sirt1 is flanked by loxP sites, were obtained from The Jackson Laboratory (Srinivas et al, 2001; Li et al, 2007). Pax7CreER/+; SIRT1fl/+ control or Pax7CreER/+; and SIRT1fl/fl experimental animals were created by crossing SIRT1fl/fl mice with Pax7CreER mice. Recombination at the loxP sites was induced in SCs in control or experimental animals with tamoxifen treatment (Nishijo et al, 2009). Animal husbandry, surgical procedures, and drug administration were performed according to the guidelines established by the Veterinary Medical Unit of the Veterans Affairs Health Care System in Palo Alto.
Mouse procedures
Mice at 8 weeks of age were injected intraperitoneally six times over the course of 3 weeks with 100 μl tamoxifen (Sigma-Aldrich) that was resuspended at 50 mg/ml in corn oil and ethanol. Mice were first anesthetized with isoflurane/O2 mixture prior to injury. To study muscle regeneration in the tibialis anterior (TA) muscle, 50 μl of 1.2% BaCl2 (w/v in ddH2O) was injected into one site in the TA. To generate ASCs, the same volume was injected into multiple areas in each lower limb. All procedures were approved by the Institutional Animal Care and Use Committee.
Satellite cell isolation
Injured and uninjured hindlimb muscles were dissected and digested into mononuclear cells as previously described (Cheung et al, 2012; Liu et al, 2013). Briefly, hindlimb muscles were dissected and cut into small pieces with scissors. They were then digested in Ham's F10 medium with 10% horse serum (i.e., wash media) with collagenase II at 500 U/ml at 37°C for 1.5 h. The mixture was then washed and digested for an additional 30 min at 37°C in wash media with 100 U/ml collagenase II and 2 U/ml dispase. Finally, the mixture was triturated with a 20-gauge needle and washed. Myogenic cells were then isolated by fluorescence-activated cell sorting (FACS) by negative selection with anti-CD31-FITC, anti-CD45-FITC, and anti-Sca-1-Pacific Blue antibodies (Biolegend). An anti-VCAM-biotin primary antibody and a streptavidin-PE-cy7 secondary antibody (Biolegend) were used for positive selection. The purity of the sorted cells, as determined by immunocytochemical staining with anti-Pax7 and anti-MyoD antibodies, was ∼98%.
SC progeny isolation
Hindlimb muscles were subjected to needle injury and harvested 2.5 days later. The muscles were digested and sorted as described for SC isolation above. FACS-sorted SC progeny were then plated in Ham's F-10 nutrient mixture with 10% horse serum (HS) onto 35-mm tissue culture dishes coated with extracellular matrix (Sigma) at a 1:500 dilution. The media was exchanged with Ham's F-10 with 20% fetal bovine serum (FBS) and 2.5 ng/ml fibroblast growth factor (FGF) (Peprotech) the next day and maintained for the subsequent 3–4 weeks to allow the proliferative expansion of the SC progeny. The purity of the culture, as determined by immunocytochemical staining with anti-Pax7 and anti-MyoD antibodies, was > 99%.
Single myofiber isolation
To isolate single myofibers (Rosenblatt et al, 1995), extensor digitorum longus (EDL) muscles were dissected and digested in Ham's F-10 media with type II collagenase at 500 units/ml for 75 min at 37°C. The fibers were then dissociated and washed in Ham's F-10 with 10% HS five times and then plated in Ham's F-10 with 10% HS and 0.5% chick embryo extract (U.S. Biological). Half the media was exchanged with Ham's F-10 media with 20% FBS on each subsequent day in culture.
5-ethynyl-2′-deoxyuridine (EdU) incorporation assay
EdU was added to cell or fiber cultures at a final concentration of 10 μM. Detection was performed with the Click-iT EdU Imaging Kit (Life Technologies) according to manufacturer's protocol.
Quantitative polymerase chain reaction (qPCR)
The RNeasy Plus Micro Kit (Qiagen) was used for RNA extraction from SCs. Reverse transcription was performed with the High Capacity cDNA Reverse Transcription Kit (Life Technologies), and qPCR was performed with the LightCycler 480 Probe Master kit (Roche) and TaqMan probes (Life Technologies) in the LightCycler480 II System (Roche). Relative quantification of transcripts was calculated according to the ΔΔCT method (Suda et al, 2011).
Determination of autophagic flux
Autophagic flux was determined by the relative accumulation of LC3B-II by Western blot analysis or by the assessment of GFP punctae in SCs from LC3-GFP mice upon inhibition of autophagy by culturing with 20 μM CQ for 2 h (Mizushima et al, 2004, 2010; Klionsky et al, 2008). To analyze autophagic flux by quantifying punctae, myofibers or SCs from LC3-GFP mice were fixed as described below, and the punctae were counted.
MitoTracker staining
Hindlimb muscles were dissected and digested into mononuclear cells and stained with antibodies for satellite cell isolation by FACS as described above. They were then incubated with MitoTracker deep red FM (Life Technologies) at 37°C for 30 min. The cells were washed twice prior to analysis on the FACSAria II or III.
ATP quantification
ATP content of SCs was determined with the ATP Bioluminescence Assay Kit CLS II (Roche) according to manufacturer's recommendations.
Determination of cell volume
The forward scatter (FSC) of SCs was measured with either a FACSAria II or FACSAria III, and the cellular volumes were determined from a standard curve graphed from the FSC of standard microspheres from the Flow Cytometry Size Calibration Kit (Life Technologies).
Immunofluorescence
Isolated QSCs or ASCs, proliferating SC progeny, or single fibers with associated QSCs or ASCs were fixed in 2% paraformaldehyde (PFA) for 5 min at room temperature and washed in PBS with 0.1% Triton X-100. They were blocked with PBS with 0.1% Triton X-100 and 20% donkey serum for 1 h at room temperature and then incubated with primary antibodies overnight at 4°C. The cells or single fibers were then washed and incubated in Alexa-conjugated species-specific secondary antibodies and 40,6-diamidino-2-phenylindole (DAPI) at room temperature for 1 h. The specimens were washed and mounted in mounting media (Electron Microscopy Sciences). For analysis of GFP punctae in fiber-associated SCs from LC3-GFP mice, fibers were fixed in 2% PFA for 5 min at room temperature, washed in PBS with 5% horse serum, and permeabilized in 50 μg/ml digitonin in PBS and 5% HS for 5 min at 37°C followed by quenching in 50 mM NH4Cl in PBS and 5% HS for 5 min at 37°C and washes in PBS and 5% HS. Incubations in primary antibodies were performed in 1× permeabilization buffer (eBioscience) and 10% donkey serum overnight at 4°C. The fibers were washed and incubated with secondary antibodies and DAPI in 1× permeabilization buffer and 10% donkey serum at room temperature for 1 h. Fibers were washed and EdU Click-IT assay was performed, if required. Fibers were washed and mounted in mounting media. For analysis of GFP punctae or LC3B immunoreactivity in isolated cells, the same procedure was performed as for fibers, except that washes were done with PBS. For immunostaining of muscle sections, TA muscles were fixed in 0.5% PFA for 5 h at room temperature, dehydrated in 20% sucrose in PBS, and frozen in Optimal Cutting Temperature mounting media (Sakura Finetek). Cryosections were collected, fixed in 2% PFA for 5 min at room temperature, and washed in PBS with 0.3% Triton X-100. The samples were blocked in PBS with 0.3% Triton X-100 and 20% donkey serum for at least 1 h at room temperature and then washed. Mouse primary antibodies were conjugated to secondary antibodies with the Zenon kit (Life Technologies) and incubated along with primary antibodies from other species with sections overnight at 4°C. Sections were washed, incubated in secondary antibodies for 1 h at room temperature, washed again, and mounted in mounting media. Primary antibodies were as follows: mouse anti-Pax7 (DSHB), mouse anti-MyoD (Dako), rabbit anti-LC3B (Cell Signaling), rabbit anti-GFP (Life Technologies), chick anti-GFP (Aves), and rat anti-Laminin (Sigma-Aldrich). Secondary antibodies used are conjugated to Alexa fluorescent dyes (Life Technologies).
Protein immunoprecipitation
SC progeny were harvested, washed in PBS, and lysed in RIPA lysis buffer (50 mM Tris–HCl, pH 7.5; 150 mM NaCl; 5 mM EDTA; 1% NP-40; 0.5% sodium deoxycholate; 0.1% SDS) with 1× protease inhibitors (Roche), phosphatase inhibitors, and 5 μM trichostatin A (Sigma). Cells were incubated on ice for 30 min, and the lysate was passed through a 30-gauge needle. After the debris was removed by centrifugation, the lysate was pre-cleared with magnetic beads (Cell Signaling) at 4°C for at least 3 h. The beads were then removed, and the lysate was incubated with antibody overnight at 4°C. Magnetic beads were added to the lysate and incubated at 4°C for 2 h and at room temperature for 15 min. The beads were then washed 5 × 10 min with RIPA buffer. Protein was eluted from the beads with 3× SDS loading buffer, and Western analysis was performed. Antibodies were as follows: rabbit anti-acetylated lysine, rabbit anti-ATG7, and rabbit anti-ATG5 (Cell Signaling).
Statistical analysis
Quantitative analyses were performed on experiments done at least in triplicate and expressed as means ± standard error of mean (SEM). Statistical significance was determined with two-tailed Student's t-tests.
Acknowledgments
We thank the members of the Rando Lab for critical discussions. We thank Dr. Charles Keller for the Pax7CreER mice and Dr. Noboru Mizushima and the Riken Bioresource Center for permission to use the LC3-GFP and ATG5fl/fl mice. We are grateful to Dr. Albert La Spada for providing us with the LC3-GFP and ATG5fl/fl mice. This work was supported by the Glenn Foundation for Medical Research and by grants from the NIH (R01 AG23806, Transformative R01 AG047820, and P01 AG036695) to TAR.
Author contributions
AHT contributed to the conception and design of the project, acquisition, analysis, and interpretation of the data, and the writing of the manuscript. TAR contributed to conception and design of the project, the interpretation of the data, and the writing of the manuscript.
Conflict of interest
The authors declare that they have no conflict of interest.
Supporting Information
Supplementary information for this article is available online: http://emboj.embopress.org
Supplementary Figures
Review Process File
Source Data for Figure 1C
Source Data for Figure 3C
Source Data for Figure 6C
Source Data for Figure 8
References
- Boutet SC, Cheung TH, Quach NL, Liu L, Prescott SL, Edalati A, Iori K, Rando TA. Alternative polyadenylation mediates microRNA regulation of muscle stem cell function. Cell Stem Cell. 2012;10:327–336. doi: 10.1016/j.stem.2012.01.017. [DOI] [PMC free article] [PubMed] [Google Scholar]
- Brack AS, Conboy MJ, Roy S, Lee M, Kuo CJ, Keller C, Rando TA. Increased Wnt signaling during aging alters muscle stem cell fate and increases fibrosis. Science. 2007;317:807–810. doi: 10.1126/science.1144090. [DOI] [PubMed] [Google Scholar]
- Brack AS, Rando TA. Tissue-specific stem cells: lessons from the skeletal muscle satellite cell. Cell Stem Cell. 2012;10:504–514. doi: 10.1016/j.stem.2012.04.001. [DOI] [PMC free article] [PubMed] [Google Scholar]
- Carracedo A, Weiss D, Leliaert AK, Bhasin M, de Boer VC, Laurent G, Adams AC, Sundvall M, Song SJ, Ito K, Finley LS, Egia A, Libermann T, Gerhart-Hines Z, Puigserver P, Haigis MC, Maratos-Flier E, Richardson AL, Schafer ZT, Pandolfi PP. A metabolic prosurvival role for PML in breast cancer. J Clin Invest. 2012;122:3088–3100. doi: 10.1172/JCI62129. [DOI] [PMC free article] [PubMed] [Google Scholar]
- Carracedo A, Cantley LC, Pandolfi PP. Cancer metabolism: fatty acid oxidation in the limelight. Nat Rev Cancer. 2013;13:227–232. doi: 10.1038/nrc3483. [DOI] [PMC free article] [PubMed] [Google Scholar]
- Chalkiadaki A, Guarente L. Sirtuins mediate mammalian metabolic responses to nutrient availability. Nat Rev Endocrinol. 2012;8:287–296. doi: 10.1038/nrendo.2011.225. [DOI] [PubMed] [Google Scholar]
- Chen C, Liu Y, Liu R, Ikenoue T, Guan KL, Zheng P. TSC-mTOR maintains quiescence and function of hematopoietic stem cells by repressing mitochondrial biogenesis and reactive oxygen species. J Exp Med. 2008;205:2397–2408. doi: 10.1084/jem.20081297. [DOI] [PMC free article] [PubMed] [Google Scholar]
- Cheung TH, Quach NL, Charville GW, Liu L, Park L, Edalati A, Yoo B, Hoang P, Rando TA. Maintenance of muscle stem-cell quiescence by microRNA-489. Nature. 2012;482:524–528. doi: 10.1038/nature10834. [DOI] [PMC free article] [PubMed] [Google Scholar]
- Dunlop EA, Tee AR. The kinase triad, AMPK, mTORC1 and ULK1, maintains energy and nutrient homoeostasis. Biochem Soc Trans. 2013;41:939–943. doi: 10.1042/BST20130030. [DOI] [PubMed] [Google Scholar]
- Easley CA, Ben-Yehudah A, Redinger CJ, Oliver SL, Varum ST, Eisinger VM, Carlisle DL, Donovan PJ, Schatten GP. mTOR-mediated activation of p70 S6K induces differentiation of pluripotent human embryonic stem cells. Cell Reprogram. 2010;12:263–273. doi: 10.1089/cell.2010.0011. [DOI] [PMC free article] [PubMed] [Google Scholar]
- Egan DF, Shackelford DB, Mihaylova MM, Gelino S, Kohnz RA, Mair W, Vasquez DS, Joshi A, Gwinn DM, Taylor R, Asara JM, Fitzpatrick J, Dillin A, Viollet B, Kundu M, Hansen M, Shaw RJ. Phosphorylation of ULK1 (hATG1) by AMP-activated protein kinase connects energy sensing to mitophagy. Science. 2011;331:456–461. doi: 10.1126/science.1196371. [DOI] [PMC free article] [PubMed] [Google Scholar]
- Folmes CD, Dzeja PP, Nelson TJ, Terzic A. Metabolic plasticity in stem cell homeostasis and differentiation. Cell Stem Cell. 2012;11:596–606. doi: 10.1016/j.stem.2012.10.002. [DOI] [PMC free article] [PubMed] [Google Scholar]
- Gan B, Sahin E, Jiang S, Sanchez-Aguilera A, Scott KL, Chin L, Williams DA, Kwiatkowski DJ, DePinho RA. mTORC1-dependent and -independent regulation of stem cell renewal, differentiation, and mobilization. Proc Natl Acad Sci U S A. 2008;105:19384–19389. doi: 10.1073/pnas.0810584105. [DOI] [PMC free article] [PubMed] [Google Scholar]
- Ganley IG, du Lam H, Wang J, Ding X, Chen S, Jiang X. ULK1.ATG13.FIP200 complex mediates mTOR signaling and is essential for autophagy. J Biol Chem. 2009;284:12297–12305. doi: 10.1074/jbc.M900573200. [DOI] [PMC free article] [PubMed] [Google Scholar]
- Ghosh HS, McBurney M, Robbins PD. SIRT1 negatively regulates the mammalian target of rapamycin. PLoS ONE. 2010;5:0009199. doi: 10.1371/journal.pone.0009199. [DOI] [PMC free article] [PubMed] [Google Scholar]
- Groszer M, Erickson R, Scripture-Adams DD, Dougherty JD, Le Belle J, Zack JA, Geschwind DH, Liu X, Kornblum HI, Wu H. PTEN negatively regulates neural stem cell self-renewal by modulating G0-G1 cell cycle entry. Proc Natl Acad Sci U S A. 2006;103:111–116. doi: 10.1073/pnas.0509939103. [DOI] [PMC free article] [PubMed] [Google Scholar]
- Guan JL, Simon AK, Prescott M, Menendez JA, Liu F, Wang F, Wang C, Wolvetang E, Vazquez-Martin A, Zhang J. Autophagy in stem cells. Autophagy. 2013;9:830–849. doi: 10.4161/auto.24132. [DOI] [PMC free article] [PubMed] [Google Scholar]
- Hara T, Nakamura K, Matsui M, Yamamoto A, Nakahara Y, Suzuki-Migishima R, Yokoyama M, Mishima K, Saito I, Okano H, Mizushima N. Suppression of basal autophagy in neural cells causes neurodegenerative disease in mice. Nature. 2006;441:885–889. doi: 10.1038/nature04724. [DOI] [PubMed] [Google Scholar]
- Hariharan N, Maejima Y, Nakae J, Paik J, Depinho RA, Sadoshima J. Deacetylation of FoxO by Sirt1 plays an essential role in mediating starvation-induced autophagy in cardiac myocytes. Circ Res. 2010;107:1470–1482. doi: 10.1161/CIRCRESAHA.110.227371. [DOI] [PMC free article] [PubMed] [Google Scholar]
- He C, Klionsky DJ. Regulation mechanisms and signaling pathways of autophagy. Annu Rev Genet. 2009;43:67–93. doi: 10.1146/annurev-genet-102808-114910. [DOI] [PMC free article] [PubMed] [Google Scholar]
- He C, Bassik MC, Moresi V, Sun K, Wei Y, Zou Z, An Z, Loh J, Fisher J, Sun Q, Korsmeyer S, Packer M, May HI, Hill JA, Virgin HW, Gilpin C, Xiao G, Bassel-Duby R, Scherer PE, Levine B. Exercise-induced BCL2-regulated autophagy is required for muscle glucose homeostasis. Nature. 2012;481:511–515. doi: 10.1038/nature10758. [DOI] [PMC free article] [PubMed] [Google Scholar]
- Herranz D, Serrano M. SIRT1: recent lessons from mouse models. Nat Rev Cancer. 2010;10:819–823. doi: 10.1038/nrc2962. [DOI] [PMC free article] [PubMed] [Google Scholar]
- Holley RW, Kiernan JA. Control of the initiation of DNA synthesis in 3T3 cells: low-molecular weight nutrients. Proc Natl Acad Sci U S A. 1974;71:2942–2945. doi: 10.1073/pnas.71.8.2942. [DOI] [PMC free article] [PubMed] [Google Scholar]
- Hong S, Zhao B, Lombard DB, Fingar DC, Inoki K. Cross-talk between sirtuin and mammalian target of rapamycin complex 1 (mTORC1) signaling in the regulation of S6 kinase 1 (S6K1) phosphorylation. J Biol Chem. 2014;289:13132–13141. doi: 10.1074/jbc.M113.520734. [DOI] [PMC free article] [PubMed] [Google Scholar]
- Hosokawa N, Hara T, Kaizuka T, Kishi C, Takamura A, Miura Y, Iemura S, Natsume T, Takehana K, Yamada N, Guan JL, Oshiro N, Mizushima N. Nutrient-dependent mTORC1 association with the ULK1-Atg13-FIP200 complex required for autophagy. Mol Biol Cell. 2009;20:1981–1991. doi: 10.1091/mbc.E08-12-1248. [DOI] [PMC free article] [PubMed] [Google Scholar]
- Hsu P, Qu CK. Metabolic plasticity and hematopoietic stem cell biology. Curr Opin Hematol. 2013;20:289–294. doi: 10.1097/MOH.0b013e328360ab4d. [DOI] [PMC free article] [PubMed] [Google Scholar]
- Hubbard VM, Valdor R, Patel B, Singh R, Cuervo AM, Macian F. Macroautophagy regulates energy metabolism during effector T cell activation. J Immunol. 2010;185:7349–7357. doi: 10.4049/jimmunol.1000576. [DOI] [PMC free article] [PubMed] [Google Scholar]
- Inoki K, Zhu T, Guan KL. TSC2 mediates cellular energy response to control cell growth and survival. Cell. 2003;115:577–590. doi: 10.1016/s0092-8674(03)00929-2. [DOI] [PubMed] [Google Scholar]
- Ito K, Carracedo A, Weiss D, Arai F, Ala U, Avigan DE, Schafer ZT, Evans RM, Suda T, Lee CH, Pandolfi PP. A PML-PPAR-delta pathway for fatty acid oxidation regulates hematopoietic stem cell maintenance. Nat Med. 2012;18:1350–1358. doi: 10.1038/nm.2882. [DOI] [PMC free article] [PubMed] [Google Scholar]
- Jeong JK, Moon MH, Lee YJ, Seol JW, Park SY. Autophagy induced by the class III histone deacetylase Sirt1 prevents prion peptide neurotoxicity. Neurobiol Aging. 2013;34:146–156. doi: 10.1016/j.neurobiolaging.2012.04.002. [DOI] [PubMed] [Google Scholar]
- Jones RG, Plas DR, Kubek S, Buzzai M, Mu J, Xu Y, Birnbaum MJ, Thompson CB. AMP-activated protein kinase induces a p53-dependent metabolic checkpoint. Mol Cell. 2005;18:283–293. doi: 10.1016/j.molcel.2005.03.027. [DOI] [PubMed] [Google Scholar]
- Jung CH, Jun CB, Ro SH, Kim YM, Otto NM, Cao J, Kundu M, Kim DH. ULK-Atg13-FIP200 complexes mediate mTOR signaling to the autophagy machinery. Mol Biol Cell. 2009;20:1992–2003. doi: 10.1091/mbc.E08-12-1249. [DOI] [PMC free article] [PubMed] [Google Scholar]
- Kapahi P, Chen D, Rogers AN, Katewa SD, Li PW, Thomas EL, Kockel L. With TOR, less is more: a key role for the conserved nutrient-sensing TOR pathway in aging. Cell Metab. 2010;11:453–465. doi: 10.1016/j.cmet.2010.05.001. [DOI] [PMC free article] [PubMed] [Google Scholar]
- Kim J, Kundu M, Viollet B, Guan KL. AMPK and mTOR regulate autophagy through direct phosphorylation of Ulk1. Nat Cell Biol. 2011;13:132–141. doi: 10.1038/ncb2152. [DOI] [PMC free article] [PubMed] [Google Scholar]
- Klionsky DJ, Abeliovich H, Agostinis P, Agrawal DK, Aliev G, Askew DS, Baba M, Baehrecke EH, Bahr BA, Ballabio A, Bamber BA, Bassham DC, Bergamini E, Bi X, Biard-Piechaczyk M, Blum JS, Bredesen DE, Brodsky JL, Brumell JH, Brunk UT, et al. Guidelines for the use and interpretation of assays for monitoring autophagy in higher eukaryotes. Autophagy. 2008;4:151–175. doi: 10.4161/auto.5338. [DOI] [PMC free article] [PubMed] [Google Scholar]
- Komatsu M, Waguri S, Ueno T, Iwata J, Murata S, Tanida I, Ezaki J, Mizushima N, Ohsumi Y, Uchiyama Y, Kominami E, Tanaka K, Chiba T. Impairment of starvation-induced and constitutive autophagy in Atg7-deficient mice. J Cell Biol. 2005;169:425–434. doi: 10.1083/jcb.200412022. [DOI] [PMC free article] [PubMed] [Google Scholar]
- Kroemer G, Marino G, Levine B. Autophagy and the integrated stress response. Mol Cell. 2010;40:280–293. doi: 10.1016/j.molcel.2010.09.023. [DOI] [PMC free article] [PubMed] [Google Scholar]
- Kuma A, Hatano M, Matsui M, Yamamoto A, Nakaya H, Yoshimori T, Ohsumi Y, Tokuhisa T, Mizushima N. The role of autophagy during the early neonatal starvation period. Nature. 2004;432:1032–1036. doi: 10.1038/nature03029. [DOI] [PubMed] [Google Scholar]
- Lan F, Cacicedo JM, Ruderman N, Ido Y. SIRT1 modulation of the acetylation status, cytosolic localization, and activity of LKB1. Possible role in AMP-activated protein kinase activation. J Biol Chem. 2008;283:27628–27635. doi: 10.1074/jbc.M805711200. [DOI] [PMC free article] [PubMed] [Google Scholar]
- Lee IH, Cao L, Mostoslavsky R, Lombard DB, Liu J, Bruns NE, Tsokos M, Alt FW, Finkel T. A role for the NAD-dependent deacetylase Sirt1 in the regulation of autophagy. Proc Natl Acad Sci U S A. 2008;105:3374–3379. doi: 10.1073/pnas.0712145105. [DOI] [PMC free article] [PubMed] [Google Scholar]
- Li H, Rajendran GK, Liu N, Ware C, Rubin BP, Gu Y. SirT1 modulates the estrogen-insulin-like growth factor-1 signaling for postnatal development of mammary gland in mice. Breast Cancer Res. 2007;9:R1. doi: 10.1186/bcr1632. [DOI] [PMC free article] [PubMed] [Google Scholar]
- Liu F, Lee JY, Wei H, Tanabe O, Engel JD, Morrison SJ, Guan JL. FIP200 is required for the cell-autonomous maintenance of fetal hematopoietic stem cells. Blood. 2010;116:4806–4814. doi: 10.1182/blood-2010-06-288589. [DOI] [PMC free article] [PubMed] [Google Scholar]
- Liu L, Cheung TH, Charville GW, Hurgo BM, Leavitt T, Shih J, Brunet A, Rando TA. Chromatin modifications as determinants of muscle stem cell quiescence and chronological aging. Cell Rep. 2013;4:189–204. doi: 10.1016/j.celrep.2013.05.043. [DOI] [PMC free article] [PubMed] [Google Scholar]
- Lonergan T, Bavister B, Brenner C. Mitochondria in stem cells. Mitochondrion. 2007;7:289–296. doi: 10.1016/j.mito.2007.05.002. [DOI] [PMC free article] [PubMed] [Google Scholar]
- Lum JJ, Bauer DE, Kong M, Harris MH, Li C, Lindsten T, Thompson CB. Growth factor regulation of autophagy and cell survival in the absence of apoptosis. Cell. 2005;120:237–248. doi: 10.1016/j.cell.2004.11.046. [DOI] [PubMed] [Google Scholar]
- Lundberg AS, Weinberg RA. Functional inactivation of the retinoblastoma protein requires sequential modification by at least two distinct cyclin-cdk complexes. Mol Cell Biol. 1998;18:753–761. doi: 10.1128/mcb.18.2.753. [DOI] [PMC free article] [PubMed] [Google Scholar]
- Lunt SY, Vander Heiden MG. Aerobic glycolysis: meeting the metabolic requirements of cell proliferation. Annu Rev Cell Dev Biol. 2011;27:441–464. doi: 10.1146/annurev-cellbio-092910-154237. [DOI] [PubMed] [Google Scholar]
- Mantel C, Messina-Graham S, Broxmeyer HE. Upregulation of nascent mitochondrial biogenesis in mouse hematopoietic stem cells parallels upregulation of CD34 and loss of pluripotency: a potential strategy for reducing oxidative risk in stem cells. Cell Cycle. 2010;9:2008–2017. doi: 10.4161/cc.9.10.11733. [DOI] [PMC free article] [PubMed] [Google Scholar]
- Martinez-Lopez N, Athonvarangkul D, Sahu S, Coletto L, Zong H, Bastie CC, Pessin JE, Schwartz GJ, Singh R. Autophagy in Myf5+ progenitors regulates energy and glucose homeostasis through control of brown fat and skeletal muscle development. EMBO Rep. 2013;14:795–803. doi: 10.1038/embor.2013.111. [DOI] [PMC free article] [PubMed] [Google Scholar]
- Miharada K, Karlsson G, Rehn M, Rorby E, Siva K, Cammenga J, Karlsson S. Cripto regulates hematopoietic stem cells as a hypoxic-niche-related factor through cell surface receptor GRP78. Cell Stem Cell. 2011;9:330–344. doi: 10.1016/j.stem.2011.07.016. [DOI] [PubMed] [Google Scholar]
- Miyamoto K, Araki KY, Naka K, Arai F, Takubo K, Yamazaki S, Matsuoka S, Miyamoto T, Ito K, Ohmura M, Chen C, Hosokawa K, Nakauchi H, Nakayama K, Nakayama KI, Harada M, Motoyama N, Suda T, Hirao A. Foxo3a is essential for maintenance of the hematopoietic stem cell pool. Cell Stem Cell. 2007;1:101–112. doi: 10.1016/j.stem.2007.02.001. [DOI] [PubMed] [Google Scholar]
- Mizushima N, Yamamoto A, Matsui M, Yoshimori T, Ohsumi Y. In vivo analysis of autophagy in response to nutrient starvation using transgenic mice expressing a fluorescent autophagosome marker. Mol Biol Cell. 2004;15:1101–1111. doi: 10.1091/mbc.E03-09-0704. [DOI] [PMC free article] [PubMed] [Google Scholar]
- Mizushima N, Yoshimori T, Levine B. Methods in mammalian autophagy research. Cell. 2010;140:313–326. doi: 10.1016/j.cell.2010.01.028. [DOI] [PMC free article] [PubMed] [Google Scholar]
- Mizushima N, Komatsu M. Autophagy: renovation of cells and tissues. Cell. 2011;147:728–741. doi: 10.1016/j.cell.2011.10.026. [DOI] [PubMed] [Google Scholar]
- Morgan DO. Cyclin-dependent kinases: engines, clocks, and microprocessors. Annu Rev Cell Dev Biol. 1997;13:261–291. doi: 10.1146/annurev.cellbio.13.1.261. [DOI] [PubMed] [Google Scholar]
- Mortensen M, Ferguson DJ, Edelmann M, Kessler B, Morten KJ, Komatsu M, Simon AK. Loss of autophagy in erythroid cells leads to defective removal of mitochondria and severe anemia in vivo. Proc Natl Acad Sci U S A. 2010;107:832–837. doi: 10.1073/pnas.0913170107. [DOI] [PMC free article] [PubMed] [Google Scholar]
- Mortensen M, Soilleux EJ, Djordjevic G, Tripp R, Lutteropp M, Sadighi-Akha E, Stranks AJ, Glanville J, Knight S, Jacobsen SE, Kranc KR, Simon AK. The autophagy protein Atg7 is essential for hematopoietic stem cell maintenance. J Exp Med. 2011;208:455–467. doi: 10.1084/jem.20101145. [DOI] [PMC free article] [PubMed] [Google Scholar]
- Murakami M, Ichisaka T, Maeda M, Oshiro N, Hara K, Edenhofer F, Kiyama H, Yonezawa K, Yamanaka S. mTOR is essential for growth and proliferation in early mouse embryos and embryonic stem cells. Mol Cell Biol. 2004;24:6710–6718. doi: 10.1128/MCB.24.15.6710-6718.2004. [DOI] [PMC free article] [PubMed] [Google Scholar]
- Napper AD, Hixon J, McDonagh T, Keavey K, Pons JF, Barker J, Yau WT, Amouzegh P, Flegg A, Hamelin E, Thomas RJ, Kates M, Jones S, Navia MA, Saunders JO, DiStefano PS, Curtis R. Discovery of indoles as potent and selective inhibitors of the deacetylase SIRT1. J Med Chem. 2005;48:8045–8054. doi: 10.1021/jm050522v. [DOI] [PubMed] [Google Scholar]
- Nicholls DG, Darley-Usmar VM, Wu M, Jensen PB, Rogers GW, Ferrick DA. Bioenergetic profile experiment using C2C12 myoblast cells. J Vis Exp. 2010;6:e2511. doi: 10.3791/2511. [DOI] [PMC free article] [PubMed] [Google Scholar]
- Nishijo K, Hosoyama T, Bjornson CR, Schaffer BS, Prajapati SI, Bahadur AN, Hansen MS, Blandford MC, McCleish AT, Rubin BP, Epstein JA, Rando TA, Capecchi MR, Keller C. Biomarker system for studying muscle, stem cells, and cancer in vivo. FASEB J. 2009;23:2681–2690. doi: 10.1096/fj.08-128116. [DOI] [PMC free article] [PubMed] [Google Scholar]
- Onodera J, Ohsumi Y. Autophagy is required for maintenance of amino acid levels and protein synthesis under nitrogen starvation. J Biol Chem. 2005;280:31582–31586. doi: 10.1074/jbc.M506736200. [DOI] [PubMed] [Google Scholar]
- Ou X, Lee MR, Huang X, Messina-Graham S, Broxmeyer HE. SIRT1 positively regulates autophagy and mitochondria function in embryonic stem cells under oxidative stress. Stem Cells. 2014;32:1183–1194. doi: 10.1002/stem.1641. [DOI] [PMC free article] [PubMed] [Google Scholar]
- Paik JH, Ding Z, Narurkar R, Ramkissoon S, Muller F, Kamoun WS, Chae SS, Zheng H, Ying H, Mahoney J, Hiller D, Jiang S, Protopopov A, Wong WH, Chin L, Ligon KL, DePinho RA. FoxOs cooperatively regulate diverse pathways governing neural stem cell homeostasis. Cell Stem Cell. 2009;5:540–553. doi: 10.1016/j.stem.2009.09.013. [DOI] [PMC free article] [PubMed] [Google Scholar]
- Parzych KR, Klionsky DJ. An overview of autophagy: morphology, mechanism, and regulation. Antioxid Redox Signal. 2014;20:460–473. doi: 10.1089/ars.2013.5371. [DOI] [PMC free article] [PubMed] [Google Scholar]
- Pelletier M, Billingham LK, Ramaswamy M, Siegel RM. Extracellular flux analysis to monitor glycolytic rates and mitochondrial oxygen consumption. Methods Enzymol. 2014;542:125–149. doi: 10.1016/B978-0-12-416618-9.00007-8. [DOI] [PubMed] [Google Scholar]
- Phadwal K, Watson AS, Simon AK. Tightrope act: autophagy in stem cell renewal, differentiation, proliferation, and aging. Cell Mol Life Sci. 2013;70:89–103. doi: 10.1007/s00018-012-1032-3. [DOI] [PMC free article] [PubMed] [Google Scholar]
- Piccoli C, Ria R, Scrima R, Cela O, D'Aprile A, Boffoli D, Falzetti F, Tabilio A, Capitanio N. Characterization of mitochondrial and extra-mitochondrial oxygen consuming reactions in human hematopoietic stem cells. Novel evidence of the occurrence of NAD(P)H oxidase activity. J Biol Chem. 2005;280:26467–26476. doi: 10.1074/jbc.M500047200. [DOI] [PubMed] [Google Scholar]
- Rabinowitz JD, White E. Autophagy and metabolism. Science. 2010;330:1344–1348. doi: 10.1126/science.1193497. [DOI] [PMC free article] [PubMed] [Google Scholar]
- Rafalski VA, Brunet A. Energy metabolism in adult neural stem cell fate. Prog Neurobiol. 2011;93:182–203. doi: 10.1016/j.pneurobio.2010.10.007. [DOI] [PubMed] [Google Scholar]
- Ravikumar B, Sarkar S, Davies JE, Futter M, Garcia-Arencibia M, Green-Thompson ZW, Jimenez-Sanchez M, Korolchuk VI, Lichtenberg M, Luo S, Massey DC, Menzies FM, Moreau K, Narayanan U, Renna M, Siddiqi FH, Underwood BR, Winslow AR, Rubinsztein DC. Regulation of mammalian autophagy in physiology and pathophysiology. Physiol Rev. 2010;90:1383–1435. doi: 10.1152/physrev.00030.2009. [DOI] [PubMed] [Google Scholar]
- Renault VM, Rafalski VA, Morgan AA, Salih DA, Brett JO, Webb AE, Villeda SA, Thekkat PU, Guillerey C, Denko NC, Palmer TD, Butte AJ, Brunet A. FoxO3 regulates neural stem cell homeostasis. Cell Stem Cell. 2009;5:527–539. doi: 10.1016/j.stem.2009.09.014. [DOI] [PMC free article] [PubMed] [Google Scholar]
- Rodgers JT, King KY, Brett JO, Cromie MJ, Charville GW, Maguire KK, Brunson C, Mastey N, Liu L, Tsai CR, Goodell MA, Rando TA. mTORC1 controls the adaptive transition of quiescent stem cells from G0 to G(Alert) Nature. 2014;510:393–396. doi: 10.1038/nature13255. [DOI] [PMC free article] [PubMed] [Google Scholar]
- Rosenblatt JD, Lunt AI, Parry DJ, Partridge TA. Culturing satellite cells from living single muscle fiber explants. In Vitro Cell Dev Biol Anim. 1995;31:773–779. doi: 10.1007/BF02634119. [DOI] [PubMed] [Google Scholar]
- Sampath P, Pritchard DK, Pabon L, Reinecke H, Schwartz SM, Morris DR, Murry CE. A hierarchical network controls protein translation during murine embryonic stem cell self-renewal and differentiation. Cell Stem Cell. 2008;2:448–460. doi: 10.1016/j.stem.2008.03.013. [DOI] [PubMed] [Google Scholar]
- Schieke SM, McCoy JP, Jr, Finkel T. Coordination of mitochondrial bioenergetics with G1 phase cell cycle progression. Cell Cycle. 2008;7:1782–1787. doi: 10.4161/cc.7.12.6067. [DOI] [PMC free article] [PubMed] [Google Scholar]
- Sengupta A, Molkentin JD, Yutzey KE. FoxO transcription factors promote autophagy in cardiomyocytes. J Biol Chem. 2009;284:28319–28331. doi: 10.1074/jbc.M109.024406. [DOI] [PMC free article] [PubMed] [Google Scholar]
- Shanware NP, Bray K, Abraham RT. The PI3K, metabolic, and autophagy networks: interactive partners in cellular health and disease. Annu Rev Pharmacol Toxicol. 2013;53:89–106. doi: 10.1146/annurev-pharmtox-010611-134717. [DOI] [PubMed] [Google Scholar]
- Shyh-Chang N, Daley GQ, Cantley LC. Stem cell metabolism in tissue development and aging. Development. 2013;140:2535–2547. doi: 10.1242/dev.091777. [DOI] [PMC free article] [PubMed] [Google Scholar]
- Simsek T, Kocabas F, Zheng J, Deberardinis RJ, Mahmoud AI, Olson EN, Schneider JW, Zhang CC, Sadek HA. The distinct metabolic profile of hematopoietic stem cells reflects their location in a hypoxic niche. Cell Stem Cell. 2010;7:380–390. doi: 10.1016/j.stem.2010.07.011. [DOI] [PMC free article] [PubMed] [Google Scholar]
- Singh R, Cuervo AM. Autophagy in the cellular energetic balance. Cell Metab. 2011;13:495–504. doi: 10.1016/j.cmet.2011.04.004. [DOI] [PMC free article] [PubMed] [Google Scholar]
- Srinivas S, Watanabe T, Lin CS, William CM, Tanabe Y, Jessell TM, Costantini F. Cre reporter strains produced by targeted insertion of EYFP and ECFP into the ROSA26 locus. BMC Dev Biol. 2001;1:27. doi: 10.1186/1471-213X-1-4. [DOI] [PMC free article] [PubMed] [Google Scholar]
- Suda T, Takubo K, Semenza GL. Metabolic regulation of hematopoietic stem cells in the hypoxic niche. Cell Stem Cell. 2011;9:298–310. doi: 10.1016/j.stem.2011.09.010. [DOI] [PubMed] [Google Scholar]
- Takeda-Watanabe A, Kitada M, Kanasaki K, Koya D. SIRT1 inactivation induces inflammation through the dysregulation of autophagy in human THP-1 cells. Biochem Biophys Res Commun. 2012;427:191–196. doi: 10.1016/j.bbrc.2012.09.042. [DOI] [PubMed] [Google Scholar]
- Tothova Z, Kollipara R, Huntly BJ, Lee BH, Castrillon DH, Cullen DE, McDowell EP, Lazo-Kallanian S, Williams IR, Sears C, Armstrong SA, Passegue E, DePinho RA, Gilliland DG. FoxOs are critical mediators of hematopoietic stem cell resistance to physiologic oxidative stress. Cell. 2007;128:325–339. doi: 10.1016/j.cell.2007.01.003. [DOI] [PubMed] [Google Scholar]
- Velez J, Hail N, Jr, Konopleva M, Zeng Z, Kojima K, Samudio I, Andreeff M. Mitochondrial uncoupling and the reprograming of intermediary metabolism in leukemia cells. Front Oncol. 2013;3:67. doi: 10.3389/fonc.2013.00067. [DOI] [PMC free article] [PubMed] [Google Scholar]
- Wang YX, Rudnicki MA. Satellite cells, the engines of muscle repair. Nat Rev Mol Cell Biol. 2012;13:127–133. doi: 10.1038/nrm3265. [DOI] [PubMed] [Google Scholar]
- Wen X, Wu J, Wang F, Liu B, Huang C, Wei Y. Deconvoluting the role of reactive oxygen species and autophagy in human diseases. Free Radic Biol Med. 2013;65:402–410. doi: 10.1016/j.freeradbiomed.2013.07.013. [DOI] [PubMed] [Google Scholar]
- Yang Z, Klionsky DJ. Eaten alive: a history of macroautophagy. Nat Cell Biol. 2010;12:814–822. doi: 10.1038/ncb0910-814. [DOI] [PMC free article] [PubMed] [Google Scholar]
- Yano T, Kurata S. Intracellular recognition of pathogens and autophagy as an innate immune host defence. J Biochem. 2011;150:143–149. doi: 10.1093/jb/mvr083. [DOI] [PMC free article] [PubMed] [Google Scholar]
- Yilmaz OH, Valdez R, Theisen BK, Guo W, Ferguson DO, Wu H, Morrison SJ. Pten dependence distinguishes haematopoietic stem cells from leukaemia-initiating cells. Nature. 2006;441:475–482. doi: 10.1038/nature04703. [DOI] [PubMed] [Google Scholar]
- Yin H, Price F, Rudnicki MA. Satellite cells and the muscle stem cell niche. Physiol Rev. 2013;93:23–67. doi: 10.1152/physrev.00043.2011. [DOI] [PMC free article] [PubMed] [Google Scholar]
- Zaugg K, Yao Y, Reilly PT, Kannan K, Kiarash R, Mason J, Huang P, Sawyer SK, Fuerth B, Faubert B, Kalliomaki T, Elia A, Luo X, Nadeem V, Bungard D, Yalavarthi S, Growney JD, Wakeham A, Moolani Y, Silvester J, et al. Carnitine palmitoyltransferase 1C promotes cell survival and tumor growth under conditions of metabolic stress. Genes Dev. 2011;25:1041–1051. doi: 10.1101/gad.1987211. [DOI] [PMC free article] [PubMed] [Google Scholar]
- Zhang J, Grindley JC, Yin T, Jayasinghe S, He XC, Ross JT, Haug JS, Rupp D, Porter-Westpfahl KS, Wiedemann LM, Wu H, Li L. PTEN maintains haematopoietic stem cells and acts in lineage choice and leukaemia prevention. Nature. 2006;441:518–522. doi: 10.1038/nature04747. [DOI] [PubMed] [Google Scholar]
- Zhou J, Su P, Wang L, Chen J, Zimmermann M, Genbacev O, Afonja O, Horne MC, Tanaka T, Duan E, Fisher SJ, Liao J, Wang F. mTOR supports long-term self-renewal and suppresses mesoderm and endoderm activities of human embryonic stem cells. Proc Natl Acad Sci U S A. 2009;106:7840–7845. doi: 10.1073/pnas.0901854106. [DOI] [PMC free article] [PubMed] [Google Scholar]
Associated Data
This section collects any data citations, data availability statements, or supplementary materials included in this article.
Supplementary Materials
Supplementary Figures
Review Process File
Source Data for Figure 1C
Source Data for Figure 3C
Source Data for Figure 6C
Source Data for Figure 8