Abstract
Purpose
Quantitative relationships between 9-β-D-arabinofuranosyl-2-fluoroadenine (F-ara-A) concentrations and lymphosuppression have not been reported, but would be useful for regimen design. A population pharmacokinetic/pharmacodynamic model was constructed in this study using data from 41 hematopoietic cell transplant (HCT) recipients conditioned with busulfan in combination with fludarabine (total dose 120 mg/m2, Protocol 1519) or with fludarabine (total dose 250 mg/m2) with rabbit antithymocyte globulin (rATG, Protocol 2041).
Methods
Individual pharmacokinetic parameters were fixed to post-hoc Bayesian estimates, and circulating absolute lymphocyte counts (ALC) were obtained during the three weeks prior to graft infusion. A semi-physiological cell kill model with three lymphocyte transit compartments was applied and aptly characterized the time-course of suppression of circulating ALC by fludarabine administration. Drug and system-specific parameters were estimated using a maximum likelihood expectation maximization algorithm, and the final model was qualified using an internal visual predictive check.
Results
The final model successfully characterized the time-course and variability in ALC. Pharmacodynamic parameters exhibited considerable between subject variability (38.9-211%). The HCT protocol was the only covariate associated with the pharmacodynamic parameters, specifically the lymphocyte kill rate, the transit rate between lymphocyte compartments, and the baseline ALC.
Conclusions
This model can be used to simulate the degree of lymphosuppression for design of future fludarabine-based conditioning regimens.
Keywords: fludarabine, nucleoside analogs, lymphocyte, lymphosuppression, population pharmacodynamics, hematopoietic cell transplantation, adoptive immunotherapy
INTRODUCTION
Fludarabine monophosphate (fludarabine) is a purine nucleoside analog used for first-line treatment of chronic lymphocytic leukemia (CLL), with lymphosuppression as a frequent adverse event. Because of its ability to cause lymphosuppression, fludarabine has become an essential part of many myelolablative and reduced-intensity conditioning regimens administered prior to hematopoietic cell transplantation (HCT).[1] For myeloablative conditioning, there is considerable interest in combining busulfan with fludarabine (BU/FLU), instead of cyclophosphamide (BU/CY), with the intent to improve clinical outcomes for myeloablative HCT recipients. Although initial case series were positive,[2,3] a recent prospective randomized trial found worse event-free, disease-free, and overall survival with BU/FLU compared to the BU/CY regimen.[4]
Considerable interpatient variability in clinical outcomes occurs with the current method of dosing fludarabine based on body surface area (BSA). After administration, nucleotidases rapidly dephosphorylate fludarabine to 9-β-D-arabinofuranosyl-2-fluoroadenine, which is often abbreviated as F-ara-A.[5-7] Subsequently, F-ara-A is transported into the cell and sequentially phosphorylated to its active metabolite, fludarabine triphosphate (F-ara-ATP).[6] Unfortunately, quantitation of F-ara-ATP in T-lymphocytes from pharmacokinetic samples obtained from HCT recipients administered fludarabine-based conditioning has not been feasible to date.[8] Preliminary studies suggest that the relationship between drug effects and the F-ara-A area under the curve (AUC) differs between conditioning regimens.[9,10] We recently developed a F-ara-A population pharmacokinetic model and limited sampling schedule to evaluate F-ara-A pharmacodynamics in HCT recipients receiving fludarabine and total body irradiation (TBI) in the ambulatory clinic.[11] Furthermore, we have demonstrated that there is considerable interpatient variability in the accumulation rate of the active metabolite, F-ara-ATP, in CD4+ and CD8+ lymphocytes.[12] In this work, we created a population pharmacokinetic/pharmacodynamic model of F-ara-A, linking F-ara-A plasma concentrations to suppression of circulating lymphocytes in HCT recipients receiving one of the two BU/FLU conditioning regimens.[9,13]
MATERIALS AND METHODS
Patient population
All patients were diagnosed with hematologic disorders and had adequate renal function (i.e., serum creatinine < 1.5 mg/dL, and creatinine clearance or radioisotope glomerular filtration rate > 60 mL/min/1.73 m2) and liver function (i.e., total bilirubin < 1.5 mg/dL and alanine aminotransferase < 300 units/L). Body weight and BSA were used to calculate doses based on institutional guidelines. Patients received similar antiemetics, antibiotics, and antifungals per Fred Hutchinson Cancer Research Center (FHCRC) Standard Practice Guidelines; corticosteroids were not used as antiemetics with fludarabine. Institutional Review Board (IRB) approval was obtained prior to study conduct and all patients or patient guardians gave informed consent before their participation in the study. Retrospective analysis of this data was IRB approved.
All patients received myeloablative conditioning with targeted busulfan, in which the busulfan concentration at steady state (Css) was targeted to 800-1000 ng/mL using pharmacokinetic sampling and modeling, and fludarabine. Fludarabine was infused through a central venous access catheter over 30 minutes. Fludarabine doses were based on BSA and were not changed based on the time-course of pharmacological biomarkers (e.g., lymphocyte counts).
Patients were enrolled in one of two different treatment protocols, which are described in Table 1. Notably, Protocol 1519 consisted of fludarabine 30 mg/m2/day for four days (days -9 to -6), followed by targeted oral busulfan on days -5 to -2, and no rabbit antithymocyte globulin (rATG, Thymoglobulin®, Genzyme Corporation).[9] The conditioning regimen used in Protocol 2041 consisted of fludarabine 50 mg/m2/day for five days (days -6 to -2), targeted daily intravenous (IV) busulfan on days -5 to -2, and rATG IV at doses of 0.5 mg/kg (actual weight) on day -3, 2.5 mg/kg on day -2, and 3 mg/kg on day -1 for a total dose 6 mg/kg.[13] The first fludarabine dose was administered in the ambulatory clinic; patients were subsequently admitted to allow targeting of IV busulfan doses based on individual pharmacokinetics. The busulfan pharmacokinetic results have been published separately[14] and demonstrated similar success in achieving the target busulfan Css of 800-1000 ng/mL with oral busulfan and IV busulfan.
Table 1.
Patient Characteristicsa
| Protocol 1519 | Protocol 2041 | |
|---|---|---|
| Number of participants | 27 | 14 |
| Age (yr) | 54.4 (12.6 - 63.8) |
51.6 (33.7 - 65.5) |
| Malignancy | ||
| Myelodysplastic syndrome | 15 | 3 |
| Acute myeloid leukemia | 7 | 6 |
| Chronic myeloid leukemia | 4 | 1 |
| Chronic myelomonocytic leukemia | 1 | 1 |
| Myelofibrosis | 0 | 3 |
| HCT conditioning regimen | ||
| Targeted busulfanb | ||
| Initial dose | 1 mg/kg PO every 6 hours | 4 mg/kg IV daily |
| Days of administration | Day -5 to -2 | Day -5 to -2 |
| Target Css (ng/mL) | 800-1000 | 800-1000 |
| Fludarabine | ||
| Daily dose (mg/m2) | 30 | 50 |
| Days of administration | Day -9 to -6 | Day -6 to -2 |
| Total dose (mg/m2) | 120 | 250 |
| rATG dose (total)c | 0 | 6 mg/kgb |
| Absolute lymphocyte count (ALC, / μL) data | ||
| ALC prior to fludarabine administration | 0.93/μL (0.32 -5.3) |
1.41/μL (0.54 - 3.87) |
| ALC nadir prior to graft infusion | 0.07/μL (0 - 0.53) |
0/μL (0 - 0.18) |
| Nadir as percent of baseline ALCd | 6.78% (0 - 53%) |
0% (0 - 7.58%) |
| Area under the effect curve for ALCe | 0.62 μL×hr (0.11 - 4.44) |
1.17 μL×hr (0.44 - 3.24) |
| Day of ALC nadir (Day 0 = day of graft infusion) |
Day -4 (-7 to 0) |
Day -2 (-3 to 0) |
Data presented as number or median (range);
Initial doses weight-based until busulfan doses could be personalized;
rATG 0.5 mg/kg on day -3, 2.5 mg/kg on day -2, and 3 mg/kg on day -1;
ALC/that patient’s average baseline ALC;
(Baseline ALC before fludarabine administration × days to graft infusion) - (area under the curve of actual ALC).
F-ara-A pharmacokinetic sampling and quantification
Blood sampling, F-ara-A quantification, noncompartmental, and population pharmacokinetic modeling have been previously described.[9,11] Briefly, in Protocol 1519, blood samples were scheduled to be drawn immediately before and at the end of the 30 minute infusion (0.5 hr), and 1, 4, 8, 12, and 24 hrs after the start of each fludarabine infusion. Sampling times in the subsequent study (Protocol 2041) differ because fludarabine was administered in an outpatient clinic. For Protocol 2041, blood samples were drawn at 0.5 hr, 5 min after the end of the infusion (0.583 hr), and 1.5, 4.5, 6.5, and 24 hrs after the start of the infusion after the first fludarabine dose only (i.e., day -6).[13] F-ara-A plasma concentrations were quantified using an LC/MS (liquid chromatography-mass spectrometry) assay with a dynamic range from 0.067 to 2.58 mg/L; the inter-day CV% was <10%.[9] The median (range) of the F-ara-A clearance was 9.1 (8-45.2) L/h/m2[9,11] for Protocol 1519 and 7.07 (4.40-10.76) L/h/m2 for Protocol 2041.[13]
Absolute Lymphocyte Counts (ALC)
The ALC were obtained from complete blood counts drawn at varying time points, as specified by the attending physician. The median number of ALC blood draws per participant was 11 (range: 6-13). The ALC were determined using the Sysmex SE-2100 per manufacturer instructions within the College of American Pathologist-accredited clinical laboratory supporting patients treated upon FHCRC protocols. The ALC represent a mixed population of T cells, B cells, and natural killer cells.
Population pharmacokinetic/pharmacodynamic modeling
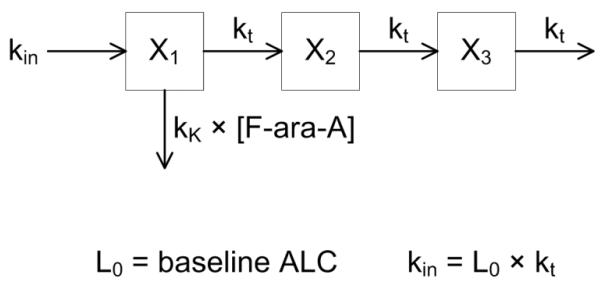
The final pharmacodynamic model is shown in Fig. 1. A series of transit compartments are used to represent lymphocyte proliferation and differentiation; F-ara-A concentrations drive the removal of cells from a precursor compartment, characterized by a second-order cell kill rate constant (kK). F-ara-ATP inhibits cellular DNA synthesis so we logically placed kK early in the proliferation and differentiation cascade. The parameter kK represents the incremental increase in the rate of lymphocyte kill per unit due to F-ara-A, with the lymphocyte killing rate being dependent upon the F-ara-A concentration. Individual F-ara-A pharmacokinetic profiles (Cp) were fixed according to a standard two-compartment model and individual post-hoc Bayesian estimated parameters from our previous population pharmacokinetic modeling of F-ara-A.[11] The pharmacodynamic model is defined by the following differential equations:
with kt as a first-order transit rate constant between lymphocyte cell compartments. The initial condition for each transit compartment was set to the estimated baseline ALC [Xi(0) = L0], and the ALC outcome variable was set to X3. A stationary baseline was assumed; hence the zero-order production rate constant was fixed: kin = L0 · kt.
Fig. 1.
Schematic of the semi-physiological pharmacodynamic model of F-ara-A induced lymphocyte suppression. Model and abbreviations are defined under Methods.
It is acknowledged that F-ara-A is transported into the cell and sequentially phosphorylated to F-ara-ATP, the active metabolite.[6] F-ara-ATP concentrations could not, however, be quantitated in plasma samples obtained after fludarabine administration; therefore, the model used F-ara-A. This model does assume a linear relationship between the cell kill rate constant (kK) and the F-ara-A concentration in lymphocytes. This assumption is supported by ex vivo studies showing a linear relationship between fludarabine-induced apoptosis in CD4+ and CD8+ T-lymphocytes isolated from healthy volunteers that were exposed to 5 to 25 μM of fludarabine (Figure 4a of Woodahl et al).[12] To our knowledge, the linearity of fludarabine-induced apoptosis in natural killer or B cells has not been evaluated.
Fig. 4.
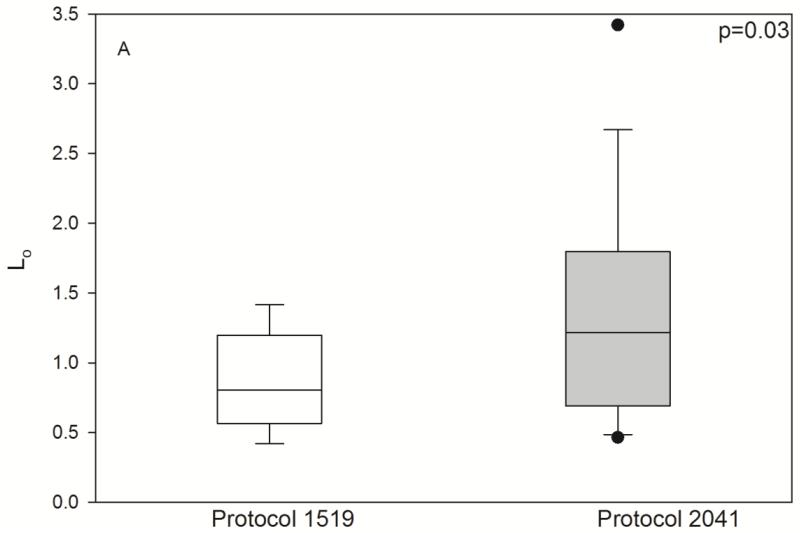
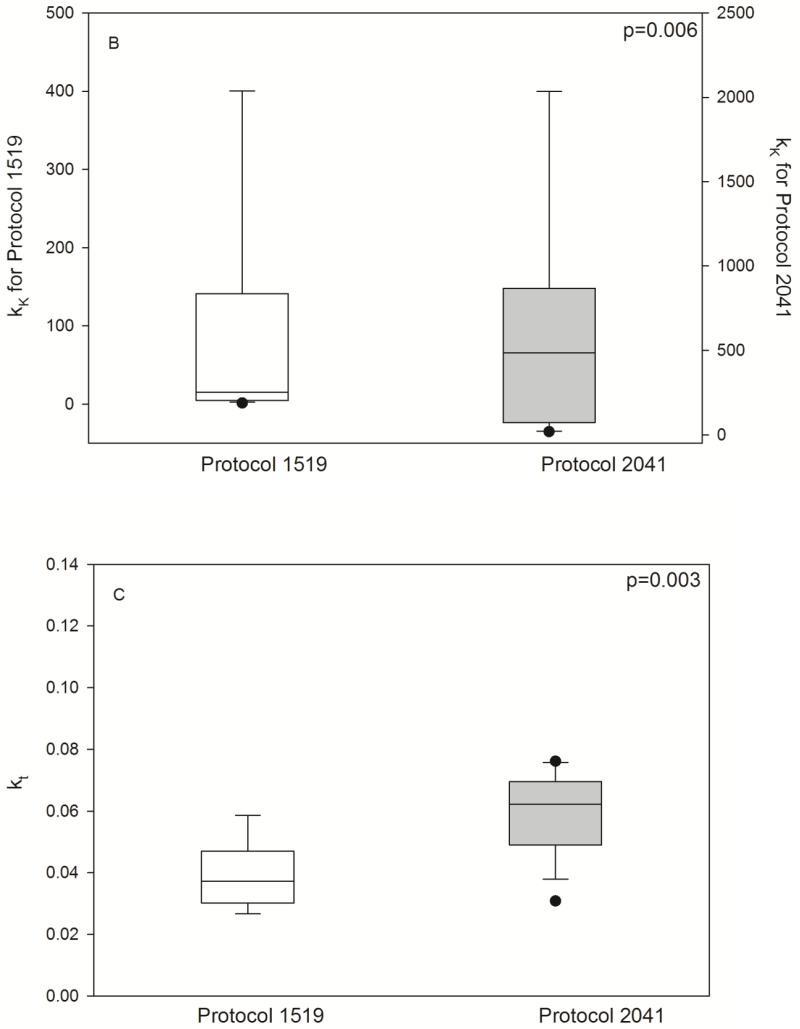
Pharmacodynamic parameters by HCT conditioning regimen. Individual posthoc parameter estimates, shown as box (interquartile range) & whisker (entire range) plot with p-values from nonparametric t-test. L0 (/μL), baseline lymphocyte count; kt (/hr), transit rate between the lymphocyte cell compartments; kK (/hr × (L/mg)), rate of lymphocyte cell kill.
All model parameters were estimated using the maximum likelihood expectation maximization algorithm implemented in ADAPT5 (Biomedical Simulations Resource, Los Angeles, CA). Between-subject variability (BSV) of parameters (L0, kt, kK) was assumed to follow a lognormal distribution and was modeled using a full covariance matrix. Residual variability was defined by an additive plus proportional error variance model. Model development was guided by the objective function (−2×log likelihood) and visual inspection of goodness of fit plots (e.g., observed vs. population and individual predicted values) and residuals.
Subsequently, covariate relationships with posthoc pharmacodynamic parameters were evaluated with a nonparametric t-test (nominal variable) or regression (continuous variables). Covariates included: treatment protocol, which determined the cumulative fludarabine dose, and rATG administration (i.e., fludarabine 120 mg/m2 for Protocol 1519 and fludarabine 250 mg/m2 with rATG for Protocol 2041), BSA, weight (actual or adjusted ideal body weight), age, gender, albumin, calculated creatinine clearance, and blood urea nitrogen. The final pharmacodynamic model was qualified internally using a visual predictive check.[15] We simulated data for 1000 subjects using the final population model; the median and 5th and 95th percentiles of the predicted data were plotted with the original data.
RESULTS
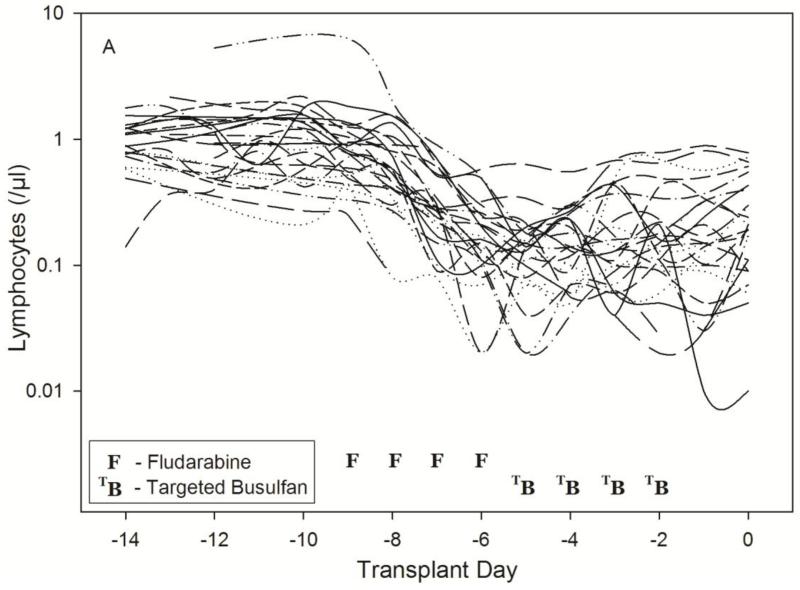
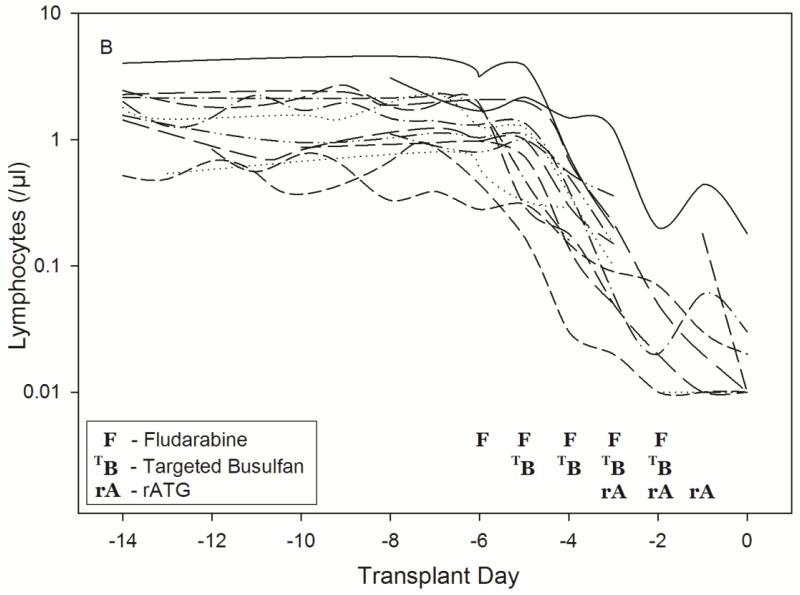
The patient characteristics are listed in Table 1. Substantial lymphosuppression was seen in all patients (Table 1), with a lower ALC nadir in those patients conditioned on Protocol 2041 which had a total fludarabine dose of 250 mg/m2 and rATG. The ALC nadir usually occurred three days after the start of fludarabine administration, confirming a substantial delay in the pharmacological response relative to drug concentrations (Fig. 2). The semi-physiological pharmacodynamic model (Fig. 1) was used to describe the ALC-time profiles after fludarabine administration. Residual unknown variability (RV) was estimated with an additive and proportional error model where variance = (σ1 + σ2 × ALC)2 with σ1 (intercept) = 0.0137 (SE=23.6%) and σ2 (slope) = 0.350 (SE=0.923%).
Fig. 2.
Time-course of lymphosuppression after HCT conditioning with Protocol 1519 (2A) or Protocol 2041 (2B). Full description of each conditioning regimen is listed in Table 1. Infusion of donor graft cells occurred on Day 0.
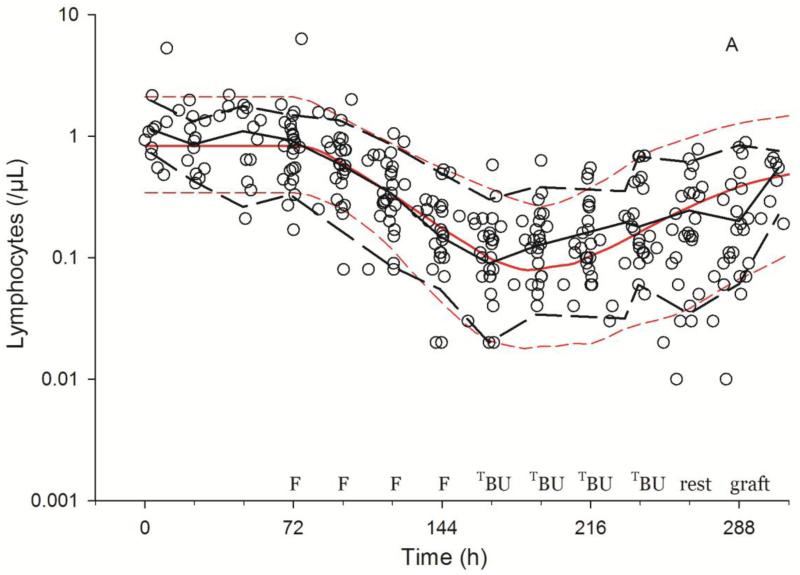
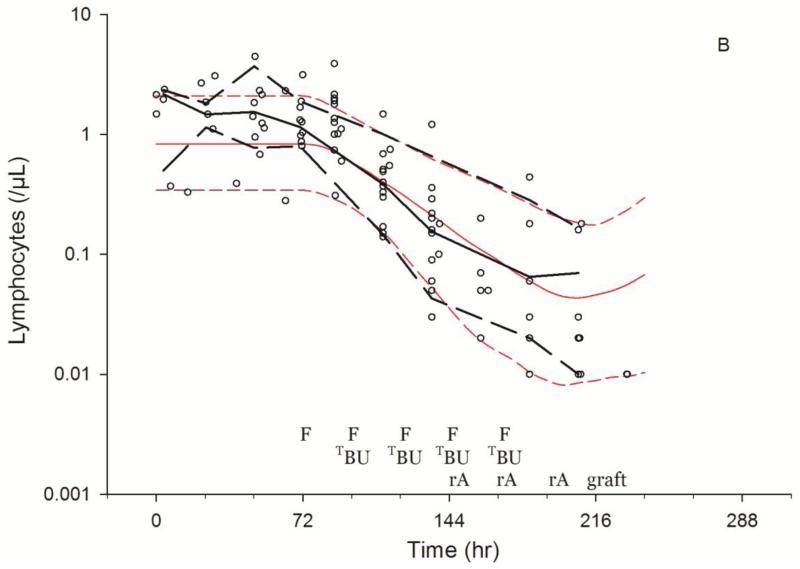
As shown in Fig. 3, the model described the observed ALC-time data well, and the visual predictive check diagnostic plots show no major systematic bias. The estimated pharmacodynamic parameters are presented in Table 2. The median half-life of kt, or the half life of lymphocyte proliferation and differentiation, was 15.7 h (i.e., 0.693/0.0441, Table 2). As expected, the intensity of HCT conditioning regimen influenced the pharmacodynamic parameters, with Protocol 2041 participants exhibiting a more rapid transit between lymphocyte compartments (kt) and greater lymphocyte kill (kK) than those patients conditioned on Protocol 1519 (Fig. 4, box (interquartile range) & whisker (entire range) plot). The parameter kK represents the incremental increase in the rate of lymphocyte kill per unit due to F-ara-A. To show the impact of higher F-ara-A concentrations upon kK, we calculated its corresponding half-life for low vs. high F-ara-A concentrations based on the maximum concentration (Cmax) from these two populations.[11] Specifically, the low Cmax value of F-ara-A, 0.4 mg/L after 30 mg/m2 (Figure 1 in Salinger et al), and the high Cmax of F-ara-A, 2.6 mg/L after 50 mg/m2 (Figure 2 in Salinger et al), correspond to half-lives for kK of 3.4 min and 0.5 min. which shows that higher F-ara-A concentrations lead to a more rapid incremental increase in lymphocyte kill. Inspection of pharmacodynamic parameters with respect to demographic or biochemistry measurements revealed no obvious associations or relationships. Therefore, treatment protocol was the only covariate associated with the difference in pharmacodynamic parameters. The time interval between the last fludarabine dose and donor graft infusion also differed between the protocols and influenced the recipient lymphocyte count at the time of donor graft infusion (Figure 2).
Fig. 3.
Visual predictive checks of lymphosuppression after HCT conditioning with Protocol 1519 (3A) or Protocol 2041 (3B). Black and red lines represent the median (solid) and 5th and 95th percentile (dashed) of the observed and simulated data, respectively. Start of simulations standardized to 72 hrs before fludarabine administration, showing the scheduled times of fludarabine (F), targeted busulfan (TBU), rATG (rA), rest and graft administration.
Table 2.
Estimated pharmacodynamic model parameters
| Structural Model Parameter Values | Between subject variability (BSV, as % CV, on diagonal) and correlation (as Pearson r, off diagonal) |
||||
|---|---|---|---|---|---|
| Parameter | Designation | Parameter Estimate (RSE%) |
Lo | kt | kK |
| Baseline ALC | Lo | 0.954/μL (10.8%) |
59% | ||
| Rate constant - transit of lymphocytes through proliferation and differentiation |
kt | 0.0441/hr (7.39%) |
0.23 | 38.9% | |
| Rate constant – increased lymphocyte kill per unit of F-ara-A concentration |
kK | 30.2 /hr × (L/mg) (41.7%) |
0.42 | 0.26 | 211% |
DISCUSSION
We sought to create a population pharmacodynamic model characterizing the interpatient variability in lymphosuppression after fludarabine administration. A semi-physiological model for ALC, originally used to characterize chemotherapy-induced neutropenia by Friberg et al.,[16] adequately described the lymphosuppression in HCT recipients conditioned with one of two fludarabine-based regimens. The BSV of the pharmacodynamic parameters varied from 38.9% to 211% (Table 2). As expected, the interpatient variability is overall greater than the previously reported BSV of the pharmacokinetic parameters (i.e., 35.1% to 46.1%).[11] As shown in Fig. 2a and 2b, there is considerable variability in the ALC at varying time points around fludarabine administration. The final population model successfully characterized this variability.
Lymphosuppression due to fludarabine has long been of interest.[17] Fludarabine specifically targets lymphocytes, affecting both resting and dividing lymphocytes.[18-20] After administration, fludarabine is dephosphorylated to F-ara-A, which is subsequently transported intracellularly and phosphorylated to the active metabolite, F-ara-ATP. F-ara-ATP inhibits cellular DNA synthesis by two different mechanisms: (1) direct termination of DNA strand elongation after the triphosphate of each drug is incorporated into DNA, and (2) indirect inhibition of DNA synthesis by lowering cellular dNTPs through ribonucleotide reductase inhibition.[21] Ex vivo exposure of human CD4+ and CD8+ cells to pharmacologically-relevant fludarabine concentrations does not result in apoptosis after 4 hrs, although the percentage of viable cells does decline from 24 to 48 hrs.[12] Thus, the time delay between the first fludarabine dose and lymphosuppression (Fig. 2) is not unexpected and was accurately characterized by the modified Friberg model. To date, it is not feasible to quantitate F-ara-ATP concentrations from plasma samples obtained from HCT recipients after fludarabine administration.[8] Therefore, our group pursued two avenues of research to improve fludarabine-based conditioning: 1) creating this pharmacokinetic/dynamic model and 2) developing a novel phenotypic method to assess ex vivo F-ara-ATP accumulation rate in CD4+, CD8+[12] or natural killer[22] cells. Regarding the latter approach, F-ara-ATP accumulation in natural killer cells could only be assessed in healthy volunteers because of difficulties with obtaining sufficient numbers of these cells. Fortunately, this barrier did not exist with CD4+ and CD8+ cells and the accumulation rate of F-ara-ATP could be evaluated. In CD4+ and CD8+ cells, F-ara-ATP accumulation rate is linear over the F-ara-A concentration range of 1.25-10 μM. This range is pharmacologically relevant for the fludarabine doses administered to this cohort (i.e., fludarabine 30 or 50 mg/m2/day, Table 1). The F-ara-ATP accumulation rates were only available for twelve of the fourteen participants in Protocol 2041[13] and were therefore not included in this population pharmacokinetic/dynamic analysis.
Nonlinear mixed effects modeling is increasingly used in the preclinical and clinical development of anticancer drugs, and the semi-mechanistic model of Friberg et al.[16] has been successfully used to describe the relationship between the pharmacokinetics and hematological toxicities for several drugs.[23,24] Only recently, however, has population pharmacokinetic modeling been applied to the optimization of HCT conditioning regimens.[25,26] To our knowledge, this is the first model characterizing the relationship of F-ara-A concentrations with lymphosuppression. This model was created from two separate cohorts of HCT recipients conditioned with the myeloablative conditioning regimen of BU/FLU. The patients treated on both protocols had the same intensity of busulfan conditioning (i.e., target Css of 800-1000 ng/mL), though preclinical data indicate that busulfan has minimal effect upon lymphocytes.[27,28] Protocol 2041 patients, however, received higher daily and total fludarabine doses along with rATG. Thus, it is reassuring that the model indicated differences in the pharmacodynamic parameters (i.e., Lo, kt, and kK) between the two protocols (Fig. 4). This is expected, as Protocol 1519 had a lower fludarabine dose (120 mg/m2) and did not include rATG, while Protocol 2041 had a higher fludarabine dose (250 mg/m2) and included rATG. Greater lymphosuppression is anticipated with the higher fludarabine dose and the addition of rATG. ATG is responsible for numerous effects on the immune system: T-cell inhibition and depletion through complement dependent cell lysis in the blood and apoptosis in the peripheral lymphoid tissues; modulation of molecules involved in leukocyte-endothelium interactions; induction of apoptosis in B-cell lineages; and interference with dendritic cells.[29] In the setting of allogeneic HCT, the inclusion of ATG in the conditioning regimen depletes recipient T-cells and is considered an in vivo form of T-cell depletion[30] that lowers the risk of GVHD.[31] Thus, the population model adequately characterized the lymphosuppression, as the treatment protocol (i.e., fludarabine 120 mg/m2 in Protocol 1519 or fludarabine 250 mg/m2 with rATG in Protocol 2041) was the only covariate associated with the pharmacodynamic parameters (Fig. 3). None of the demographic or biochemical covariates evaluated was associated with the pharmacodynamic parameters. Therefore, further research is required to identify additional sources of interpatient heterogeneity in lymphosuppression, and our integrated pharmacokinetic/pharmacodynamic model will facilitate the evaluation of potential covariate relationships.
Due to its lymphosuppressive properties, fludarabine is increasingly used as part of HCT conditioning regimens.[1] Phase I studies of fludarabine revealed that toxicity to fludarabine monotherapy is not predicted by BSA-based dosing.[32] Although BSA is a covariate of F-ara-A pharmacokinetics, fludarabine dosing based on BSA still results in considerable interpatient variability in the degree of lymphosuppression among patients receiving the same conditioning regimen (Fig. 2). The mean F-ara-A AUC was not associated with the time to neutrophil and platelet engraftment or day +75 T-cell chimerism in Protocol 1519.[9] There was limited power for a pharmacodynamics analysis in Protocol 2041, which stopped accrual after meeting protocol stopping guidelines for nonrelapse mortality. However, F-ara-A AUC was the most promising biomarker for nonrelapse mortality, with a hazard ratio of 5.2 (95% confidence interval of 0.6-46, p=0.10).[13] There are no clear biomarkers for predicting which patients will exhibit severe lymphosuppression. The majority of the research has focused upon recovery of the lymphocyte subpopulations after graft infusion, where ALC is predictive of various clinical outcomes.[33-38] In the context of nonmyeloablative HCT conditioning, mixed chimerism develops in the patient following infusion of the donor cells. Mixed chimerism is a state in which the recipient – termed host –and donor hematological cells co-exist in the blood of the recipient. The extended persistence of mixed chimerism in antige- presenting cells should contribute to stronger alloreactions, which may increase the risk of graft rejection (i.e., host versus graft reaction) or of graft versus host disease. Preclinical models suggest that a pro-inflammatory environment can occur after the immunocompetent residual cells of the HCT recipient interact with subsets of the donor cells (e.g., naïve donor CD4+).[39] The importance of host circulating lymphocytes at the time of graft infusion (i.e., day 0) has not been clearly examined in nonmyeloablative HCT recipients. There has been increasing attention paid to the variability inherent in the pretransplant host immune state,[40] as shown by the large range of baseline lymphocytes. Investigators from the National Cancer Institute have developed a novel strategy of minimizing this variability using targeted lymphocyte depletion (TLD) of the host lymphocytes to facilitate early full donor chimerism in patients receiving reduced intensity conditioning,[40] which is more intensive than nonmyeloablative conditioning. With TLD, the variability in host immune status is reduced by repetitive doses of disease-specific chemotherapy to deplete circulating host T-cells with minimal myelosuppression. [41] The number of chemotherapy cycles administered is based upon reaching a target lymphocyte number. [40] We hypothesize that using pharmacokinetic/dynamic modeling of lymphosuppression after fludarabine administration could be used with or instead of TLD. For fludarabine, however, this issue cannot be evaluated in preclinical HCT models because human lymphocytes are more sensitive to the cytotoxicity of fludarabine than those from mice, rats, or dogs.[42] We hypothesize that the interpatient variability in the suppression of circulating lymphocytes by F-ara-A is a critical element of nonmyeloablative HCT, the success of which is based on achieving a delicate balance between donor and recipient immune systems. Further development and validation our population model in patients conditioned with fludarabine-based conditioning is needed.
In conclusion, an integrated population-based model of fludarabine plasma concentrations and the associated degree of myelosuppression, as quantified by ALC, was successfully constructed. The final model captured the central tendencies and inter-subject variability well; there were, however, no clinical covariates associated with the pharmacodynamic parameters. With additional development, the model may ultimately provide an approach towards individualized fludarabine dosing regimens in HCT conditioning and methodological grounds to investigate whether dosing fludarabine on the basis of pharmacological biomarkers can improve clinical outcomes.
Acknowledgements
Supported by grants from the National Institutes of Health: NHLBI (HL91744, HL36444), NCI (CA15704 (core), 18029, 78902), NIBIB (EB001975), and NIGMS (GM57980)
REFERENCES
- 1.Deeg HJ, Maris MB, Scott BL, Warren EH. Optimization of allogeneic transplant conditioning: not the time for dogma. Leukemia. 2006;20(10):1701–1705. doi: 10.1038/sj.leu.2404327. [DOI] [PubMed] [Google Scholar]
- 2.Bredeson CN, Zhang MJ, Agovi MA, Bacigalupo A, Bahlis NJ, Ballen K, Brown C, Chaudhry MA, Horowitz MM, Kurian S, Quinlan D, Muehlenbien CE, Russell JA, Savoie L, Rizzo JD, Stewart DA. Outcomes following HSCT using fludarabine, busulfan, and thymoglobulin: a matched comparison to allogeneic transplants conditioned with busulfan and cyclophosphamide. Biol Blood Marrow Transplant. 2008;14(9):993–1003. doi: 10.1016/j.bbmt.2008.06.009. doi:10.1016/j.bbmt.2008.06.009. [DOI] [PMC free article] [PubMed] [Google Scholar]
- 3.Andersson BS, de Lima M, Thall PF, Wang X, Couriel D, Korbling M, Roberson S, Giralt S, Pierre B, Russell JA, Shpall EJ, Jones RB, Champlin RE. Once daily i.v. busulfan and fludarabine (i.v. Bu-Flu) compares favorably with i.v. busulfan and cyclophosphamide (i.v. BuCy2) as pretransplant conditioning therapy in AML/MDS. Biol Blood Marrow Transplant. 2008;14(6):672–684. doi: 10.1016/j.bbmt.2008.03.009. [DOI] [PMC free article] [PubMed] [Google Scholar]
- 4.Lee JH, Joo YD, Kim H, Ryoo HM, Kim MK, Lee GW, Lee JH, Lee WS, Park JH, Bae SH, Hyun MS, Kim DY, Kim SD, Min YJ, Lee KH. Randomized trial of myeloablative conditioning regimens: busulfan plus cyclophosphamide versus busulfan plus fludarabine. J Clin Oncol. 2013;31(6):701–709. doi: 10.1200/JCO.2011.40.2362. doi:10.1200/JCO.2011.40.2362. [DOI] [PubMed] [Google Scholar]
- 5.Danhauser L, Plunkett W, Liliemark J, Gandhi V, Iacoboni S, Keating M. Comparison between the plasma and intracellular pharmacology of 1-beta-D-arabinofuranosylcytosine and 9-beta-D-arabinofuranosyl-2-fluoroadenine 5′-monophosphate in patients with relapsed leukemia. Leukemia. 1987;1(9):638–643. [PubMed] [Google Scholar]
- 6.Gandhi V, Plunkett W. Cellular and clinical pharmacology of fludarabine. Clin Pharmacokinet. 2002;41(2):93–103. doi: 10.2165/00003088-200241020-00002. [DOI] [PubMed] [Google Scholar]
- 7.Robak T, Lech-Maranda E, Korycka A, Robak E. Purine nucleoside analogs as immunosuppressive and antineoplastic agents: mechanism of action and clinical activity. Current medicinal chemistry. 2006;13(26):3165–3189. doi: 10.2174/092986706778742918. [DOI] [PubMed] [Google Scholar]
- 8.Kalhorn TF, Ren AG, Slattery JT, McCune JS, Wang J. A highly sensitive high-performance liquid chromatography-mass spectrometry method for quantification of fludarabine triphosphate in leukemic cells. J Chromatogr B Analyt Technol Biomed Life Sci. 2005;820(2):243–250. doi: 10.1016/j.jchromb.2005.03.034. [DOI] [PubMed] [Google Scholar]
- 9.Bornhauser M, Storer B, Slattery JT, Appelbaum FR, Deeg HJ, Hansen J, Martin PJ, McDonald GB, Nichols WG, Radich J, Woolfrey A, Jenke A, Schleyer E, Thiede C, Ehninger G, Anasetti C. Conditioning with fludarabine and targeted busulfan for transplantation of allogeneic hematopoietic stem cells. Blood. 2003;102(3):820–826. doi: 10.1182/blood-2002-11-3567. [DOI] [PubMed] [Google Scholar]
- 10.Long-Boyle JR, Green KG, Brunstein CG, Cao Q, Rogosheske J, Weisdorf DJ, Miller JS, Wagner JE, McGlave PB, Jacobson PA. High fludarabine exposure and relationship with treatment-related mortality after nonmyeloablative hematopoietic cell transplantation. Bone Marrow Transplant. 2011;46(1):20–26. doi: 10.1038/bmt.2010.53. doi:10.1038/bmt.2010.53. [DOI] [PMC free article] [PubMed] [Google Scholar]
- 11.Salinger DH, Blough DK, Vicini P, Anasetti C, O’Donnell PV, Sandmaier BM, McCune JS. A limited sampling schedule to estimate individual pharmacokinetic parameters of fludarabine in hematopoietic cell transplant patients. Clin Cancer Res. 2009;15(16):5280–5287. doi: 10.1158/1078-0432.CCR-09-0427. doi: 10.1158/1078-0432.CCR-09-0427. [DOI] [PMC free article] [PubMed] [Google Scholar]
- 12.Woodahl EL, Wang J, Heimfeld S, Sandmaier BM, O’Donnell PV, Phillips B, Risler L, Blough DK, McCune JS. A novel phenotypic method to determine fludarabine triphosphate accumulation in T-lymphocytes from hematopoietic cell transplantation patients. Cancer Chemother Pharmacol. 2009;63(3):391–401. doi: 10.1007/s00280-008-0748-0. Epub 2008 Apr2009. [DOI] [PMC free article] [PubMed] [Google Scholar]
- 13.McCune JS, Woodahl EL, Furlong T, Storer B, Wang J, Heimfeld S, Deeg HJ, O’Donnell PV. A pilot pharmacologic biomarker study of busulfan and fludarabine in hematopoietic cell transplant recipients. Cancer Chemother Pharmacol. 2012;69(1):263–272. doi: 10.1007/s00280-011-1736-3. doi:10.1007/s00280-011-1736-3. [DOI] [PMC free article] [PubMed] [Google Scholar]
- 14.McCune JS, Holmberg LA. Busulfan in hematopoietic stem cell transplant setting. Expert Opin Drug Metab Toxicol. 2009;5(8):957–969. doi: 10.1517/17425250903107764. doi:10.1517/17425250903107764. [DOI] [PubMed] [Google Scholar]
- 15.Holford NHG. The Visual Predictive Check – Superiority to Standard Diagnostic (Rorschach) Plots; Abstracts of the Annual Meeting of the Population Approach Group in Europe; 2005; p. 14. Abstr 738 [ http://www.page-meeting.org/?abstract=738] [Google Scholar]
- 16.Friberg LE, Freijs A, Sandstrom M, Karlsson MO. Semiphysiological model for the time course of leukocytes after varying schedules of 5-fluorouracil in rats. J Pharmacol Exp Ther. 2000;295(2):734–740. [PubMed] [Google Scholar]
- 17.Cheson BD. Infectious and immunosuppressive complications of purine analog therapy. J Clin Oncol. 1995;13(9):2431–2448. doi: 10.1200/JCO.1995.13.9.2431. [DOI] [PubMed] [Google Scholar]
- 18.Boumpas DT, Tassiulas IO, Fleisher TA, Vaughan E, Piscitelli S, Kim Y, Pucino F, Balow JE, Austin HA. A pilot study of low-dose fludarabine in membranous nephropathy refractory to therapy. Clinical nephrology. 1999;52(2):67–75. [PubMed] [Google Scholar]
- 19.Sandoval A, Consoli U, Plunkett W. Fludarabine-mediated inhibition of nucleotide excision repair induces apoptosis in quiescent human lymphocytes. Clin Cancer Res. 1996;2(10):1731–1741. [PubMed] [Google Scholar]
- 20.Plunkett W, Gandhi V, Huang P, Robertson LE, Yang LY, Gregoire V, Estey E, Keating MJ. Fludarabine: pharmacokinetics, mechanisms of action, and rationales for combination therapies. Semin Oncol. 1993;20(5 Suppl 7):2–12. [PubMed] [Google Scholar]
- 21.Gamberale R, Galmarini CM, Fernandez-Calotti P, Jordheim L, Sanchez-Avalos J, Dumontet C, Geffner J, Giordano M. In vitro susceptibility of CD4+ and CD8+ T cell subsets to fludarabine. Biochem Pharmacol. 2003;66(11):2185–2191. doi: 10.1016/j.bcp.2003.07.008. [DOI] [PubMed] [Google Scholar]
- 22.Woodahl EL, Wang J, Heimfeld S, Sandmaier BM, McCune JS. Intracellular disposition of fludarabine triphosphate in human natural killer cells. Cancer Chemother Pharmacol. 2009;63(5):959–964. doi: 10.1007/s00280-008-0829-0. [DOI] [PMC free article] [PubMed] [Google Scholar]
- 23.Schmitt A, Gladieff L, Laffont CM, Evrard A, Boyer JC, Lansiaux A, Bobin-Dubigeon C, Etienne-Grimaldi MC, Boisdron-Celle M, Mousseau M, Pinguet F, Floquet A, Billaud EM, Durdux C, Le Guellec C, Mazieres J, Lafont T, Ollivier F, Concordet D, Chatelut E. Factors for hematopoietic toxicity of carboplatin: refining the targeting of carboplatin systemic exposure. J Clin Oncol. 2010;28(30):4568–4574. doi: 10.1200/JCO.2010.29.3597. doi:10.1200/JCO.2010.29.3597. [DOI] [PubMed] [Google Scholar]
- 24.Wallin JE, Friberg LE, Karlsson MO. A tool for neutrophil guided dose adaptation in chemotherapy. Computer methods and programs in biomedicine. 2009;93(3):283–291. doi: 10.1016/j.cmpb.2008.10.011. [DOI] [PubMed] [Google Scholar]
- 25.Bleyzac N, Souillet G, Magron P, Janoly A, Martin P, Bertrand Y, Galambrun C, Dai Q, Maire P, Jelliffe RW, Aulagner G. Improved clinical outcome of paediatric bone marrow recipients using a test dose and Bayesian pharmacokinetic individualization of busulfan dosage regimens. Bone Marrow Transplant. 2001;28(8):743–751. doi: 10.1038/sj.bmt.1703207. doi:10.1038/sj.bmt.1703207. [DOI] [PubMed] [Google Scholar]
- 26.McCune JS, Batchelder A, Guthrie KA, Witherspoon R, Appelbaum FR, Phillips B, Vicini P, Salinger DH, McDonald GB. Personalized Dosing of Cyclophosphamide in the Total Body Irradiation-Cyclophosphamide Conditioning Regimen: A Phase II Trial in Patients With Hematologic Malignancy. Clin Pharmacol Ther. 2009;85(6):615–622. doi: 10.1038/clpt.2009.27. [DOI] [PMC free article] [PubMed] [Google Scholar]
- 27.Kolb HJ, Storb R, Weiden PL, Ochs HD, Kolb H, Graham TC, Floersheim GL, Thomas ED. Immunologic, toxicologic and marrow transplantation studies in dogs given dimethyl myleran. Biomedicine. 1974;20(5):341–351. [PubMed] [Google Scholar]
- 28.Santos GW, Tutschka PJ. Marrow transplantation in the busulfan-treated rat: preclinical model of aplastic anemia. J Natl Cancer Inst. 1974;53(6):1781–1785. [PubMed] [Google Scholar]
- 29.Theurich S, Fischmann H, Shimabukuro-Vornhagen A, Chemnitz JM, Holtick U, Scheid C, Skoetz N, von Bergwelt-Baildon M. Polyclonal anti-thymocyte globulins for the prophylaxis of graft-versus-host disease after allogeneic stem cell or bone marrow transplantation in adults. Cochrane Database Syst Rev. 2012;9:CD009159. doi: 10.1002/14651858.CD009159.pub2. doi:10.1002/14651858.CD009159.pub2. [DOI] [PubMed] [Google Scholar]
- 30.Ballen KK. ATG for cord blood transplant: yes or no? Blood. 2014;123(1):7–8. doi: 10.1182/blood-2013-11-537001. doi:10.1182/blood-2013-11-537001. [DOI] [PubMed] [Google Scholar]
- 31.Waller EK, Langston AA, Lonial S, Cherry J, Somani J, Allen AJ, Rosenthal H, Redei I. Pharmacokinetics and pharmacodynamics of anti-thymocyte globulin in recipients of partially HLA-matched blood hematopoietic progenitor cell transplantation. Biol Blood Marrow Transplant. 2003;9(7):460–471. doi: 10.1016/s1083-8791(03)00127-7. [DOI] [PubMed] [Google Scholar]
- 32.Seymour L, Eisenhauer E. A review of dose-limiting events in phase I trials: antimetabolites show unpredictable relationships between dose and toxicity. Cancer Chemother Pharmacol. 2001;47(1):2–10. doi: 10.1007/s002800000228. [DOI] [PubMed] [Google Scholar]
- 33.Le Blanc K, Barrett AJ, Schaffer M, Hagglund H, Ljungman P, Ringden O, Remberger M. Lymphocyte recovery is a major determinant of outcome after matched unrelated myeloablative transplantation for myelogenous malignancies. Biol Blood Marrow Transplant. 2009;15(9):1108–1115. doi: 10.1016/j.bbmt.2009.05.015. [DOI] [PMC free article] [PubMed] [Google Scholar]
- 34.Powles R, Singhal S, Treleaven J, Kulkarni S, Horton C, Mehta J. Identification of patients who may benefit from prophylactic immunotherapy after bone marrow transplantation for acute myeloid leukemia on the basis of lymphocyte recovery early after transplantation. Blood. 1998;91(9):3481–3486. [PubMed] [Google Scholar]
- 35.Kim DH, Kim JG, Sohn SK, Sung WJ, Suh JS, Lee KS, Lee KB. Clinical impact of early absolute lymphocyte count after allogeneic stem cell transplantation. Br J Haematol. 2004;125(2):217–224. doi: 10.1111/j.1365-2141.2004.04891.x. [DOI] [PubMed] [Google Scholar]
- 36.Kumar S, Chen MG, Gastineau DA, Gertz MA, Inwards DJ, Lacy MQ, Tefferi A, Litzow MR. Effect of slow lymphocyte recovery and type of graft-versus-host disease prophylaxis on relapse after allogeneic bone marrow transplantation for acute myelogenous leukemia. Bone Marrow Transplant. 2001;28(10):951–956. doi: 10.1038/sj.bmt.1703262. [DOI] [PubMed] [Google Scholar]
- 37.Lee KH, Choi SJ, Lee JH, Lee JS, Kim WK, Lee KB, Sohn SK, Kim JG, Kim DH, Seol M, Lee YS, Lee JH. Prognostic factors identifiable at the time of onset of acute graft-versus-host disease after allogeneic hematopoietic cell transplantation. Haematologica. 2005;90(7):939–948. [PubMed] [Google Scholar]
- 38.Chakrabarti S, Brown J, Guttridge M, Pamphilon DH, Lankester A, Marks DI. Early lymphocyte recovery is an important determinant of outcome following allogeneic transplantation with CD34+ selected graft and limited T-cell addback. Bone Marrow Transplant. 2003;32(1):23–30. doi: 10.1038/sj.bmt.1704082. [DOI] [PubMed] [Google Scholar]
- 39.Mueller AMS, Florek M, Hadeiba H, Shizuru JA. Interactions Between Donor CD4 Cells and Residual Host Cells After Nonmyeloablative Hematopoietic Stem Cell Transplantation Suppress Hematopoiesis and Lead to Graft Rejection; 52nd Annual American Society of Hematology Meeting; Orlando, FL. 2010; Abstract #75. [Google Scholar]
- 40.Salit RB, Fowler DH, Dean RM, Pavletic SZ, Hakim FT, Steinberg SM, Hardy NT, Sportes C, Gress RE, Bishop MR. Host lymphocyte depletion as a strategy to facilitate early full donor chimerism after reduced-intensity allogeneic stem cell transplantation. Biol Blood Marrow Transplant. 2013;19(10):1509–1513. doi: 10.1016/j.bbmt.2013.08.001. doi:10.1016/j.bbmt.2013.08.001. [DOI] [PMC free article] [PubMed] [Google Scholar]
- 41.Petrus MJ, Williams JF, Eckhaus MA, Gress RE, Fowler DH. An immunoablative regimen of fludarabine and cyclophosphamide prevents fully MHC-mismatched murine marrow graft rejection independent of GVHD. Biol Blood Marrow Transplant. 2000;6(2A):182–189. doi: 10.1016/s1083-8791(00)70041-3. [DOI] [PubMed] [Google Scholar]
- 42.Hassan SB, Haglund C, Aleskog A, Larsson R, Lindhagen E. Primary lymphocytes as predictors for species differences in cytotoxic drug sensitivity. Toxicol In Vitro. 2007;21(6):1174–1181. doi: 10.1016/j.tiv.2007.03.009. doi:10.1016/j.tiv.2007.03.009. [DOI] [PubMed] [Google Scholar]


