

Abstract
Snail family transcription factors are expressed in various stem cell types, but their function in maintaining stem cell identity is unclear. In the adult Drosophila midgut, the Snail homolog Esg is expressed in intestinal stem cells (ISCs) and their transient undifferentiated daughters, termed enteroblasts (EB). We demonstrate here that loss of esg in these progenitor cells causes their rapid differentiation into enterocytes (EC) or entero-endocrine cells (EE). Conversely, forced expression of Esg in intestinal progenitor cells blocks differentiation, locking ISCs in a stem cell state. Cell type-specific transcriptome analysis combined with Dam-ID binding studies identified Esg as a major repressor of differentiation genes in stem and progenitor cells. One critical target of Esg was found to be the POU-domain transcription factor, Pdm1, which is normally expressed specifically in differentiated ECs. Ectopic expression of Pdm1 in progenitor cells was sufficient to drive their differentiation into ECs. Hence, Esg is a critical stem cell determinant that maintains stemness by repressing differentiation-promoting factors, such as Pdm1.
Keywords: Drosophila midgut, enterocyte differentiation, intestinal stem cells, Pdm1, Snail transcription factors
See also: MA Loza-Coll et al (December 2014)
Introduction
Great progress has been made in understanding how external cues, provided by signaling molecules emanating from stem cell niches, instruct stem cells to either self-renew or differentiate. However, much remains to be learned about the transcriptional programs that define and maintain stem cell identity. Ultimate proof for the potency of transcription factors in controlling stemness comes from work with induced pluripotent stem cells (iPS cells), wherein addition of four factors (Oct4, Sox2, Klf4 and C-Myc) is sufficient to confer stem identity to terminally differentiated cells of many types (Takahashi & Yamanaka, 2006). However, it is less clear how stem cell identities are maintained in vivo.
The Drosophila adult midgut is an excellent model in which to address how stem cell identity is defined and maintained. Similar to the mammalian small intestine and colon, the fly's midgut is maintained by intestinal stem cells (ISC) that divide to give rise to new ISCs and transient cells called enteroblasts (EB) in a near 50/50 ratio. The enteroblast can then differentiate to give rise to either an absorptive enterocyte (EC) or secretory entero-endocrine cell (EE) (Micchelli & Perrimon, 2006; Ohlstein & Spradling, 2006). This decision depends on Notch signaling: ISCs produce the Notch ligand Delta, which activates a Notch-dependent transcriptional program in the EB leading to its differentiation into an EC (Ohlstein & Spradling, 2006, 2007; Bardin et al, 2010). Loss of Notch signaling leads to expansion of Delta-positive proliferative stem-like cells as well as postmitotic EEs. Many conserved signaling pathways regulate ISC growth and division during homeostasis and under stress (Jiang & Edgar, 2011; Lucchetta & Ohlstein, 2012). When the midgut is damaged by stresses such as enteric infection, EGFR and Jak/Stat ligands are induced in the ECs and the visceral muscle (VM) surrounding the gut epithelium. These stimulate ISCs to respond to increase their division rate and differentiation speed (Buchon et al, 2009a,b; Jiang et al, 2009, 2011).
The first two studies of Drosophila midgut stem cells described that the progenitor cell compartment (ISCs and EBs) is marked by expression of the zinc-finger transcription factor escargot (Esg). Esg is expressed in both Delta-positive ISCs and transient committed progenitors (EBs) positive for the Notch reporter gene Su(H)-GBE-LacZ. esg mRNA is highly expressed in these cell types, but not in any other cell type of the adult midgut (Supplementary Table S1; Micchelli & Perrimon, 2006; Ohlstein & Spradling, 2006; Toledano et al, 2012). However, the function of esg in these progenitor cells has thus far not been reported. The first esg mutant was found in a screen for embryonic lethal mutants and was identified as a Snail-related transcription factor (Whiteley et al, 1992). Escargot, snail and worniu comprise the three Drosophila members of the Snail-related family of zinc-finger transcription factors (Nieto, 2002). Esg is essential for the maintenance of diploidy in larval imaginal disc cells (Hayashi et al, 1993; Fuse et al, 1994), and it plays a critical role in tracheal tube formation through upregulation of the Drosophila E-cadherin, Shotgun (Tanaka-Matakatsu et al, 1996).
Intriguingly, the mammalian Snail family member, Snai1, acts as a transcriptional repressor of E-cadherin expression in mouse and human fibroblasts, and overexpression of Snai1 can trigger an epithelial-mesenchymal transition (EMT) when overexpressed (Batlle et al, 2000; Cano et al, 2000). In addition, the Snail paralog Slug marks a stem cell population in the mouse mammary gland, and mammary epithelial cells (MECs) with high levels of Slug are more clonogenic than Slug-negative MECs (Guo et al, 2012), suggesting a stem cell maintenance function. In fact, there is increasing evidence that cells undergoing EMT gain stem cell-like characteristics (Mani et al, 2008). Hence, Snail family members act as important regulators of both the mesenchymal and the stem cell fate. However, how exactly Snail family members exert their role in maintaining stemness and what their target genes are in different adult stem cell contexts remains largely unexplored. We show here that Esg is essential to maintain stem cell identity and suppress differentiation in the Drosophila ISC lineage. Esg does this by repressing the transcription of differentiation-promoting genes such as Pdm1 and functions in a transcriptional network with Notch signaling to regulate stem cell maintenance and differentiation in the intestinal stem cell compartment.
Results
Loss of esg causes loss of midgut stem and progenitor cells
To investigate the function of Esg in the adult Drosophila midgut, we used the MARCM technique to generate clones homozygous for the null allele esgG66B (Whiteley et al, 1992). With the MARCM method, null mutant clones of esg are generated in ISCs by heat-shock and mutant cells are positively marked by GFP (Lee & Luo, 1999). Subsequently, these MARCM clones were allowed to grow for 4–7 days and stained for the ISC marker Delta (Fig1A and B). Control clones contained one or more Delta-positive ISCs (Fig1A, arrows), but esgG66B mutant clones contained virtually no Delta-positive ISCs, although ISCs could often be found adjacent to the clones (Fig1B, arrowhead, quantification in C). Hence, loss of esg led to a loss of Delta-positive ISCs.
Figure 1. Loss of esg leads to a loss of ISCs and regenerative capacity in the Drosophila midgut.

- A, B ISCs are absent from esgG66B MARCM clones. Control clones have 1 or more Delta+ ISCs in the clonal area (A–A'', arrows). esgG66B clones do not contain GFP/Delta-marked ISCs, although there are GFP−/Delta+ ISCs neighboring the clone (B–B'', arrowhead). Scale bars, 50 μm.
- C Quantification of Delta+ cells in clones from (A, B). n = 627 cells/35 clones for FRT40A, n = 374 cells/81 clones for FRT40A esgG66B clones, P < 0.0001, Student's t-test with Welch's correction.
- D Kaplan–Meier survival curve of flies on P. entomophilae-containing food. esg-F/O clones expressing UAS-GFP alone, UAS-esg or esgRNAi were induced for 1 week before infection with P. entomophilae, n = 30 for each genotype.
- E, F Representative images from esg-F/O midguts expressing UAS-GFP alone (control) or expressing esgRNAi 2 days after P. entomophilae infection. Samples were stained for GFP and pH3S10 (arrows). Scale bars, 50 μm.
- G Quantification of the number of pH3-positive cells/midgut of the guts in (E, F).
- H–J FACS profiles of w1118, esgts > UAS-GFP and esgts > UAS-GFP, UAS-esgRNAi animals. The GFP-positive population makes up 5% of the cells in esgts > UAS-GFP animals (I). This population is completely absent from midguts expressing esgRNAi (J) similar to w1118 flies not expressing any UAS-GFP (H).
Source data are available online for this figure.
To confirm this, we depleted esg in ISCs and EBs by RNAi expressed under the control of the conditional, temperature-sensitive esg-Gal4 UAS-GFP tub-Gal80ts system (hereafter referred to as esgts). In controls, esg-positive progenitor cell nests were evenly dispersed throughout the midgut epithelium (Supplementary Fig S1A and C). Progenitor cell nests are defined by: (i) expression of esg (Supplementary Fig S1A and C); (ii) expression of the Notch ligand Delta in the ISC (Fig1A); and (iii) increased presence of Drosophila E-cadherin (DE-cadherin, shg), especially at the ISC-EB junction (Supplementary Fig S1C, arrows). Upon 4 days of esgRNAi induction, the majority of GFP+ cells had disappeared from the midgut (Supplementary Fig S1B and D). The loss of small GFP+ cells was accompanied by loss of strongly DE-cadherin-positive progenitor cell nests (Supplementary Fig S1D–D'', arrows). Flow cytometry (Dutta et al, 2013) showed that the GFP-positive progenitor population in control (esgts > UAS-GFP) midguts typically accounted for 5% of total cells (Fig1I). We noted an almost complete disappearance of this GFP-positive population in esgts > UAS-GFP, esgRNAi animals (Fig1J). Hence, loss of esg leads to a loss of the stem/progenitor cell population, demonstrating that Esg is required for their maintenance.
If Esg loss depletes ISCs, it should compromise regenerative growth of the intestine. To test this, we used the intestinal lineage-tracing system esg-FlipOut (esg-F/O) (Jiang et al, 2009). This system uses the temperature-inducible expression of a FLPase which will activate a constitutive Act>STOP>Gal4 driver by removing the STOP cassette flanked by FRT sites. This system was used to drive expression of GFP and esgRNAi in both progenitor cells and their descendant progeny (ECs and EEs) for 1 week before exposing animals to the pathogenic bacterium Pseudomonas entomophila (P.e.) (see Fig2F for an overview of the esg-F/O system). Indeed, following depletion of esg, all of the animals died from infection within 4 days, whereas 90% of controls survived to this timepoint (Fig1D). Animals expressing esgRNAi had dramatically shortened, disorganized midguts that had few or no pH3-positive cells compared to control midguts 2 days after P.e. infection (Fig1E and F, quantification in G). Whereas control midguts showed an almost complete renewal of midgut tissue after 2 days of P.e. infection based on their ubiquitous expression of GFP, esgRNAi midguts still had many GFP-negative cells, highlighting the inability of the midgut to self-renew upon infection (Fig1E and F). Altogether, these data further support that loss of esg leads to loss of the Delta-positive, E-cadherin-positive ISC population in the midgut.
Figure 2. Progenitor cells are lost through differentiation upon loss of esg.

- A–D esgG66 null mutant MARCM clones are solely composed of both Pros+ enteroendocrine (EE) cells (B–B', arrow) and Pdm1+ enterocytes (EC) (D–D', outline, compare with control clones in (A, C). Scale bars, 50 μm.
- E Integrated DAPI intensity/nucleus for Pros+ EE cells in esgG66B null mutant clones and the surrounding wild-type EE cells. n = 320 for WT, n = 35 for esgG66B. P < 0.0001, Student's t-test.
- F Diagram outlining the esg-F/O system. (left) At 18°C, the system is held inactive by the temperature-sensitive suppressor Gal80ts. (middle) 1-day shift to 29°C inactivates the Gal80ts, and esg-Gal4 will drive the expression of UAS-GFP and UAS-Flp, thereby activating the Act > STOP > Gal4 cassette. (right) After 6 days, the F/O system will express UAS-GFP in both the progenitor cells and the progeny from these progenitors due to the activated Act-Gal4 driver.
- G, H esg-F/O clones induced for 1 day show that expression of esgRNAi leads to a rapid loss of progenitor morphology and the appearance of GFP-positive/Pdm1-positive small EC cells (H, arrows, compare to control in G). Scale bars, 50 μm.
- I Quantification of GFP-positive/Pdm1-positive cells/ROI in (G, H). P < 0.0001, Student's t-test.
- J Quantification of total number of GFP-positive cells/ROI in (G, H), P = 0.097, Student's t-test.
Source data are available online for this figure.
Loss of esg drives stem cells to differentiate
Our results led us to hypothesize that loss of esg resulted in stem cell loss through precocious differentiation, rather than cell death. To test this, we generated esgG66B mutant MARCM clones for 4, 7 or 14 days and stained for the EE marker Prospero (Fig2A and B), or the EC marker nubbin (Pdm1), a POU-domain transcription factor specifically expressed in mature ECs (Lee et al, 2009; Dantoft et al, 2013) (Fig2C and D). Whereas control clones contained ECs, EEs and also Delta-positive ISCs (Figs1A and 2A and C), esgG66B mutant clones consisted exclusively of differentiated ECs and EEs (Fig2B and D). Thus, loss of esg leads to precocious differentiation into either EC or EE cell types, with an accompanying loss of Delta-positive ISCs. Similar results were observed using the esg-F/O system to clonally express esgRNAi. We quantified the differentiation phenotype that occurred upon loss of esg by using the esg-F/O system to express esgRNAi (Fig2F–H). Strikingly, after 1 day of induction, the esgRNAi cell clones consisted mostly of Pdm1-positive ECs (Fig2H, arrows). Control clones at this timepoint consisted mostly of Pdm1-negative progenitor cells (Fig2G, quantification in I). Importantly, the total number of GFP-positive cells for each region of interest (ROI) that was analyzed did not differ significantly between control and esgRNAi animals, indicating that stem/progenitor cells were not lost through cell death (Fig2J).
Previous studies demonstrated that loss of esg in larvae leads to a loss of diploidy in abdominal histoblasts (abdominal epithelial progenitor cells) (Fuse et al, 1994). Hence, we considered the possibility that the main function of Esg in the ISC/EB population might be to restrain polyploidization, a normal aspect of EC differentiation. However, by staining for the entero-endocrine (EE) cell marker Prospero (Pros), we determined that there were also Pros-positive EE cells present in many of the esgG66B mutant clones (Fig2A and B). EE cells normally differentiate with a 2C DNA content (Zielke et al, 2014). However, we noticed an increase in EE nuclear size inside several of the esgG66B MARCM clones. Quantification of the DNA content of differentiated Pros-positive EEs in wild-type and esgG66B mutant tissue revealed that esgG66B EE cells had, on average, doubled their DNA content compared to WT EE cells (Fig2E) and thus were mostly in G2. However, these EE cells did not become polyploid like the fully matured EC cells within the clone (compare Fig2A and B). Thus, Esg acts as a general repressor of cell differentiation, but not as a specific repressor of polyploidization in the ISC/EB compartment.
To precisely delineate the cell type in which Esg is required to repress differentiation, we expressed esgRNAi specifically in EBs using the Su(H)GBE-Gal4 UAS-GFP tub-Gal80ts driver (Su(H)ts), a Notch-responsive transgene combination that is highly active in EBs (Furriols & Bray, 2001; Zeng et al, 2010). While control Su(H)-GBE-positive EBs were mostly small, spindle-shaped cells situated adjacent to a Delta-expressing ISC (Supplementary Fig S2A and D arrows), esgRNAi expression transformed most EBs into Pdm1-positive cells with a larger (likely polyploid) nucleus, strongly resembling ECs (Supplementary Fig S2B, arrowheads, quantification in C). GFP expression was also lost from these cells (compare Supplementary Fig S2D with E). Knockdown of esg in the EB population for 7 days led to a threefold reduction in the number of Su(H)GBE-positive cells as determined by flow cytometry (Supplementary Fig S2F–H). These results indicate that esg knockdown in EBs that have received the Notch signal accelerates their differentiation into ECs, suggesting a role for Esg in the maintenance of the transient EB state.
Enforced Esg expression in ISCs blocks differentiation
If esg loss from progenitor cells results in precocious differentiation, locking Esg expression “on” in this compartment might, conversely, inhibit differentiation. To test this possibility, we used the esg-F/O or MARCM systems to clonally express Esg (UAS-esg) in ISCs and EBs. In these cases, Esg expression is driven by the Actin 5C or tubulin promoters, which are constitutive in all cell types and cannot be switched off. Whereas control MARCM clones consisted of many Pdm1+ ECs and a few Pros+ EEs (Fig3A and C, arrows), MARCM clones expressing Esg contained only small, diploid, Pdm1− and Pros− cells (Fig3B and D, arrowheads, quantification in E). Similar results were obtained using the esg-F/O and esgts systems to drive UAS-esg expression (data not shown). Upon P.e. infection, esgts animals overexpressing UAS-esg in their progenitor cells could still respond by increasing the ISC division rate (Fig3F). However, an increased mortality was observed upon P.e. infection (Fig1D), most likely because ISCs could not differentiate into ECs, and therefore, the damaged epithelium could not be replenished. Some cells within esg-F/O > UAS-esg clones were positive for Delta (Fig3H, arrows, Supplementary Fig S3A, B and E), but other, adjacent cells expressed the Notch-responsive Su(H)-GBE-LacZ reporter (Supplementary Fig S3C, D and F). Overexpression of Esg in EBs increased the number of GFP-positive EBs (compare Supplementary Fig S2I with G). This increase in EBs was also seen in esg-F/O > UAS-esg clones expressing the Su(H)-GBE-lacZ reporter (Supplementary Fig S3F). In summary, cells in clones with Esg expression locked “on” retain either ISC or EB identity and do not differentiate.
Figure 3. Overexpression of Esg leads to a block in differentiation.

- A–D MARCM FRT82B clones expressing UAS-esg. Control (FRT82B) clones are large and contain many polyploid Pdm1+ ECs 2 weeks after clonal induction (A, arrows), whereas clones expressing UAS-esg only contain small Pdm1− diploid cells (B, arrows). UAS-esg MARCM clones do not contain Pros+ cells (D–D') compared with control (C–C', arrows). Scale bars, 50 μm.
- E Quantification of clones in (A, B). GFP-positive/Pdm1-positive cells within each clone were counted 2 weeks after clonal induction. n = 22 clones for control (FRT80B), n = 46 clones for UAS-esg FRT80B, P < 0.0001, Mann–Whitney U-test.
- F Quantification of mitoses/midgut in control, esgRNAi and UAS-esg animals.
- G, H Both control FRT80B (G–G') and UAS-esg FRT80B (H–H') MARCM clones contain Delta-positive ISCs. Scale bars, 50 μm.
Source data are available online for this figure.
Esg represses differentiation genes in progenitor cells
To gain a comprehensive picture of how Esg controls stem cell identity in the midgut, we generated whole-genome RNA-Seq profiles of sorted Esg-positive cells overexpressing Esg or expressing esgRNAi and compared them to controls, as well as to expression profiles of each normal midgut cell type (Supplementary Table S1) (Dutta et al, 2013) (Materials and Methods and Supplementary Materials and Methods). Upon depletion of esg by RNAi, 268 genes were downregulated and 382 genes were significantly upregulated (> twofold change, 95% CI, Fig4A and Supplementary Table S2). In contrast, very few genes were differentially regulated following overexpression of Esg in esg+ cells (Supplementary Table S2). To gain an overview of the variance between the different samples from the different genotypes used in our analysis, we used principal component analysis (PCA). This showed that the esgRNAi samples distinctly clustered away from control and UAS-esg (Fig4B), whereas control and UAS-esg samples clustered nearby each other. Hence, overexpression on Esg in the ISC/EB compartment for 1 day did not lead to significant changes in gene expression, whereas depletion of Esg caused a significant shift in the transcriptional landscape of these progenitor cells. Strikingly, many of the genes that were significantly upregulated following esg knockdown were genes normally expressed in ECs and EEs. These included the EC markers nubbin (Pdm1), Myo61F (brush border Myosin) and big bang (bbg) (Bonnay et al, 2013) as well as the EE markers prospero, tachykinin, asense and Rab3 (Fig4A and Supplementary Tables S1 and S2). Several established Notch target genes, such as E(Spl) genes and hairy, went up upon esgRNAi (Supplementary Table S2). Conversely, many reported stem/progenitor cell-specific genes were downregulated upon esgRNAi. These included miranda, Egfr and its ligand spitz, the Jak/Stat receptor dome/Domeless, LIMK and esg itself (Jiang et al, 2009, 2011; Bardin et al, 2010; Lourenco et al, 2013) (Fig4A). Gene Ontology (GO)-term analysis of the genes downregulated upon esgRNAi yielded many significantly enriched GO-terms associated with cell fate specification, cell signaling, and wing disc and tracheal development (Supplementary Table S3). This is consistent with previous work, which demonstrated that Esg plays a crucial role in imaginal disc and tracheal development (Fuse et al, 1994, 1996; Samakovlis et al, 1996; Tanaka-Matakatsu et al, 1996). Few GO-terms were significantly enriched in the upregulated gene set. However, we found a strong overrepresentation of genes involved in septate junction formation (Supplementary Table S3). Both Snakeskin (Ssk) and mesh are highly upregulated upon esgRNAi (30-fold and 43-fold, respectively). It was shown recently that these smooth septate junction structures are essential in ECs for intestinal barrier function (Izumi et al, 2012; Yanagihashi et al, 2012). Hence, upregulation of septate junction components might be an important early step in EC differentiation, triggered by loss of Esg.
Figure 4. Transcriptome and Dam-ID analysis reveals that Esg acts as a suppressor of differentiation in the stem cell compartment.
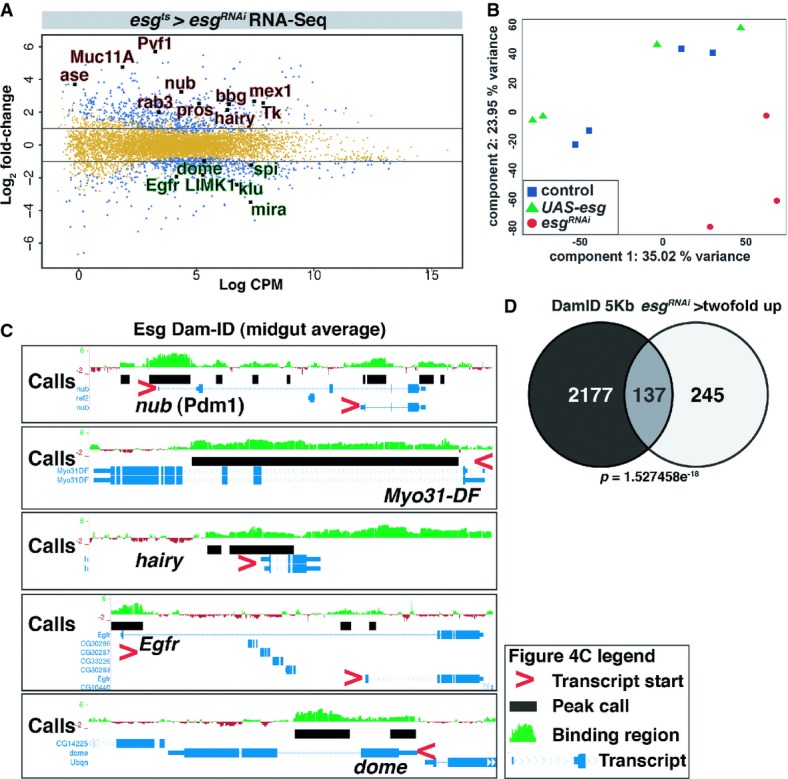
- Scatter plot showing the genes differentially regulated upon esgRNAi. Y-axis shows log2 fold-change ratio. X-axis represents the log2 counts per million read (CPM) value. Blue dots represent genes > twofold change with P < 0.05; yellow dots represent genes with < twofold change and/or P > 0.05.
- Principal component analysis (PCA) of the RNA-seq samples. Note that esgRNAi samples (red) cluster away from control (UAS-GFP, blue) and UAS-esg (green) samples.
- Esg-Dam binding profiles for nubbin/Pdm1, Myo31-DF/MyoIA, hairy, Egfr and dome loci. Average peak intensity calculated from 3 repeats in green. Black boxes represent EBR calls. Associated genes/transcripts are in blue. Red arrowheads indicate the gene polarity of the different transcripts from these loci.
- Venn diagrams showing the overlap between genes bound by Esg-Dam (left) and genes > twofold downregulated and genes upregulated > twofold upon esgRNAi in ISC/EB with esgts (right). The P-value for the overlap was calculated using the hypergeometric probability function.
The loss of stem cell and upregulation of differentiation gene expression could be a direct effect of Esg on the promoters of its target genes. Alternatively, these changes might reflect indirect effects of losing Esg, namely transcriptional changes affected as an aspect of differentiation. To distinguish between these possibilities and define direct midgut targets of Esg, we used genome-wide binding data for Esg obtained by in vivo Dam-ID (Loza-Coll et al, 2014). The Dam-ID technique uses a DNA methylase fused to a DNA-binding factor of interest (i.e., Esg) that results in enriched DNA methylation at places in the genome where the Esg-Dam fusion protein binds (van Steensel & Henikoff, 2000). An Esg-Dam fusion protein was expressed in the entire midgut, and enriched Esg-binding regions (EBRs) were defined by comparing Esg-Dam methylation profiles to a Dam-alone control (see Materials and Methods). We defined genes that had 1 or more EBRs within 5 kb of a gene in 2 of 3 DamID repeats as binding targets. There was a high degree of overlap between Esg-Dam-bound genes and genes upregulated upon esgRNAi (Fig4D). We used the hypergeometric distribution to determine the significance of this overlap, that is, we determined whether the high degree of overlap could arise by chance alone when comparing these large datasets (Fury et al, 2006; see Supplementary Materials and Methods). This showed that the overlap was highly significant (Fig4D); hence, the set of genes that are present in the overlap are likely to be directly regulated by Esg. Esg-Dam binding targets included nubbin (Pdm1), Myo31-DF (MyoIA), the Notch effector gene hairy, the EGF receptor Egfr and the cytokine receptor dome (Domeless). The binding profiles for these target gene loci showed that most have a strong enrichment for Esg-Dam binding at the 5′ UTR of their transcript isoforms, that is, close to the transcription start site (Fig4C). Hence, Esg acts in progenitor cells to repress differentiation genes and promote stem cell gene expression and in many cases binds the affected target loci.
Ectopic expression of Esg in enterocytes triggers hallmarks of de-differentiation
Our observations support a model in which stem and progenitor cells require Esg to maintain their identity, whereas Esg function needs to be extinguished for the de-repression of differentiation genes in order for differentiation to proceed. To further test this model, we ectopically expressed Esg in differentiated ECs using the EC-specific, temperature-inducible driver MyoIA-Gal4, UAS-GFP, tub-Gal80ts (MyoIAts). MyoIA encodes a gut-specific myosin that is a component of the apical brush border and is found only in differentiated enterocytes. Forced expression of Esg in ECs had dramatic effects on intestinal homeostasis. First, UAS-GFP expression driven by MyoIA-Gal4 was lost from ECs within 24 h of Esg induction (Fig5A–C). Furthermore, these midguts displayed an increased mitotic index (Supplementary Fig S4A and C, quantification in G) and increased expression of Upd3 cytokines (Fig5F and Supplementary Fig S4E and F), which occurs as a regenerative response to EC loss (Buchon et al, 2009a; Jiang et al, 2009). Close inspection revealed that the loss of GFP expression was not, however, solely due to a loss of GFP-positive ECs. Indeed, many large polyploid EC-like cells with reduced or undetectable GFP remained in the gut for 1–3 days following induction of Esg in ECs. Co-expression of the apoptosis inhibitor dIAP with Esg could partially rescue EC loss and the concomitant mitotic response. However, the level of GFP expression in MyoIAts > UAS-esg UAS-dIAP animals still decreased dramatically following 24 hours of transgene induction (Fig5C, arrows). These GFP-negative ECs in MyoIAts > UAS-esg UAS-dIAP animals appeared to be normally structured and similar in shape with wild-type ECs (Fig5A and C, arrows).
Figure 5. Overexpression of Esg in differentiated enterocytes leads to a loss of EC-specific differentiation gene expression.

- A–C MyoIAts > UAS-esg and MyoIAts > UAS-esg; UAS-dIAP animals show a loss of GFP after 24 h of induction, even in ECs with a wild-type structure (B–B' and C–C', arrows, see A–A' for control). Cells are co-stained with Armadillo (β-catenin) staining (red), which outlines the cell borders. Scale bars, 50 μm.
- D Scatter plot showing the genes differentially expressed between MyoIAts > UAS-esg and control.
- E, F qRT-PCR analysis for the enterocyte marker Pdm1 (E) and the Unpaired 3 (Upd3) cytokine (F).
- G Expression heatmap of representative EC differentiation genes from MyoIAts > UAS-esg and esgts > esgRNAi RNA-Seq samples.
- H Venn diagram showing the overlaps between Esg-Dam midgut target genes, genes upregulated upon esgts > esgRNAi expression and genes downregulated in MyoIAts > UAS-esg midguts. The P-value for the overlap was calculated using the hypergeometric probability function.
Since MyoIA and Pdm1 were identified as Esg-DamID targets (Fig4C), we hypothesized that ectopic expression of Esg in ECs might repress these differentiation markers. To further test this, we performed RNA-Seq on whole midguts that expressed either Esg alone or in combination with dIAP from the MyoIAts driver for 24 hours. In both cases, Esg repressed the expression of a myriad of differentiation genes, including known EC markers such as MyoIA and Pdm1 (Fig5D and G). Various genes involved in midgut immune recognition (PGRP-SC2, PGRP-LE, bbg) and smooth septate junction formation (mesh, cora, Ssk) were also significantly downregulated (Fig5D and G, and Supplementary Tables S4 and S5) (Izumi et al, 2012; Bonnay et al, 2013; Buchon et al, 2013). Furthermore, many digestive enzymes (Trypsins, Amylases, Lysozymes) as well as transporter proteins were significantly downregulated. GO-term enrichment analysis showed significant (P < 0.05) enrichment for GO-terms such as peptidase activity (e.g., α,β,ε,ι-Trypsin, 8.5% in MyoIAts > UAS-esg, > twofold down genes VS 4.3% in the genome), as well as a high enrichment for genes with transmembrane transport activity (12.3 Versus 3.2%) and hydrolase activity (e.g., Mal-A1, Mal-A8, LysB, 23.7 versus 14.1%) (Supplementary Table S5). On the other hand, upregulated genes included many cell cycle genes as well as the stem cell marker gene Delta (Fig5D), and cell cycle-related GO-terms were highly enriched in the upregulated gene set, in line with the increased mitotic activity in these guts at this timepoint (Supplementary Fig S4G). Interestingly, many genes that went down significantly upon Esg overexpression in ECs were upregulated in esgts > esgRNAi RNA samples (Fig5G). We confirmed repression of the EC marker Pdm1 and upregulation of Upd3 by qRT-PCR (Fig 5E and F). Thus, ectopic expression of Esg in ECs results in transcriptional repression of EC-specific differentiation genes such as MyoIA and Pdm1 as well as a general loss of expression for genes important in the metabolic functions of the absorptive enterocytes.
After longer induction of Esg expression in ECs, midguts shortened and animal viability declined. Whereas MyoIAts > UAS-esg midguts lost gut structure and integrity after 5 days of induction (Supplementary Fig S4I), midguts from MyoIAts > UAS-esg UAS-dIAP animals retained a comparatively normal morphology (Supplementary Fig S4J) and had extended long-term survival, albeit still well below that of controls (Supplementary Fig S4K). Thus, ectopic expression of Esg in differentiated ECs had a detrimental effect on gut homeostasis, which was only partially relieved by inhibition of the apoptotic pathway.
To further distinguish direct effects of Esg on gene transcription from indirect effects, we cross-compared the datasets of Esg-Dam binding targets, genes upregulated upon esgts > esgRNAi and genes downregulated in whole midguts upon MyoIAts > UAS-esg expression. Genes that are direct targets of Esg would be expected: 1) to show increased expression upon loss of Esg, 2) to show reduced expression upon overexpression of Esg and 3) to have binding sites for Esg in their promoters. We found 76 genes in this category (Fig5H and Supplementary Table S6). These genes showed > twofold upregulation upon esg knockdown, > twofold downregulation upon UAS-esg expression and had 1 or more EBRs. Hence, we consider these 76 genes high-confidence Esg targets. This set included Pdm1, the smooth septate junction component Snakeskin (Ssk), the transcription factor bowl and the cell cycle regulator tribbles (Trbl) (Supplementary Table S6), suggesting that Esg represses diverse aspects of the differentiation process.
Overexpression of nubbin/Pdm1 triggers loss of esg expression and EC differentiation
Loss of esg causes a strong upregulation of Pdm1 in progenitor cells. Furthermore, our transcriptome analysis data strongly suggest that Esg directly downregulates Pdm1 expression. Therefore, we investigated whether ectopic expression of Pdm1 in the stem/progenitor compartment would be sufficient to cause a loss of stemness and EC differentiation. Expression of a UAS-Pdm1 construct with esgts triggered a rapid loss of Delta+ ISCs and increased the ploidy of the remaining GFP+ cells, which resemble larger, developing ECs (Fig6A and B, quantification of Delta+ cells in H). These cells also express the EC-specific MyoIA-lacZ reporter gene (Fig6D–D', arrows). The total number of GFP+ cells/ROI in UAS-Pdm1 midguts did not significantly change at this timepoint compared to the control (data not shown). We confirmed the apparent increased ploidy upon Pdm1 overexpression by calculating the integrated DAPI intensity/nucleus for GFP+ cells in both genotypes. Control esg+ progenitor cells resided mainly in G2 and G1, consistent with recent reports on cell cycle phasing in the adult midgut (Zielke et al, 2014). Overexpression of Pdm1 caused a depletion of both the G1 and G2 peaks, with the vast majority of cells having an 8C DNA content (Fig6E). Thus, based on the increased ploidy and morphology, we conclude that Pdm1 overexpression results in EC differentiation. To confirm loss of stem/progenitor identity upon ectopic Pdm1 expression, we combined UAS-Pdm1 expression with the progenitor-specific mira-GFP reporter and used an esgts driver strain driving expression of a membrane-bound, myristoylated RFP (UAS-myrRFP) (Fig6F and G). Whereas control animals have high levels of both mira-GFP and esg promoter-driven UAS-myrRFP (Fig6F–F'''), Pdm1 expression resulted in a rapid loss of mira-GFP+/esg+-double-positive progenitor cell nests (Fig6G–G'''). Thus, expression of Pdm1 is sufficient to trigger a loss of esg expression and stem cell identity and results in a rapid initiation of EC differentiation.
Figure 6. Ectopic expression of Pdm1 in progenitors leads to EC differentiation.

- A Control esgts animals have stem-progenitor nests with 1 or more Delta+ ISCs.
- B esgts > UAS-Pdm1 animals lack Delta+ ISCs and appear as young EC-like cells with larger nuclei.
- C, D Expression of the EC-specific MyoIA-lacZ reporter gene in control (C–C') and UAS-Pdm1-expressing esgts animals (D–D'). Expression is absent from control Esg+ ISC and EB cells (C–C', arrows), whereas Pdm1 expression results in MyoIA-lacZ+/GFP+ double-positive cells (D–D', arrows).
- E Frequency histogram showing the integrated DAPI intensity/nucleus in control (upper panel) and UAS-Pdm1 GFP+ cells (lower panel) (n = 540 nuclei for control, n = 565 nuclei for UAS-Pdm1).
- F, G esgts, UAS-myrRFP expressing either the mira-GFP reporter alone (control, F–F''') or in combination with Pdm1 overexpression (UAS-Pdm1, G–G'''). Transgene induction for 2 days results in disappearance of the population of esg+/mira-GFP+ double-positive cells (G–G''').
- H Quantification of the number of Delta+ cells/ROI in control and UAS-Pdm1-expressing esgts animals after 4 days of transgene induction. P < 0.0001, Student's t-test.
Data information: Scale bars, 50 μm.
Source data are available online for this figure.
Activated Notch overrides ectopic Esg
Notch signaling is a key regulator of differentiation in the Drosophila ISC lineage. (Ohlstein & Spradling, 2006, 2007; Perdigoto & Bardin, 2013). To determine the epistatic relationship between Notch and Esg, we tested whether a constitutively active intracellular domain of the Notch receptor (Nintra) could override the block to differentiation that results from enforced Esg expression. We used esg-F/O to clonally express UAS-Nintra, UAS-esg or the combination of both and then scored the appearance of differentiated ECs in the clones. As previously reported (Ohlstein & Spradling, 2007), Nintra rapidly drove differentiation of the ISCs and EBs into ECs (Fig7B–B', arrows). Conversely, UAS-esg expression caused the formation of small, diploid cells that were Pdm1-negative (Fig7C–C', arrow and Fig3B–D). Combined expression of UAS-Nintra and UAS-esg led to the appearance of large polyploid cells that had low levels of Pdm1 (Fig7D–D', arrows). Based on their morphology and condensed nuclear DNA, it is likely that these cells were ECs undergoing apoptosis. Hence, Notch activation can at least partially override the block to differentiation that occurs when Esg is overexpressed in progenitor cells.
Figure 7. Esg is required for NotchRNAi-induced stem cell overgrowths in the midgut.

- Control esg-FO clones 2 days after clonal induction. Few cells have differentiated into mature Pdm1-positive ECs (arrow).
- Overexpression of the constitutively active Notch intracellular domain (Nintra) results in EC differentiation in most of the esg-FO clones (arrows).
- UAS-esg-expressing esg-FO clones consist of small clusters of diploid cells, negative for Pdm1 (arrow).
- UAS-esg UAS-Nintra expression results in an extensive loss of GFP-positive cells with few large polyploid GFP-positive cells with an aberrant nuclear morphology (arrows).
- Control FRT40A clones consist mainly of large differentiated ECs, with occasionally a mitotic ISC (arrow).
- esgG66B clones consist mainly of differentiated cells (also see Fig1).
- Clonal expression of NotchRNAi generates large overgrowths, consisting of highly mitotic Delta-positive cells (arrows, quantification in I).
- esgG66BNotchRNAi clones occasionally form overgrowths resembling NotchRNAi clones, but these are much smaller and less mitotic as the NotchRNAi-only tumors.
- Quantification of mitotic cells/midgut 7 days AHS for the genotypes presented in (E–H). P < 0.0001, Student's t-test with Welch's correction.
- Quantification of the percentage of mitotic cells/clonal area unit (1,000 μm) for NotchRNAi and esgG66BNotchRNAi stem cell clones. n = 11 clones for NotchRNAi clones and n = 18 clones for esgG66BNotchRNAi clones.
- Kaplan–Meier survival curves for the different genotypes. n = 3 × 20 animals/genotype for each of the genotypes.
Data information: Scale bars, 50 μm.
Source data are available online for this figure.
Esg is required for the growth of ISC-derived tumors induced by NotchRNAi
Loss of Notch leads to a rapid overproliferation of stem-like cells that express high levels of Delta, have a high mitotic index and no longer differentiate into ECs. Large numbers of EEs are also produced (Supplementary Fig S5; Ohlstein & Spradling, 2007; Perdigoto et al, 2011). These Notch mutant ISC-derived tumors rapidly supplant differentiated cells in the intestinal epithelium and eventually kill the host (P. Patel and B.A.E. unpublished observations). We investigated the requirement for Esg in these stem cell tumors by creating esgG66B null mutant MARCM clones that also expressed NotchRNAi. Many of these esgG66B NotchRNAi clones had a phenotype similar to esgG66B single mutant clones, namely that the clones consisted of only a few cells and these were differentiated ECs and EEs. However, infrequent Delta-positive stem cell overgrowths were also observed (Fig7H). Despite these rare overgrowths, midguts from esgG66B NotchRNAi animals still had much lower mitotic indices than seen in NotchRNAi controls, and the overgrowths in these midguts were much smaller than overgrowths in NotchRNAi midguts (Fig7I and Supplementary Fig S5A and B). Quantification of the number of mitoses per clonal area unit in cell overgrowths from NotchRNAi and esgG66B NotchRNAi animals showed a bimodal distribution, such that many overgrowths in esgG66B NotchRNAi animals contained no mitotic cells whereas others had as many mitoses as clones expressing NotchRNAi alone (Fig7J). The percentage of Pros-positive EE cells in esgG66B NotchRNAi clones was significantly higher than in NotchRNAi clones (Supplementary Fig S5C and D, quantification in E), suggesting that loss of Esg in NotchRNAi clones biases precocious differentiation toward the EE fate. The EE bias in these clones is in line with results from Loza-Coll et al, which show that loss of Esg results in a bias toward EE differentiation (Loza-Coll et al, 2014).
Long-term survival assays showed that the extensive overproliferation of ISC-derived tumors in NotchRNAi animals led to lethality (Fig7K). However, this loss of viability was nearly completely rescued in esgG66B NotchRNAi animals (Fig7K), supporting our hypothesis that Esg is required to maintain the proliferative potential of ISCs. In summary, activated Notch can overcome the action of Esg to induce differentiation. However, Esg is required in stem cell-derived tumors to maintain stem cell characteristics such as proliferative capability, and to prevent differentiation toward the EE fate.
Discussion
Stem cell identity is controlled by both extrinsic cues from the niche and cell-intrinsic transcriptional programs. Thus far, most studies of the Drosophila midgut have focused on the niche-derived signals that control midgut stem cell self-renewal (Jiang & Edgar, 2011; Lucchetta & Ohlstein, 2012). Here, we demonstrate a cell-intrinsic role for the Snail family transcription factor, Escargot, in controlling ISC self-renewal and differentiation. Loss of Esg leads to a rapid loss of all stem/progenitor cells in the midgut, due to their differentiation, whereas Esg overexpression keeps these cells permanently in an undifferentiated state. The dramatic effects of manipulating Esg levels support a central role for this Snail family member in controlling stem cell identity in the fly intestine.
Esg promotes self-renewal by repressing differentiation gene expression
Our transcriptomics analysis indicated that Esg acts as a transcriptional repressor of a large diverse set of differentiation genes. These targets include transcription factors specific to ECs and EEs (Pdm1, Prospero) and genes used in digestion, immunity and cytoarchitectural specialization (Figs4 and 5 and Supplementary Tables S2, S4 and S6). Interestingly, one of these transcription factors, Pdm1, plays an important role in EC differentiation: ectopic expression of Pdm1 in progenitor cells was sufficient to trigger EC differentiation, partially mimicking the esg loss of function phenotype. The rapid loss of the Esg-expressing cell population upon Pdm1 overexpression suggests that Pdm1 might repress Esg expression, perhaps directly (Fig6). In this case, Esg and Pdm1 together would constitute a negative feedback switch that governs EC differentiation (see Fig8).
Figure 8. Model describing the gene regulatory interaction between Esg, Notch and Pdm1 in the adult midgut.
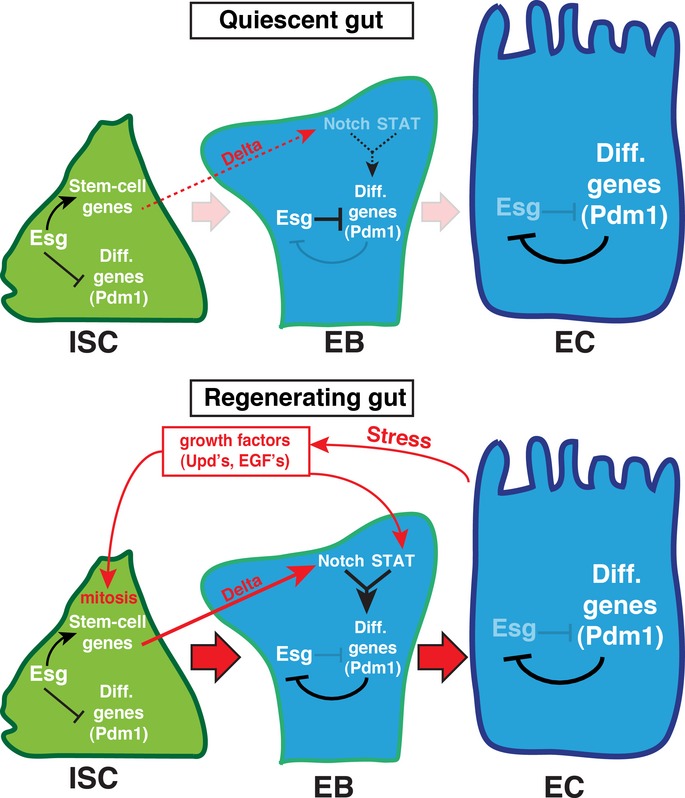
Notch, Esg and Pdm1 are part of a transcriptional network with negative feedback that controls stem cell identity and differentiation in the adult midgut. Esg acts in the ISC to repress expression of differentiation genes such as Pdm1 and maintains expression of stem cell-associated genes such as Egfr and miranda. Simultaneously, growth factors such as Upd cytokines and EGFR ligands from ECs control ISC mitosis and Jak/STAT and EGFR pathway activity in both ISC and EB. The combined activity of the Notch and Jak/STAT pathways is required for differentiation gene expression to initiate in the EB. This results in the downregulation of Esg upon differentiation, through the action of specific differentiation genes such as Pdm1 (in ECs). Under “quiescent” conditions (top), growth factor activity is low and differentiation does not occur. When EC stress requires regeneration (bottom), high Jak/STAT and EGFR pathway activity promotes ISC mitosis, and EB differentiation is promoted through the combinatorial action of Delta-Notch and Jak/STAT signaling. Only after the differentiation factor Pdm1 is activated, Esg is finally repressed.
Our expression analysis also raised the possibility that Esg activates progenitor cell-specific genes in ISCs and EBs. These include the EGF signaling components Cbl, spitz, argos and Egfr as well as the Jak/Stat receptor domeless. Both EGFR and Jak/STAT pathways are crucial for ISC growth and maintenance, and receptivity to these signals is downregulated in differentiated ECs and EEs (Jiang & Edgar, 2009; Jiang et al, 2011; J. Xiang, D. Dutta and B.A. Edgar, unpublished observations). While Snail family members are best understood as repressors, the Esg paralog Snail has been reported to function as a context-dependent transcriptional activator (Rembold et al, 2014), suggesting that an activating role for Esg is also plausible. The function of Esg as either an activator or repressor is likely determined by co-factors and/or other transcription factors acting on the same promoters that are expressed in the ISC and EB population. In the Drosophila embryo, Snail cooperates with Twist at distinct promoters to activate EMT gene expression during mesoderm formation (Rembold et al, 2014). Snail2 can bind to Sox9 to activate expression from its own promoter during chick neural crest formation (Sakai et al, 2006). In its role as a repressor, Esg binds the co-repressor CtBP to maintain somatic Cyst stem cells and hub cells in the Drosophila male testis (Leatherman & Dinardo, 2008; Voog et al, 2014). Future work to unravel the complete transcriptional network within which Esg functions to maintain the stem/progenitor state should prove to be very interesting.
Esg, Notch and Stat form a transcriptional circuit that governs differentiation
Our data support a model in which Esg acts in a circuit with Delta-Notch signaling to control the switch from stem/progenitor identity to differentiated cell identities (Fig8). In its simplest form, this circuit might be a bistable switch in which Esg and Notch mutually inhibited each other, with Esg being “on” and dominant in progenitor cells and Notch signaling “on” and dominant in their differentiated progeny, the enterocytes. However, the constant presence of a substantial population of intermediate progenitor cells, the enteroblasts (EBs), which express both Esg and Notch reporter genes, indicates that a simple bistable switch is not an accurate conception. Indeed, EBs, defined here as cells positive for both Esg and the Notch reporter Su(H)GBE-LacZ, can persist for many days in the absence of ISC division. Thus, the EB transition state is metastable. In this transition state, Notch is apparently active, but secondary downstream targets that directly affect differentiation, such as Pdm1, brush border Myosin and smooth septate junction proteins, remain repressed (Supplementary Table S1). Since these genes are rapidly activated following depletion of Esg, we suggest that their repression is most likely mediated by Esg binding.
We can offer two potential explanations for the longevity of the EB transition state. First, we suggest that the repression of esg transcription by Notch is indirect and that this delays esg silencing (Fig8). Silencing of Esg is not likely to be mediated by the Notch-regulated transcription factor Su(H) (a transcriptional activator) but by downstream repressors that act only after enterocyte or endocrine differentiation has begun. Pdm1 in ECs and Prospero in EEs are presently the most obvious candidates. Both are specifically induced coincident with Esg silencing, in ECs and EEs, respectively, and Dam-ID assays suggest that Pros has binding sites in the esg locus (Choksi et al, 2006). Our finding that overexpression of Pdm1 caused the rapid differentiation of Esg+ stem/progenitor cells supports the notion that Pdm1 could directly repress Esg expression to control EC differentiation. Furthermore, nubbin/Pdm1 was found to restrict expression of Notch target genes in the Drosophila larval wing disc (Neumann & Cohen, 1998). Hence, Pdm1 likely triggers EC differentiation by downregulating both Esg and the expression of Notch target genes in the EB. Therefore, Notch is only transiently active in EBs but fully off in mature ECs with high levels of Pdm1.
While a delay circuit that controls the silencing of Esg is likely, theoretically it cannot explain how Esg+ EBs can persist for such long periods during times of low gut epithelial turnover and then rapidly differentiate during gut regeneration. Hence, we speculate that a second input signal acts in combination with Notch-dependent factor(s) to silence Esg (Fig8). This second signal is likely to be a downstream effector of the growth factor signaling network that also drives ISC division and gut epithelial renewal (Jiang & Edgar, 2011; Lucchetta & Ohlstein, 2012). Of the transcriptional effectors involved in maintaining gut homeostasis, the most obvious candidate as an indirect mediator of esg repression is Stat92E, which is activated by the highly stress-dependent cytokines, Upd2 and Upd3. Tellingly, the cytokine receptor, Dome, Janus Kinase (hop) and Stat92E are all required for EB maturation into ECs (Jiang & Edgar, 2009; Beebe et al, 2010; Lin et al, 2010). If the silencing of esg was dependent upon both Notch and Stat92E, and Delta-Notch signaling was irreversible once resolved; then, the Notch+ Esg+ EB transition state should in principle be stable in conditions of low Jak/Stat signaling, as is observed during periods of midgut quiescence. It needs to be noted, however, that ISCs and EBs maintain appreciable levels of Stat-reporter gene expression even during relative quiescence, and so, in this model, it would be Stat activity above some threshold that would combine with Notch signaling to trigger differentiation. Since Jak/Stat signaling also triggers ISC division, a surge in cytokine signaling could coordinately trigger both the differentiation of older EBs and the production of new ones in this model (Fig8), thus explaining how a significant EB population is maintained even as stem cell activity waxes and wanes.
A central role for Snail family members in regulating stemness and differentiation
Snail family transcription factors have been described as regulators of epithelial-to-mesenchyme transitions (EMT) that occur during development, wound healing and cancer metastasis (Thiery et al, 2009). In some contexts, notably metastasis, EMT is believed to accompany the acquisition of stem-like properties (Mani et al, 2008). Although Esg itself has not been reported to regulate EMT, its paralog in flies (Sna) and homologs in mammals (Snai1, Snai2) do promote EMT (Thiery et al, 2009). Interestingly, our RNA-seq experiments showed that not only Esg, but Snail, Worniu and the Zeb family members Zfh1 and Zfh2 were all expressed in intestinal stem cells and downregulated in ECs and EEs (Supplementary Table S1). Thus, these EMT-linked transcription factors may work together to affect different aspects of midgut homeostasis and ISC differentiation. Indeed, Esg-positive ISCs and EBs are morphologically more similar to mesenchymal cells than they are epithelial, whereas Esg-negative EEs and ECs have the pronounced apical-basal polarity typical of epithelial cells. Esg+ cells often make striking lateral projections, suggestive of dynamic behavior, and they have the capacity to multilayer when their differentiation is blocked or they are forced to overproliferate. Furthermore, a number of epithelial-class genes are repressed in Esg+ progenitors and activated upon EC and/or EE differentiation (Supplementary Table S1). These include genes encoding the apico-lateral cortical Lgl-Dlg-Scrib-Crb complex, septate junction proteins (e.g., Ssk, Cora, Mesh) and polarity factors including Par3 and Par6. Strikingly, Scrib and Ssk both have Esg-binding sites in their promoters, and their expression is highly regulated by Esg (Fig5 and Supplementary Tables S2, S4 and S6). However, some gene targets that are central to EMT in mammalian cells show opposite trends in the fly's ISC lineage. For instance, Esg+ progenitors express significant levels of integrins, and E-cadherin—typically lost during EMT—is highly upregulated specifically in ISCs and EBs. Thus, the Esg-regulated differentiation of Drosophila ISCs only partially resembles a mesenchymal-to-epithelial transition (MET).
Esg's role in ISC maintenance nicely parallels the functions of other Snail family members in Drosophila and mammals. For instance, in Drosophila neuroblasts (neural stem cells), the Snail family member Worniu promotes self-renewal and represses neuronal differentiation (Lai et al, 2012). In mice, Snail family members have been associated with the regulation of the stem cell state in both normal and pathological conditions (reviewed in Scheel & Weinberg, 2012). For instance, mammary stem cells require the Snail family member Slug to retain their MaSC identity (Guo et al, 2012). Mouse Snai1 also represses the transition from the stem cell-like mitotically cycling trophoblast precursor cell to the endoreplicating trophoblast giant cell during rodent placental development (Nakayama et al, 1998). This process, which also requires a mitotic-to-endocycle switch upon differentiation, is strikingly similar to the role we describe here for Esg in EC differentiation and its role during imaginal disc development (Fuse et al, 1994).
More interesting yet, mouse Snai1 is specifically expressed and required for stem cell maintenance in the crypts of the mouse intestine and expands the stem cell population when overexpressed (Horvay et al, 2011; Horvay et al, personal communication). However, few studies highlight the target genes responsible for the function of Snail family members in stem cell maintenance. One example is from mouse muscle progenitors (myoblasts), where Snai1 and Snai2 repress expression from MyoD target promoters and this is required to maintain their progenitor state (Soleimani et al, 2012). The work we present here shows that Esg affects many aspects of the differentiation process and that it can form a transcriptional switch with one of the targets it represses (Pdm1) to balance self-renewal and differentiation in this stem cell lineage. Together, these studies suggest that the function of Snail family transcription factors as repressors of differentiation genes is ancient and widespread and may be an essential component in balancing self-renewal with differentiation in diverse animal stem cell lineages.
Materials and Methods
Fly genetics
See Supplementary Materials and Methods for fly stocks used in this study and a detailed description of clonal analysis and quantification methods.
Immunohistochemistry and microscopy
Drosophila female adult intestines were dissected in phosphate-buffered saline (PBS) and fixed for 30 min at room temperature (RT) in 4% paraformaldehyde. Antibody incubations were performed in 2.5% BSA, 0.01% Triton X-100 and 10% normal goat serum. Washes were performed using PBS containing 0.15% Triton X-100 or 0.1% Tween-20 (for anti-dCad2), respectively. Samples were mounted in Vectashield (Vector Laboratories). Antibodies: chicken anti-GFP (Life Technologies/Molecular probes, 1:500); mouse anti-Pdm1 (kindly provided by Steve Cohen, 1:20); mouse anti-Delta extracellular domain (Developmental Studies Hybridoma Bank (DSHB), 1:50); mouse anti-Prospero (DSHB, 1:50); mouse anti-Armadillo (DSHB, 1:50) rabbit anti-phospho-Histone 3 (Upstate Biotechnology, 1:1,000); rat anti-dCad2 (DSHB, 1:20); mouse anti-β-galactosidase (Sigma, 1:100). Images were acquired on a Leica TCS SP5II inverted confocal microscope, equipped with a HCX Plan APO 40×/1.30 oil-immersion objective and processed with Fiji/ImageJ and Adobe Photoshop. Scale bars are 50 μm in all images, unless otherwise indicated.
Flow Cytometry and RNA-Seq
For transcriptome profiling of sorted progenitor cells, esgts animals expressing either UAS-GFP alone, esgRNAi or UAS-esg were shifted for 24 h at 29°C. Midgut dissociation and FACS were performed as described previously (Dutta et al, 2013). Raw RNA-Seq data were submitted to ArrayExpress (accession E-MTAB-2915). A detailed description of the FACS/RNA-Seq procedure and bioinformatic data analysis can be found in the Supplementary Materials and Methods.
qRT-PCR
MyoIAts was used to drive transgene expression for 24 h at 29°C. 25 adult female intestines per genotype were dissected, and midguts were homogenized in TRIzol (Life Technologies). RNA was isolated by phenol/chloroform extraction, followed by purification of the RNA-containing fractions using RNAeasy columns supplied with the RNAeasy Mini Kit (Qiagen). 250 ng of total RNA was used for cDNA synthesis reactions using the QuantiTect Reverse Transcription Kit (Qiagen). qPCR was performed on a LightCycler 480 II (Roche) using the LightCycler Universal Probes and Probes Master (Roche). Each assay was performed in triplicate on four biological repeats. Expression levels of targets analyzed were calculated relative to GAPDH expression, using the ΔΔCt method. Primer sequences can be found in the Supplementary Materials and Methods.
Dam-ID
In transgenic flies that expressed a fusion of Esg and the bacterial DNA methylase Dam, genomic DNA was extracted from whole midguts, and the methylated regions were fluorescently labeled by PCR amplification and hybridized to whole-genome tiling arrays. Approximately 50 female flies expressing the Dam:Esg fusion (or control flies expressing Dam alone) were dissected 5-6 days after eclosion, and genomic DNA (gDNA) was isolated and labeled with minor modifications to the protocol in Choksi et al (2006). Triplicate samples of labeled gDNA were hybridized with a dye-swap to NimbleGen 2.1M Whole-Genome tiling arrays (Roche), and the fluorescence intensity ratios between Esg:Dam and Dam controls were analyzed to identify EBRs using ad hoc Perl scripts with minor modifications to those reported by Southall and Brand (Southall & Brand, 2009). Briefly, a gene was identified as a putative Esg target if an EBR was mapped within ± 5 kb of its sequence. EBRs are strings of at least 8 consecutive tiling array probes with a log2 (Dam:Esg/Dam intensity ratio) above a threshold that was adjusted for each dataset to correct for differences in background binding and thus generate similar EBR size distributions (overall FDR < 0.01). The putative Esg targets considered in this study had an associated EBR in at least 2 out of the 3 datasets, and only EBRs between 8 and 12 probes in length were considered (Loza-Coll et al, 2014).
Acknowledgments
We thank S. Hayashi, S. Cohen, S. Hou, Y. Engstrom, V. Hartenstein, the VDRC, the Bloomington Stock center and the Developmental Studies Hybridoma Bank for stocks and reagents and P.H. Patel, N. Zielke, J. Maldera, J. Zhang and J.L. Bandura for stocks, help and discussion. We also thank David Ibberson of the Heidelberg University Deep Sequencing Core Facility and Monika Langlotz from the ZMBH FACS Facility. Work in the Brand laboratory was funded by Wellcome Trust Programme Grant 092545 to AHB. This work was supported by the DKFZ and ERC Advanced Grant no. 268515 to B.A. Edgar. D. Dutta was supported by DFG SFB 873. J. Korzelius was supported by an EMBO Long-Term Fellowship.
Author contributions
JK designed, performed and analyzed experiments and wrote the manuscript. SKN, JSKC, MALC, TDS, AHB, JO and DD performed and analyzed experiments. DD and CG performed the bio-informatics data analysis. DLJ and BAE analyzed experiments and wrote the manuscript.
Conflict of interest
The authors declare that they have no conflict of interest.
Supporting Information
Supplementary information for this article is available online: http://emboj.embopress.org
Supplementary Figure S1
Supplementary Figure S2
Supplementary Figure S3
Supplementary Figure S4
Supplementary Figure S5
Supplementary Table S1
Supplementary Table S2
Supplementary Table S3
Supplementary Table S4
Supplementary Table S5
Supplementary Table S6
Supplementary Information
Review Process File
Source Data for Figure 1
Source Data for Figure 2
Source Data for Figure 3
Source Data for Figure 6
Source Data for Figure 7
References
- Bardin AJ, Perdigoto CN, Southall TD, Brand AH, Schweisguth F. Transcriptional control of stem cell maintenance in the Drosophila intestine. Development. 2010;137:705–714. doi: 10.1242/dev.039404. [DOI] [PMC free article] [PubMed] [Google Scholar]
- Batlle E, Sancho E, Franci C, Dominguez D, Monfar M, Baulida J, Garcia De Herreros A. The transcription factor snail is a repressor of E-cadherin gene expression in epithelial tumour cells. Nat Cell Biol. 2000;2:84–89. doi: 10.1038/35000034. [DOI] [PubMed] [Google Scholar]
- Beebe K, Lee WC, Micchelli CA. JAK/STAT signaling coordinates stem cell proliferation and multilineage differentiation in the Drosophila intestinal stem cell lineage. Dev Biol. 2010;338:28–37. doi: 10.1016/j.ydbio.2009.10.045. [DOI] [PubMed] [Google Scholar]
- Bonnay F, Cohen-Berros E, Hoffmann M, Kim SY, Boulianne GL, Hoffmann JA, Matt N, Reichhart JM. big bang gene modulates gut immune tolerance in Drosophila. Proc Natl Acad Sci USA. 2013;110:2957–2962. doi: 10.1073/pnas.1221910110. [DOI] [PMC free article] [PubMed] [Google Scholar]
- Buchon N, Broderick NA, Chakrabarti S, Lemaitre B. Invasive and indigenous microbiota impact intestinal stem cell activity through multiple pathways in Drosophila. Genes Dev. 2009a;23:2333–2344. doi: 10.1101/gad.1827009. [DOI] [PMC free article] [PubMed] [Google Scholar]
- Buchon N, Broderick NA, Poidevin M, Pradervand S, Lemaitre B. Drosophila intestinal response to bacterial infection: activation of host defense and stem cell proliferation. Cell Host Microbe. 2009b;5:200–211. doi: 10.1016/j.chom.2009.01.003. [DOI] [PubMed] [Google Scholar]
- Buchon N, Osman D, David FP, Fang HY, Boquete JP, Deplancke B, Lemaitre B. Morphological and molecular characterization of adult midgut compartmentalization in Drosophila. Cell Rep. 2013;3:1725–1738. doi: 10.1016/j.celrep.2013.04.001. [DOI] [PubMed] [Google Scholar]
- Cano A, Perez-Moreno MA, Rodrigo I, Locascio A, Blanco MJ, del Barrio MG, Portillo F, Nieto MA. The transcription factor snail controls epithelial-mesenchymal transitions by repressing E-cadherin expression. Nat Cell Biol. 2000;2:76–83. doi: 10.1038/35000025. [DOI] [PubMed] [Google Scholar]
- Choksi SP, Southall TD, Bossing T, Edoff K, de Wit E, Fischer BE, van Steensel B, Micklem G, Brand AH. Prospero acts as a binary switch between self-renewal and differentiation in Drosophila neural stem cells. Dev Cell. 2006;11:775–789. doi: 10.1016/j.devcel.2006.09.015. [DOI] [PubMed] [Google Scholar]
- Dantoft W, Davis MM, Lindvall JM, Tang X, Uvell H, Junell A, Beskow A, Engstrom Y. The Oct1 homolog Nubbin is a repressor of NF-kappaB-dependent immune gene expression that increases the tolerance to gut microbiota. BMC Biol. 2013;11:99. doi: 10.1186/1741-7007-11-99. [DOI] [PMC free article] [PubMed] [Google Scholar]
- Dutta D, Xiang J, Edgar BA. RNA expression profiling from FACS-isolated cells of the Drosophila intestine. Curr Protoc Stem Cell Biol. 2013;27:2F 2 1–2F 2 12. doi: 10.1002/9780470151808.sc02f02s27. [DOI] [PubMed] [Google Scholar]
- Furriols M, Bray S. A model Notch response element detects Suppressor of Hairless-dependent molecular switch. Curr Biol. 2001;11:60–64. doi: 10.1016/s0960-9822(00)00044-0. [DOI] [PubMed] [Google Scholar]
- Fury W, Batliwalla F, Gregersen PK, Li W. Overlapping probabilities of top ranking gene lists, hypergeometric distribution, and stringency of gene selection criterion. Conf Proc IEEE Eng Med Biol Soc. 2006;1:5531–5534. doi: 10.1109/IEMBS.2006.260828. [DOI] [PubMed] [Google Scholar]
- Fuse N, Hirose S, Hayashi S. Diploidy of Drosophila imaginal cells is maintained by a transcriptional repressor encoded by escargot. Genes Dev. 1994;8:2270–2281. doi: 10.1101/gad.8.19.2270. [DOI] [PubMed] [Google Scholar]
- Fuse N, Hirose S, Hayashi S. Determination of wing cell fate by the escargot and snail genes in Drosophila. Development. 1996;122:1059–1067. doi: 10.1242/dev.122.4.1059. [DOI] [PubMed] [Google Scholar]
- Guo W, Keckesova Z, Donaher JL, Shibue T, Tischler V, Reinhardt F, Itzkovitz S, Noske A, Zurrer-Hardi U, Bell G, Tam WL, Mani SA, van Oudenaarden A, Weinberg RA. Slug and Sox9 cooperatively determine the mammary stem cell state. Cell. 2012;148:1015–1028. doi: 10.1016/j.cell.2012.02.008. [DOI] [PMC free article] [PubMed] [Google Scholar]
- Hayashi S, Hirose S, Metcalfe T, Shirras AD. Control of imaginal cell development by the escargot gene of Drosophila. Development. 1993;118:105–115. doi: 10.1242/dev.118.1.105. [DOI] [PubMed] [Google Scholar]
- Horvay K, Casagranda F, Gany A, Hime GR, Abud HE. Wnt signaling regulates Snai1 expression and cellular localization in the mouse intestinal epithelial stem cell niche. Stem Cells Dev. 2011;20:737–745. doi: 10.1089/scd.2010.0188. [DOI] [PubMed] [Google Scholar]
- Izumi Y, Yanagihashi Y, Furuse M. A novel protein complex, Mesh-Ssk, is required for septate junction formation in the Drosophila midgut. J Cell Sci. 2012;125:4923–4933. doi: 10.1242/jcs.112243. [DOI] [PubMed] [Google Scholar]
- Jiang H, Edgar BA. EGFR signaling regulates the proliferation of Drosophila adult midgut progenitors. Development. 2009;136:483–493. doi: 10.1242/dev.026955. [DOI] [PMC free article] [PubMed] [Google Scholar]
- Jiang H, Patel PH, Kohlmaier A, Grenley MO, McEwen DG, Edgar BA. Cytokine/Jak/Stat signaling mediates regeneration and homeostasis in the Drosophila midgut. Cell. 2009;137:1343–1355. doi: 10.1016/j.cell.2009.05.014. [DOI] [PMC free article] [PubMed] [Google Scholar]
- Jiang H, Edgar BA. Intestinal stem cells in the adult Drosophila midgut. Exp Cell Res. 2011;317:2780–2788. doi: 10.1016/j.yexcr.2011.07.020. [DOI] [PMC free article] [PubMed] [Google Scholar]
- Jiang H, Grenley MO, Bravo MJ, Blumhagen RZ, Edgar BA. EGFR/Ras/MAPK signaling mediates adult midgut epithelial homeostasis and regeneration in Drosophila. Cell Stem Cell. 2011;8:84–95. doi: 10.1016/j.stem.2010.11.026. [DOI] [PMC free article] [PubMed] [Google Scholar]
- Lai SL, Miller MR, Robinson KJ, Doe CQ. The Snail family member Worniu is continuously required in neuroblasts to prevent Elav-induced premature differentiation. Dev Cell. 2012;23:849–857. doi: 10.1016/j.devcel.2012.09.007. [DOI] [PMC free article] [PubMed] [Google Scholar]
- Leatherman JL, Dinardo S. Zfh-1 controls somatic stem cell self-renewal in the Drosophila testis and nonautonomously influences germline stem cell self-renewal. Cell Stem Cell. 2008;3:44–54. doi: 10.1016/j.stem.2008.05.001. [DOI] [PMC free article] [PubMed] [Google Scholar]
- Lee T, Luo L. Mosaic analysis with a repressible cell marker for studies of gene function in neuronal morphogenesis. Neuron. 1999;22:451–461. doi: 10.1016/s0896-6273(00)80701-1. [DOI] [PubMed] [Google Scholar]
- Lee WC, Beebe K, Sudmeier L, Micchelli CA. Adenomatous polyposis coli regulates Drosophila intestinal stem cell proliferation. Development. 2009;136:2255–2264. doi: 10.1242/dev.035196. [DOI] [PubMed] [Google Scholar]
- Lin G, Xu N, Xi R. Paracrine unpaired signaling through the JAK/STAT pathway controls self-renewal and lineage differentiation of drosophila intestinal stem cells. J Mol Cell Biol. 2010;2:37–49. doi: 10.1093/jmcb/mjp028. [DOI] [PubMed] [Google Scholar]
- Lourenço FC, Munro J, Brown J, Cordero J, Stefanatos R, Strathdee K, Orange C, Feller SM, Sansom OJ, Vidal M, Murray GI, Olson MF. Reduced LIMK2 expression in colorectal cancer reflects its role in limiting stem cell proliferation. Gut. 2013;63:480–493. doi: 10.1136/gutjnl-2012-303883. [DOI] [PMC free article] [PubMed] [Google Scholar]
- Loza-Coll MA, Southall TD, Sandall SL, Brand AH, Jones DL. Regulation of Drosophila intestinal stem cell maintenance and differentiation by the transcription factor Escargot. EMBO J. 2014;33:2983–2996. doi: 10.15252/embj.201489050. [DOI] [PMC free article] [PubMed] [Google Scholar]
- Lucchetta EM, Ohlstein B. The Drosophila midgut: a model for stem cell driven tissue regeneration. Wiley Interdiscip Rev Dev Biol. 2012;1:781–788. doi: 10.1002/wdev.51. [DOI] [PMC free article] [PubMed] [Google Scholar]
- Mani SA, Guo W, Liao MJ, Eaton EN, Ayyanan A, Zhou AY, Brooks M, Reinhard F, Zhang CC, Shipitsin M, Campbell LL, Polyak K, Brisken C, Yang J, Weinberg RA. The epithelial-mesenchymal transition generates cells with properties of stem cells. Cell. 2008;133:704–715. doi: 10.1016/j.cell.2008.03.027. [DOI] [PMC free article] [PubMed] [Google Scholar]
- Micchelli CA, Perrimon N. Evidence that stem cells reside in the adult Drosophila midgut epithelium. Nature. 2006;439:475–479. doi: 10.1038/nature04371. [DOI] [PubMed] [Google Scholar]
- Nakayama H, Scott IC, Cross JC. The transition to endoreduplication in trophoblast giant cells is regulated by the mSNA zinc finger transcription factor. Dev Biol. 1998;199:150–163. doi: 10.1006/dbio.1998.8914. [DOI] [PubMed] [Google Scholar]
- Neumann CJ, Cohen SM. Boundary formation in Drosophila wing: notch activity attenuated by the POU protein Nubbin. Science. 1998;281:409–413. doi: 10.1126/science.281.5375.409. [DOI] [PubMed] [Google Scholar]
- Nieto MA. The snail superfamily of zinc-finger transcription factors. Nat Rev Mol Cell Biol. 2002;3:155–166. doi: 10.1038/nrm757. [DOI] [PubMed] [Google Scholar]
- Ohlstein B, Spradling A. The adult Drosophila posterior midgut is maintained by pluripotent stem cells. Nature. 2006;439:470–474. doi: 10.1038/nature04333. [DOI] [PubMed] [Google Scholar]
- Ohlstein B, Spradling A. Multipotent Drosophila intestinal stem cells specify daughter cell fates by differential notch signaling. Science. 2007;315:988–992. doi: 10.1126/science.1136606. [DOI] [PubMed] [Google Scholar]
- Perdigoto CN, Schweisguth F, Bardin AJ. Distinct levels of Notch activity for commitment and terminal differentiation of stem cells in the adult fly intestine. Development. 2011;138:4585–4595. doi: 10.1242/dev.065292. [DOI] [PubMed] [Google Scholar]
- Perdigoto CN, Bardin AJ. Sending the right signal: notch and stem cells. Biochim Biophys Acta. 2013;1830:2307–2322. doi: 10.1016/j.bbagen.2012.08.009. [DOI] [PubMed] [Google Scholar]
- Rembold M, Ciglar L, Yanez-Cuna JO, Zinzen RP, Girardot C, Jain A, Welte MA, Stark A, Leptin M, Furlong EE. A conserved role for Snail as a potentiator of active transcription. Genes Dev. 2014;28:167–181. doi: 10.1101/gad.230953.113. [DOI] [PMC free article] [PubMed] [Google Scholar]
- Sakai D, Suzuki T, Osumi N, Wakamatsu Y. Cooperative action of Sox9, Snail2 and PKA signaling in early neural crest development. Development. 2006;133:1323–1333. doi: 10.1242/dev.02297. [DOI] [PubMed] [Google Scholar]
- Samakovlis C, Manning G, Steneberg P, Hacohen N, Cantera R, Krasnow MA. Genetic control of epithelial tube fusion during Drosophila tracheal development. Development. 1996;122:3531–3536. doi: 10.1242/dev.122.11.3531. [DOI] [PubMed] [Google Scholar]
- Scheel C, Weinberg RA. Cancer stem cells and epithelial-mesenchymal transition: concepts and molecular links. Semin Cancer Biol. 2012;22:396–403. doi: 10.1016/j.semcancer.2012.04.001. [DOI] [PMC free article] [PubMed] [Google Scholar]
- Soleimani VD, Yin H, Jahani-Asl A, Ming H, Kockx CE, van Ijcken WF, Grosveld F, Rudnicki MA. Snail regulates MyoD binding-site occupancy to direct enhancer switching and differentiation-specific transcription in myogenesis. Mol Cell. 2012;47:457–468. doi: 10.1016/j.molcel.2012.05.046. [DOI] [PMC free article] [PubMed] [Google Scholar]
- Southall TD, Brand AH. Neural stem cell transcriptional networks highlight genes essential for nervous system development. EMBO J. 2009;28:3799–3807. doi: 10.1038/emboj.2009.309. [DOI] [PMC free article] [PubMed] [Google Scholar]
- van Steensel B, Henikoff S. Identification of in vivo DNA targets of chromatin proteins using tethered dam methyltransferase. Nat Biotechnol. 2000;18:424–428. doi: 10.1038/74487. [DOI] [PubMed] [Google Scholar]
- Takahashi K, Yamanaka S. Induction of pluripotent stem cells from mouse embryonic and adult fibroblast cultures by defined factors. Cell. 2006;126:663–676. doi: 10.1016/j.cell.2006.07.024. [DOI] [PubMed] [Google Scholar]
- Tanaka-Matakatsu M, Uemura T, Oda H, Takeichi M, Hayashi S. Cadherin-mediated cell adhesion and cell motility in Drosophila trachea regulated by the transcription factor Escargot. Development. 1996;122:3697–3705. doi: 10.1242/dev.122.12.3697. [DOI] [PubMed] [Google Scholar]
- Thiery JP, Acloque H, Huang RY, Nieto MA. Epithelial-mesenchymal transitions in development and disease. Cell. 2009;139:871–890. doi: 10.1016/j.cell.2009.11.007. [DOI] [PubMed] [Google Scholar]
- Toledano H, D'Alterio C, Loza-Coll M, Jones DL. Dual fluorescence detection of protein and RNA in Drosophila tissues. Nat Protoc. 2012;7:1808–1817. doi: 10.1038/nprot.2012.105. [DOI] [PMC free article] [PubMed] [Google Scholar]
- Voog J, Sandall SL, Hime GR, Resende LP, Loza-Coll M, Aslanian A, Yates JR, 3rd, Hunter T, Fuller MT, Jones DL. Escargot restricts niche cell to stem cell conversion in the Drosophila testis. Cell Rep. 2014;7:722–734. doi: 10.1016/j.celrep.2014.04.025. [DOI] [PMC free article] [PubMed] [Google Scholar]
- Whiteley M, Noguchi PD, Sensabaugh SM, Odenwald WF, Kassis JA. The Drosophila gene escargot encodes a zinc finger motif found in snail-related genes. Mech Dev. 1992;36:117–127. doi: 10.1016/0925-4773(92)90063-p. [DOI] [PubMed] [Google Scholar]
- Yanagihashi Y, Usui T, Izumi Y, Yonemura S, Sumida M, Tsukita S, Uemura T, Furuse M. Snakeskin, a membrane protein associated with smooth septate junctions, is required for intestinal barrier function in Drosophila. J Cell Sci. 2012;125:1980–1990. doi: 10.1242/jcs.096800. [DOI] [PubMed] [Google Scholar]
- Zeng X, Chauhan C, Hou SX. Characterization of midgut stem cell- and enteroblast-specific Gal4 lines in drosophila. Genesis. 2010;48:607–611. doi: 10.1002/dvg.20661. [DOI] [PMC free article] [PubMed] [Google Scholar]
- Zielke N, Korzelius J, van Straaten M, Bender K, Schuhknecht GF, Dutta D, Xiang J, Edgar BA. Fly-FUCCI: a versatile tool for studying cell proliferation in complex tissues. Cell Rep. 2014;7:588–598. doi: 10.1016/j.celrep.2014.03.020. [DOI] [PubMed] [Google Scholar]
Associated Data
This section collects any data citations, data availability statements, or supplementary materials included in this article.
Supplementary Materials
Supplementary Figure S1
Supplementary Figure S2
Supplementary Figure S3
Supplementary Figure S4
Supplementary Figure S5
Supplementary Table S1
Supplementary Table S2
Supplementary Table S3
Supplementary Table S4
Supplementary Table S5
Supplementary Table S6
Supplementary Information
Review Process File
Source Data for Figure 1
Source Data for Figure 2
Source Data for Figure 3
Source Data for Figure 6
Source Data for Figure 7