

Abstract
Tissue stem cells divide to self-renew and generate differentiated cells to maintain homeostasis. Although influenced by both intrinsic and extrinsic factors, the genetic mechanisms coordinating the decision between self-renewal and initiation of differentiation remain poorly understood. The escargot (esg) gene encodes a transcription factor that is expressed in stem cells in multiple tissues in Drosophila melanogaster, including intestinal stem cells (ISCs). Here, we demonstrate that Esg plays a pivotal role in intestinal homeostasis, maintaining the stem cell pool while influencing fate decisions through modulation of Notch activity. Loss of esg induced ISC differentiation, a decline in Notch activity in daughter enteroblasts (EB), and an increase in differentiated enteroendocrine (EE) cells. Amun, an inhibitor of Notch in other systems, was identified as a target of Esg in the intestine. Decreased expression of esg resulted in upregulation of Amun, while downregulation of Amun rescued the ectopic EE cell phenotype resulting from loss of esg. Thus, our findings provide a framework for further comparative studies addressing the conserved roles of Snail factors in coordinating self-renewal and differentiation of stem cells across tissues and species.
Keywords: Amun, Drosophila, Escargot, Notch, stem cell
See also: J Korzelius et al (December 2014)
Introduction
During homeostasis, tissue stem cells maintain the stem cell population through self-renewal and give rise to differentiating progeny to replace cells lost to normal turnover of the tissue (Biteau et al, 2011; Simons & Clevers, 2011; Wang & Jones, 2011). In response to acute and chronic stress (infection, wounding, aging, metabolic challenges), tissue stem cells can undergo dynamic waves of symmetric self-renewing or differentiating divisions to quickly propagate and replace damaged tissue (Morrison & Kimble, 2006; Egger et al, 2010; O'Brien et al, 2011; Piccin & Morshead, 2011; Simons & Clevers, 2011). While significant progress has been made in the identification, isolation and manipulation of tissue stem cells in organisms ranging from plants to vertebrates (Amatruda & Zon, 1999; Gentile et al, 2011; Takashima et al, 2013), our understanding of conserved mechanisms that regulate the choice between self-renewal and the onset of differentiation in vivo is lacking. In this regard, model organisms such as Caenorhabditis elegans and Drosophila melanogaster have been instrumental for the characterization of basic regulatory mechanisms in stem cells, such as the role of asymmetric divisions (Yamashita et al, 2003; Wu et al, 2008; Egger et al, 2010; Inaba & Yamashita, 2012) and the interaction between stem cells and their niche (Wong et al, 2005; Spradling et al, 2008; Losick et al, 2011; Resende & Jones, 2012).
The identification and characterization of stem cells in the posterior midgut of adult flies (Micchelli & Perrimon, 2006; Ohlstein & Spradling, 2006) has revealed numerous regulatory mechanisms conserved between flies and vertebrates (Biteau et al, 2011; Jiang & Edgar, 2012). The Drosophila midgut epithelium is composed of intestinal stem cells (ISCs), enteroblasts (EBs), secretory enteroendocrine (EE) cells and absorptive enterocytes (ECs) (Fig1A). Through cell division, ISCs self-renew to maintain the ISC pool and generate progenitor cells, which adopt either an EE or an EC fate. In addition, ISCs can divide symmetrically to generate either two daughter ISCs or two cells that will differentiate (O'Brien et al, 2011; Goulas et al, 2012; de Navascues et al, 2012). Indeed, it has been proposed that intestinal homeostasis in flies is maintained through a neutral drift between all possible mitotic outcomes (de Navascues et al, 2012).
Figure 1. Loss of Escargot induces ISC loss and a bias toward the enteroendocrine cell fate.

- A Drosophila posterior midgut epithelium. Schematic representation of cell types and their lineage relationships (see text for details; Micchelli & Perrimon, 2006; Ohlstein & Spradling, 2006). Intestinal stem cells (ISCs) and enteroblasts (EBs) can be usually identified by an esg-GFP reporter, or expression of GFP under control of ISC/EB-specific drivers. ISCs express Delta (Dl, which results in a characteristic punctate staining of ISCs), which activates Notch in EBs (revealed by β-GAL staining of flies that carry a Su(H)-lacZ reporter of Notch activity (Bray & Furriols, 2001)). Enteroendocrine cells (EE) are identified by nuclear Prospero (Pros) staining, whereas enterocytes (ECs) can be distinguished based on their large polyploidy nuclei (as revealed by DAPI staining of DNA).
- B esg mRNA is restricted to ISC/EB cells. FISH/IF staining for esg mRNA (red, gray) and GFP protein (green) in midguts of 3- to 5-day-old adults carrying an ISC/EB-specific reporter (“esg > GFP” = esg-Gal4, UAS-GFP).
- C Clonal analysis of esg mutant ISCs. Representative images of wild-type (control) and esg mutant (esgG66) MARCM clones stained as indicated with DAPI, Pros and GFP, 4 or 10 days after heat shock (dphs). esgG66 mutant clones are smaller and contain EE cells more frequently than controls (arrows).
- D, E Loss of esg results in loss of ISCs and an increase in EE cells. A CellProfiler analysis of images as those in (C) confirmed that esgG66 mutant clones are significantly enriched for EE cells (D) and have significantly less cells (E) than their control counterparts (***P < 0.001 and **P < 0.01, Kruskal–Wallis/Dunn test).
- F, G Phenotypes induced by RNAi-mediated depletion of esg in ISC/EBs. (F) RNAi-mediated knockdown of Esg in ISC/EBs caused an accumulation of EE cells and a noticeable change in the morphology and size of some ISC/EBs (arrows in bottom panel; e.g. compare the large GFP+ cell identified by the rightmost arrow to its two smaller neighbors). Midguts from adults of the indicated genotypes were stained with DAPI (all nuclei), GFP (ISC/EB) and Pros (EE cells) following a 6-day incubation at 25°C on 10 μg/ml RU486 or EtOH-containing food (as indicated). (G) Images as those in (F) were processed with CellProfiler to quantify the relative proportion of EE cells in the indicated genotypes/treatments (see Materials and Methods for details). Each data point is an average proportion calculated from four independent images per midgut, and the bars are the geometric mean ± SEM of those averages. *** denotes a significant enrichment of EE cells following Esg knockdown in ISC/EBs compared to either control group (P < 0.001, Kruskal–Wallis/Dunn test).
Data information: Scale bars = 20 μm.
ISCs express the ligand Delta (Dl), which activates Notch (N) signaling in adjacent EBs to promote differentiation and influence cell fate decisions: a weak N signal specifies EE fate, whereas stronger N signaling generates ECs (Micchelli & Perrimon, 2006; Ohlstein & Spradling, 2006, 2007). Accordingly, strong loss-of-function mutations in the N pathway cause an accumulation of ISC-like cells, due to lack of EB differentiation, whereas weaker loss-of-function mutations of Notch generate clusters of ISC-like cells and EEs, due to a combination of impaired EB differentiation and a bias toward the EE fate. In contrast, ectopic activation of N in ISCs results in precocious differentiation, with a bias toward the EC fate (Micchelli & Perrimon, 2006; Ohlstein & Spradling, 2006, 2007). While the regulation of the ISC lineage by the Notch pathway and its downstream effectors has been well established previously (Micchelli & Perrimon, 2006; Ohlstein & Spradling, 2006; Bardin et al, 2010; Perdigoto et al, 2011), little is known about upstream mechanisms that control the levels of Notch activity in this system.
The expression of esg reporter transgenes has been used to mark ISCs and EBs since their initial characterization (Micchelli & Perrimon, 2006). Subsequently, the restricted expression of endogenous esg mRNA in ISC/EB nests was confirmed by fluorescence in situ hybridization in combination with immunofluorescence staining (FISH/IF) (Fig1B; Toledano et al, 2012). To date, however, whether esg plays any specific role in the regulation of ISCs remains unknown.
Esg is a member of the Snail family of transcription factors that act primarily through competition with transcriptional activators for access to a consensus-binding site, the E-box, within the promoter region of target genes (Hemavathy et al, 2000; Nieto, 2002; Barrallo-Gimeno & Nieto, 2005). The Snail factors were first characterized in Drosophila and are conserved from mollusks to humans (Nieto, 2002). In addition to expression in ISCs, Esg is expressed in germline stem cells (GSCs) and cyst stem cells (CySCs) of the testis (Kiger et al, 2000; Voog et al, 2014) and, during development, in neural stem cells and imaginal disks (Hayashi et al, 1993; Ashraf et al, 1999; Cai et al, 2001). Moreover, our previous work demonstrated that Esg is required for the maintenance of CySCs and hub cells, a critical component of the stem cell niche in the adult testis (Voog et al, 2014).
Given the restricted expression of esg in ISC/EBs of the Drosophila intestine, we sought to characterize the function of Esg in these cells. Here, we demonstrate that Esg is required for maintenance of ISCs and an important regulator of Notch signaling within EBs. Furthermore, DNA binding analysis by DamID identified Amun, a previously characterized negative regulator of Notch signaling (Abdelilah-Seyfried et al, 2000; Shalaby et al, 2009), as a putative target of Esg in the gut. Accordingly, Esg knockdown in ISC/EBs caused an upregulation in Amun expression in these cells. Furthermore, abrogating the increase in Amun rescued the reduction in Notch activity and accumulation of EE cells caused by loss of Esg. Based on our data, we conclude that Esg positively modulates Notch signaling within EBs through repression of Amun, influencing the decision between EC and EE fates. Therefore, we propose that Esg plays a pivotal role in intestinal homeostasis, simultaneously promoting stem cell maintenance and regulating the differentiation of EBs.
Results
Loss of Escargot function in ISC/EBs leads to loss of ISCs and a bias toward the enteroendocrine cell fate
Most esg alleles result in lethality during development when homozygous; however, the shutoff (shof) allele of esg is a homozygous viable mutation in the esg locus, which permits investigation of adult phenotypes (Voog et al, 2014). FISH/IF analysis revealed that esgshof homozygotes express normal levels of esg mRNA in ISC/EBs (Supplementary Fig S1A), and intestines from these flies appeared normal. Therefore, in order to probe the role of Esg in the intestine, FRT-mediated recombination was used to generate ISCs homozygous mutant for a null allele of esg, esgG66 (Whiteley et al, 1992; Lee & Luo, 1999; Voog et al, 2014). In this experiment, a heat shock-induced recombination generates esg mutant cells that become permanently labeled by expression of GFP. Progeny derived from marked ISCs are similarly marked, permitting characterization of cells derived from esg mutant ISCs (or that of corresponding wild-type counterparts, in control animals). Clones of esgG66 mutant cells did not appear grossly different from wild-type clones at early time points (Fig1C, 4 dphs); however, quantification of Prospero-expressing (Pros+) cells within esgG66 clones revealed a significant enrichment of EE cells (Fig1D). At later time points, esgG66 clones were significantly smaller than control clones (Fig1C and E, 10 dphs) and remained significantly enriched for EE cells (Fig1D).
We used CellProfiler (Carpenter et al, 2006; Kamentsky et al, 2011) to automatically classify and quantify cells within GFP+ esgG66 and control clones (Supplementary Fig S1B and Supplementary Table S1; see Materials and Methods for details). Our analysis showed a higher prevalence of multicellular esgG66 clones that contained only differentiated cells, consistent with a role for Esg in ISC maintenance (polyploid ECs, EE cells or combinations thereof, examples are shown in Supplementary Fig S1C, insets iv and v). The proportion of esgG66 that did not contain ISCs or EBs was approximately double that of wild-type counterparts, both at 4 and 10 dphs (Supplementary Fig S1D). In addition, esgG66 clones lacking ISC/EBs had a significantly larger proportion of EE cells compared to controls (Supplementary Fig S1E). Of note, the frequency of wild-type clones that lost the ISC at 4 dphs (12.5%) is in close agreement with previously reported rates of symmetric/differentiating ISC divisions (O'Brien et al, 2011; Goulas et al, 2012; de Navascues et al, 2012). Particularly evident among esgG66 GFP+ clones were instances of Pros+ doublets (Supplementary Fig S1C, inset v), which were only rarely observed in control clones (3.13% of esgG66 clones with more than one cell vs. 0.26% of control clones, Supplementary Table S1).
To confirm these findings, we used the GAL4-UAS system to induce RNAi-mediated knockdown of Esg expression. Specifically, a UAS-esgRNAi construct (referred to as esgRNAi hereafter) was expressed under control of a drug-inducible GAL4 driver, 5961GS, whose expression pattern recapitulates esg expression in the digestive tract (Biteau et al, 2010; Mathur et al, 2010). Esg knockdown caused an alteration in the morphology of ISC/EBs, some of which appeared larger and had an overall morphology reminiscent of ECs (arrows in Fig1F). In addition, a striking accumulation of Pros+ EE cells was observed (Fig1F and G), with the total proportion doubling after 6 days of esgRNAi induction. Similar results were obtained with an independent UAS-esgRNAi line (Supplementary Fig S1F) and with another inducible and considerably stronger ISC/EB-specific GAL4 driver (esg-Gal4, tub-Gal80ts, referred to as “esgts” hereafter) (Supplementary Fig S3C and D). Taken together, these data indicate that loss of esg function in ISC/EBs leads to a progressive loss of ISCs and a shift in differentiation toward the EE lineage.
To determine in which cell type Esg is required to influence cell fates, we directed the expression of UAS-esgRNAi to ISCs or EBs. Restricted expression of UAS-esgRNAi and a UAS-2xYFP reporter to ISCs (Wang et al, 2014) revealed morphological changes in YFP+ cells consistent with the induction of ISC differentiation (Fig2A, Supplementary Fig S2A). In addition, a significant accumulation of EE cells (Fig2C) was also observed. Depletion of Esg exclusively in EBs, with a temperature-sensitive version of a Su(H)-Gal4 driver (referred to as Su(H)-Gal4ts, Supplementary Fig S2B) (Zeng et al, 2010), also led to an alteration in the size and morphology of EBs, including some cells that resembled polyploid ECs (Fig2B, arrows). Interestingly, there was an even more striking and significant enrichment of EE cells (Fig2B and D), indicating that the loss Esg function in EBs is sufficient to accelerate their differentiation and bias their fate toward the EE lineage.
Figure 2. Loss of Esg function causes an accumulation of EE cells and an altered EB morphology.

- Phenotypes caused by depletion of esg in ISCs. Midguts of the indicated genotype were stained with DAPI (all nuclei), YFP (primarily ISCs) and Pros (EE cells) following 6 days of incubation at the indicated temperatures (control = outcross to w1118 flies).
- Phenotypes caused by depletion of esg in EBs. Midguts of the indicated genotypes were stained with DAPI (all nuclei), GFP (EBs) and Pros (EE cells) following 6 days of incubation at 29°C to allow the EB-restricted expression of UAS-esgRNAi or a UAS-GFPnls (control). Notice the stronger nuclear GFP staining in control samples due to GFPnls expression. Arrows point to examples of EBs with a wider cytoplasm, dimmer GFP staining and seemingly polyploid nuclei following Esg knockdown.
- EE cell accumulation induced by depletion of esg in ISCs. CellProfiler was used as in Fig1G to quantify the relative proportions of EE cells in midguts in images as those in (A). *** and * denote a statistically significant difference in the relative proportion of EE cells in pairwise post-test comparisons indicated by the corresponding bars (P < 0.001 and P < 0.05 Kruskal–Wallis/Dunn test).
- EE cell accumulation induced by depletion of esg in EBs. CellProfiler was used as in (C). *** denotes a statistically significant accumulation of EE cells following EB-specific Esg knockdown, as compared to all other samples (P < 0.001, Kruskal–Wallis/Dunn test).
Data information: Scale bars = 20 μm.
Loss of Escargot function in ISC/EBs correlates with reduced Notch activity in EBs
Numerous reports have established a connection between activation of the Notch signaling pathway and cell fate decisions in the intestine (Micchelli & Perrimon, 2006; Ohlstein & Spradling, 2006, 2007; Maeda et al, 2008; Bardin et al, 2010; Perdigoto et al, 2011). Notch is a transmembrane receptor that, upon binding to its ligands Delta or Serrate, undergoes a series of proteolytic cleavages leading to the cytoplasmic release of its intracellular domain (NICD or Nintra). Nintra translocates into the nucleus and binds Suppressor of Hairless, Su(H), a co-factor through which Notch activates the expression of its target genes (Koch et al, 2013). Targeted depletion of Esg in ISC/EBs caused a noticeable reduction in the expression of a Su(H)-lacZ reporter of Notch activation in EBs (Supplementary Fig S3A), including those adjacent to ISCs that continued to express Delta (Fig3A). These data indicate that loss of Esg leads to a decrease in N signaling between ISCs and EBs. In support of these observations, a modest induction of esgRNAi expression in flies heterozygous for a null allele of Notch (N81K1) noticeably enhanced the accumulation of EE cells, which was not obvious in either the esgRNAi or the N81K1/+ background (Fig3B). In 17% of midguts examined (n = 18), supernumerary esg-GFP+ diploid cells were observed, along with a striking accumulation of EE cells, reminiscent of the characteristic phenotypes caused by Notch loss-of-function mutations (Supplementary Fig S3B).
Figure 3. Loss of Esg function in ISC/EBs leads to decreased Notch activity in EBs.

- A Esg knockdown in ISC/EBs causes reduced Notch reporter activity in EBs. Use of a Notch (N) activity reporter (Su(H)-lacZ; Bray & Furriols, 2001) reveals a noticeable reduction in N signaling within EBs, despite of seemingly unaltered Delta expression in ISCs. Midguts of the indicated genotypes were stained with DAPI (all nuclei), Delta (ISCs) and β-GAL (EBs) following 4 days of incubation in 10 μg RU486/ml or ethanol-containing food as indicated.
- B Epistasis analysis between Esg (esgRNAi) and Notch (N81K1). Midguts of the indicated genotypes were stained with DAPI (all nuclei), GFP (esg+ cells) and Pros (EE cells) following 6 days of incubation in 5 μg/ml RU or ethanol, as indicated. Notice that a lower concentration of RU486, resulting in a more moderate induction of esgRNAi expression, did not produce the larger and dimmer GFP+ nuclei or EE cell accumulation typically observed with higher doses of RU486. Approximately 83% (15/18) of the N81K1/+; esgRNAi guts showed a noticeable accumulation of EE cells in an otherwise normal-looking epithelium (right column, middle panel), whereas the remaining 17% showed a drastic expansion of diploid, esg+ and EE cells (right column, lower panel), reminiscent of stronger Notch loss-of-function mutations (compare with Supplementary Fig S3B).
- C, D Constitutively active Notch signaling rescues the EE cell enrichment phenotype caused by Esg knockdown. (C) An esgRNAi construct and a constitutively active Notch construct (Nintra) were expressed alone or in combination in ISC/EBs using the 5961GS driver. Midguts of the indicated genotypes were stained for GFP, β-GAL (EBs) and Pros (EE cells) following 7 days of incubation in ethanol or 25 μg/ml RU486 as indicated. (D) Images as those in (C) were processed with CellProfiler to quantify the relative proportion of EE cells. Midguts overexpressing the esgRNAi construct alone were the only sample that showed a significant EE enrichment relative to the corresponding EtOH control (***P < 0.001, one-way ANOVA/Bonferroni test).
Data information: Scale bars = 20 μm.
If the accumulation of EE cells upon Esg knockdown was due to a reduction in Notch activity within EBs, then ectopic activation of the Notch pathway through forced expression of a constitutively active Notch construct should preserve the normal balance between EEs and ECs. Expression of UAS-Nintra in ISCs and EBs with the inducible 5961GS driver resulted in strong activation of the Su(H)-lacZ reporter in both ISC and EBs (Fig3C). Furthermore, as predicted, co-expression of Nintra and esgRNAi in ISC/EBs resulted in a suppression of ectopic EE cells (Fig3C and D). Similar results were obtained by expressing both transgenes with the esgts driver (Supplementary Fig S3C and D). Restricted expression of Nintra and esgRNAi to EBs, using the Su(H)-Gal4ts driver, resulted in lethality, even at the restrictive temperature (18°C), likely due to leaky expression in other tissues during development.
Interestingly, expression of Nintra alone in ISC/EBs led to an expected trend toward EC enrichment, which became highly significant when Nintra was expressed in combination with esgRNAi (Supplementary Fig S3E). Similarly, there was a significant accumulation of ECs following expression of esgRNAi alone, likely a consequence of ISC depletion due to loss of Esg. To address whether the proposed accumulation of EE cells reflected the non-specific, relative accumulation of ECs and EEs as a result of ISC/EB loss, we calculated the relative proportion of EEs to ECs (Supplementary Fig S3F). However, this analysis confirmed the enrichment of EE cells, relative to ECs. Furthermore, the co-expression of Nintra and esgRNAi fully reversed this trend, as predicted by the model that activated Notch rescues the bias toward the EE fate in favor of EC differentiation. In summary, reduced activation of the Su(H)-lacZ reporter following esg knockdown (Fig3A and Supplementary Fig S3A), together with the observation that Nintra is epistatic to esgRNAi (Fig3C and D and Supplementary Fig S3D), strongly suggests that Notch functions downstream of Esg to regulate cell fate decisions in the intestine.
Amun is a candidate Esg target in ISCs/EBs
In order to identify mediators of Esg function in ISC/EBs, we used DamID to conduct a genome-wide in vivo mapping of Esg binding to DNA (van Steensel & Henikoff, 2000; Southall & Brand, 2009). A fusion of Esg and the bacterial DNA methylase Dam was expressed in flies, which led to the methylation of DNA surrounding Esg binding sites in vivo. Genomic DNA was then extracted from midguts, and the methylated regions were labeled and hybridized to whole-genome tiling arrays (see the Supplementary Materials and Methods for further details). Putative targets of Esg in the intestine were then identified by proximity to the methylated regions identified via DamID, or “Esg binding regions” (EBRs) (Supplementary Table S2).
We then used FlyMine to cross-reference genetic interactors of Notch with a list of in vivo DamID targets of Esg (Supplementary Table S2). From this approach, we identified Amun as a putative candidate (Fig4A). Amun is a nuclear protein with a predicted DNA glycosylation domain, which has been shown to suppress Delta gain-of-function phenotypes when overexpressed in the eye and the wing (Shalaby et al, 2009) and to cause the formation of extra scutellar bristles when overexpressed in wing imaginal disks (Abdelilah-Seyfried et al, 2000). Both phenotypes are consistent with Amun acting as an inhibitor of Notch signaling. Accordingly, when we overexpressed Amun in ISC/EBs using esg-Gal4ts, we observed a downregulation in Su(H)-lacZ expression (Fig4B) and a corresponding enrichment of EE cells (Fig4C). We confirmed these observations using the 5961GS driver, which led to more subtle, but reproducible, phenotypes (Supplementary Fig S4).
Figure 4. Amun is a candidate target of Esg.
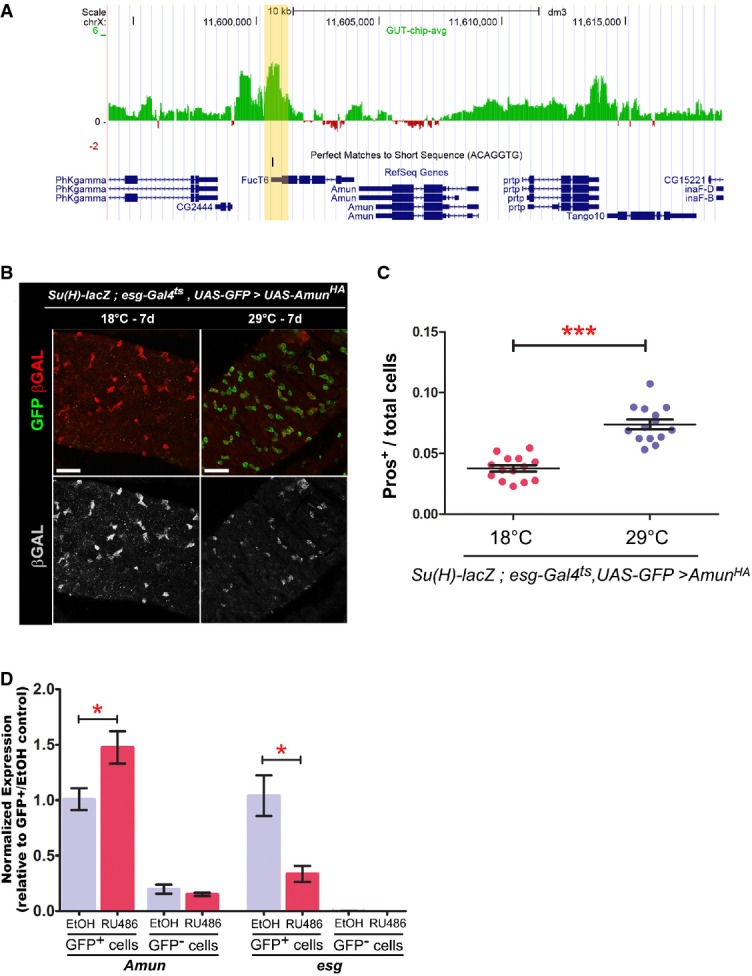
- A Esg DamID profile surrounding the Amun locus. Data are displayed as custom UCSC Genome Browser tracks. Green/red bars represent the average log2 (intensity ratio) between the Esg:Dam and Dam-control samples, mapped to the genomic regions ± 10 kb from Amun (see Supplementary Materials and Methods for further details). The yellow shading highlights an Esg-bound region (EBR), which includes a consensus Esg E-box ([G/A]CAGGTG; Fuse et al, 1994).
- B, C Amun overexpression in ISC/EBs resembles a reduction in N signalling. (B) Midguts of the indicated genotype were stained with DAPI (nuclei), GFP (ISC/EB) and β-GAL (N activation). (C) CellProfiler quantification of the relative proportion of EE cells in midguts from (B). A similar result was obtained using the milder 5961GS driver (Supplementary Fig S4). ***P < 0.001, Mann–Whitney U-test. Scale bars = 20 μm.
- D Amun mRNA upregulation following Esg knockdown in ISC/EBs. qPCR measurements of relative transcript abundances for the indicated genes from esg-GFP+ and esg-GFP− cells isolated by FACS sorting from esg-GFP, 5961GS > UAS-esgRNAi flies incubated on ethanol or RU486 (25 μg/ml for 3 days) to induce RNAi expression. Shown are means (± SEM) of efficiency-corrected relative quantities for each primer set, normalized to the corresponding GFP+/EtOH sample and to RpL32 levels (used as reference). * denotes a significant reduction in esg and an increase in Amun transcript levels, respectively (P < 0.05, two-tailed unpaired Student's t-test).
To further explore the relationship between Esg and Amun, we tested the hypothesis that Esg knockdown would lead to upregulation (de-repression) of Amun. Analysis of Amun mRNA expression in whole intestines by reverse transcriptase (RT)–qPCR showed a modest but statistically significant upregulation in Amun following Esg knockdown (Supplementary Fig S5A). Because such slight upregulation could be a consequence of ISC/EBs representing only a very small proportion of the intestinal biomass, RT–qPCR measurements were repeated in ISC/EBs purified by FACS sorting from dissociated intestines (Dutta et al, 2013) (Supplementary Fig S5B). This complementary approach confirmed the upregulation in Amun mRNA levels following Esg knockdown (Fig4D). We also assayed Amun expression in posterior midguts via fluorescent in situ hybridization/immunofluorescence (FISH/IF) staining (Toledano et al, 2012). Although Amun mRNA was undetectable in ISC/EBs of control guts using this method, some expression could be detected within esg-GFP+ progenitor cells following RNAi-mediated depletion of esg (Supplementary Fig S5C).
If Amun de-repression mediates the downregulation of Notch signaling in EBs caused by Esg depletion, then the co-expression of an AmunRNAi construct along with esgRNAi should rescue the bias in cell fates toward the EE cell lineage. We tested this prediction by co-expressing esgRNAi and AmunRNAi in EBs using the Su(H)-Gal4ts driver. While expression of AmunRNAi alone had no effect on the proportion of EE cells or morphology of EBs, the overexpression of AmunRNAi rescued the EE enrichment phenotype induced by Esg knockdown (Fig5A and B). Similar results were obtained with two independent genomic insertions of the UAS-AmunRNAi construct (Supplementary Fig S6A and B). Importantly, the co-expression of AmunRNAi also rescued the downregulation of Notch activity in EBs induced by Esg knockdown (Supplementary Fig S7). Altogether, our data support a model in which downregulation of Esg led to a de-repression of Amun, which results in reduced Notch signaling and biased differentiation of the EB toward the EE fate.
Figure 5. RNAi-mediated downregulation of Amun in EBs rescues the EE cell bias caused by loss of esg.
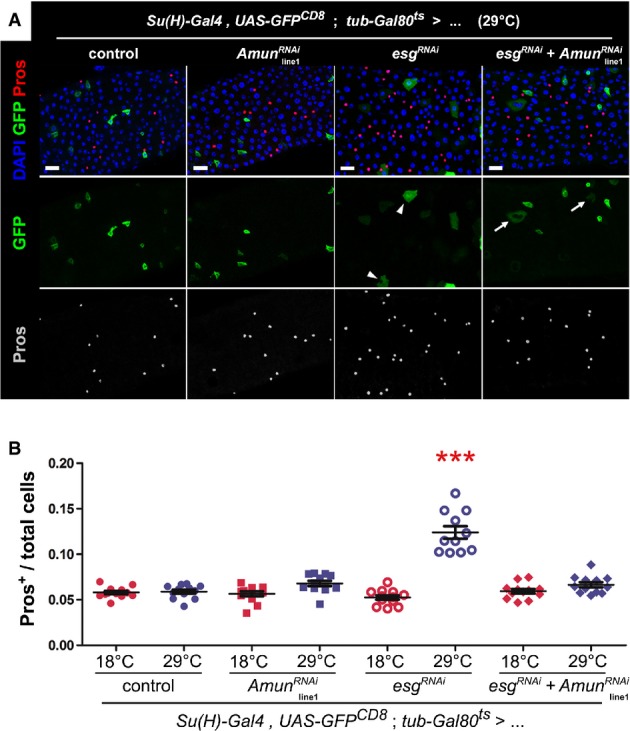
- Immunostaining of midguts following EB-restricted co-downregulation of Amun and esg. Midguts from flies of the indicated genotypes were incubated for 6 days at 29°C and stained for DAPI (all nuclei), GFP (EBs) and Pros (EE cells). “Control” = the Su(H)ts driver stock outcrossed to wild-type flies. The AmunRNAi construct shown is inserted on chromosome II (“line1”; Supplementary Fig S6A and B shows the same experiment with an independent insertion of the same AmunRNAi construct on chromosome X, or “line2”). The esgRNAi flies also carry a UAS-GFPnls construct in the background (to control for GAL4 titration), which explains the nuclear GFP staining of EBs in these midguts. Notice that the alterations in EB morphology caused by Esg knockdown (arrowheads) are only partially rescued by the co-expression of AmunRNAi (arrows; see also Supplementary Fig S6A). Scale bars = 20 μm.
- Abrogation of EE cell enrichment by co-downregulation of Esg and Amun. CellProfiler was used to quantify relative EE cell proportions (as before). Genotype-matched controls were kept for 10–11 days at 18°C. *** denotes the only sample that was significantly different from all other samples in the set, including its genotype match at 18°C (P < 0.001, one-way ANOVA/Bonferroni test).
Discussion
Our data indicate that the transcription factor Escargot, a marker of intestinal stem cells and enteroblasts in Drosophila, plays a significant, dual role in maintaining intestinal homeostasis. Through clonal analysis of a null allele of esg and induced RNAi-mediated knockdown in ISC/EBs, we conclude that Esg is required for ISC maintenance. In addition, loss of esg biases the differentiation of EBs toward the EE lineage (Fig1 and Supplementary Fig S1). Together with data from our colleagues, who evaluated gene expression changes upon modulation of Esg (Korzelius et al, 2014), our findings suggest that Esg represses differentiation in ISCs to support stem cell maintenance and enhances N signaling in EBs to influence differentiation (Fig6). Interestingly, we have found that Esg may play analogous roles in the Drosophila testis, where it regulates maintenance of somatic cyst stem cells (CySCs) and maintains somatic niche support cells in a differentiated state (Voog et al, 2008, 2014). Therefore, Esg appears to act at central nodes to regulate the behavior of stem cells, as well as differentiated cell types, in multiple tissues.
Figure 6. Dual regulation of intestinal stem cells and their progeny by Escargot.
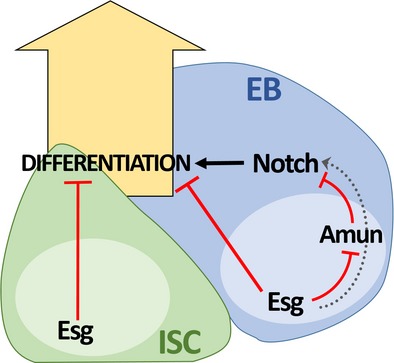
Schematic summary of the findings. Esg is required for ISC maintenance by inhibiting differentiation. In addition, Esg influences EB differentiation by inhibiting the expression of Amun, a Notch inhibitor, which indirectly leads to the positive modulation of Notch activity within EBs (dashed gray arrow).
In addition to an accumulation of EE cells, loss of Esg also resulted in decreased expression of a Notch signaling reporter, Su(H)-lacZ, in EBs, suggesting that Esg modulates Notch activity in the intestine. Alternatively, the decreased expression of the Su(H)-lacZ reporter could be due to the induced differentiation of ISC/EBs. However, the reduced activity of this reporter occurred in diploid cells that maintained ISC/EB marker expression (Supplementary Figs S3A and S7). In addition, the co-expression of both Nintra and AmunRNAi together with esgRNAi in ISC/EBs rescued the Notch signaling defect, as reflected by this reporter, without affecting the changes in morphology consistent with differentiation (Fig3C and Supplementary Fig S7). Therefore, the effects of esg depletion on the Su(H)-lacZ reporter and induction of differentiation can be uncoupled. Perhaps the strongest evidence that Esg interacts genetically with Notch in this system is that moderate knockdown of esg in a Notch heterozygous mutant background led to a phenotype reminiscent of strong Notch loss–of-function mutations: accumulation of ISC-like cells and EEs (Fig3B). In these cases, the loss of Esg function must have led to a decrease in Notch signaling that preceded the commitment of progenitor cells to differentiate.
EB-specific expression of esgRNAi with Su(H)-Gal4 was sufficient to cause a bias in differentiation toward the EE fate. However, restricting the expression of esgRNAi to ISCs using the esg-Gal4/Su(H)-Gal80 system also led to a significant accumulation of EE cells (Fig2A and C), which would indicate that the loss of Esg in stem cells is sufficient to bias the fate choice of the EB. However, as expression of the Su(H)-Gal80 transgene is under control of Notch signaling, one caveat of this experiment is that expression of the RNAi construct may not be fully restricted to ISCs, as the ability of GAL80 to repress GAL4 in the EB could be partially blocked by the reduction in Notch signaling induced by the loss of Esg (Supplementary Fig S2A). Regardless, a recent report suggested that the EE fate is indeed pre-determined in a small proportion of esg+ ISCs that co-express Prospero (Biteau & Jasper, 2014). Therefore, one interpretation of these data is that Esg is required in the ISC to repress commitment to the EE fate. Indeed, we noted a rather striking frequency of esg+ cells that also expressed Prospero in samples where esgRNAi expression was restricted to ISCs (Supplementary Fig S2A, yellow arrowheads). Intriguingly, we have not observed a similar increase in the frequency of esg/Pros double-positive cells in any other genotypes that express esgRNAi in ISCs and cause EE cell enrichment. One interesting explanation for the difference in results when esg depletion is restricted to ISCs versus expressed in ISC/EBs might be that an Esg-dependent feedback signal emanating from EBs induces the ISC to express Pros, which is inhibited in crosses involving ISC/EB drivers (e.g., esg-Gal4, 5961GS, etc.).
Genome-wide mapping of Esg binding to DNA identified Amun as a putative target of Esg. Amun overexpression has been shown to suppress Delta gain-of-function phenotypes, as well as Notch-mediated lateral inhibition during scutellar bristle development (Abdelilah-Seyfried et al, 2000; Shalaby et al, 2009). Here, we show that Amun overexpression in ISC/EBs also caused a moderate, but reproducible, decrease in Notch activity within EBs, and a consequent enrichment in EE cells (Fig4B and C). Quantitative RT–PCR revealed that Amun is indeed upregulated upon Esg knockdown (Fig4D), and the simultaneous downregulation of Amun and esg suppressed the bias toward EE cell fate. Also consistent with our data, Amun expression was downregulated approximately 1.5-fold upon overexpression of Esg in S2 cells, as determined by gene expression microarrays (Sandall and Jones, unpublished observations). Therefore, we conclude that Esg represses Amun expression in ISC/EBs, thereby positively regulating Notch signaling to influence EB fate decisions.
Interestingly, the direct overexpression of Amun in ISC/EBs caused a modest, yet significant, accumulation of EE cells (Fig4B and C and Supplementary Fig S4B and C), whereas knocking down esg expression caused a more striking EE enrichment, accompanied by a slight increase in Amun mRNA levels (Fig4D). These observations indicate that the downregulation of Amun by Esg is only one of diverse mechanisms, both Notch dependent and independent, by which Esg regulates the biology of ISCs and differentiating progenitor cells. Accordingly, the manipulation of Esg in ISC/EBs revealed significant differences in mRNA levels of other Notch pathway regulators, including some members of the Enhancer of split Complex (E(spl)-C) and Notch itself (Korzelius et al, 2014).
Altogether, our data support a model whereby Esg inhibits differentiation directly in the ISC, whereas the positive regulation of Notch signaling by Esg in EBs influences differentiation along the EC lineage (Fig6). As Notch signaling should only occur after the ISC has divided (which permits the binding between Delta and Notch in opposing membranes), this allows Esg to influence signaling in the EB only after ISC division. Therefore, our data suggest that Esg plays a critical role in the regulation of ISCs, maintaining the undifferentiated state of the stem cell while setting up a series of regulatory mechanisms that, once the stem cell divides, promote and regulate the differentiation of its progeny (Fig6). Given our data for Esg in both the testis and intestine (Voog et al, 2014), we hypothesize that the ability of core stem cell factors to serve dual roles in stem and differentiating cells is a rather general mode of action.
Integrating Esg transcriptional profiling and genome mapping data will likely lead to more comprehensive testable models of ISC regulation by Esg and thus provide a basis for comparative studies involving other stem cell systems, both in flies and across species. Indeed, recent studies have demonstrated that mammalian Snail1 is expressed in and regulates the maintenance of murine intestinal stem cells (crypt base columnar (CBC) cells) (Horvay et al, 2011) (Horvay et al, in preparation). Upon conditional loss of Snai1, Horvay et al observed a bias toward the secretory lineages, similar to our observations in the fly, suggesting that the Snail family may be evolutionarily conserved regulators of intestinal homeostasis. In addition to CBC cells, Snail family members are expressed in other mammalian stem/progenitor cell populations (Guo et al, 2012; Nassour et al, 2012; Soleimani et al, 2012), and Snail1 has an established role in regulating epithelial–mesenchymal transitions (EMT) during development, initiation of metastasis and de-differentiation of cells back to a stem cell-like state (Mani et al, 2008). Therefore, understanding the mechanisms by which Esg simultaneously regulates stem cell maintenance and progenitor cell differentiation will likely provide insights into the role of the Snail family during normal development, as well as cancer initiation and progression.
Materials and Methods
Fly stocks and GAL4/UAS systems
A detailed list of fly stocks and their origin is provided in the Supplementary Materials and Methods section. Two inducible GAL4/UAS systems were used in this study: the GeneSwitch system (Osterwalder et al, 2001; Roman et al, 2001) and the Target system (McGuire et al, 2003, 2004). All crosses with the GeneSwitch driver were carried out at 25°C. Crosses with the TARGET system were set up and maintained at 18°C until eclosion. In both cases, adults were kept for an additional 2–3 days and induced at 3–4 days after eclosion by placement on RU food (in concentrations ranging between 5 and 25 μg/ml, as indicated) or at 29°C and flipped every 2 days thereafter (see the Supplementary Information for more details.)
Antibodies and immunofluorescence (IF)
Based on a recent characterization of anatomical and functional compartments of the posterior midgut (Marianes & Spradling, 2013), all of our experiments were carried out in the P3-P4 regions, located by centering the pyloric ring in a 40× field of view (fov) and moving 1–2 fov toward the anterior. In FISH/IF experiments, and given that guts are more easily damaged, images typically correspond to the region just anterior to the pyloric ring. Posterior midguts were dissected in ice-cold PBS/4% formaldehyde and incubated for an additional 30 min in fixative at room temperature. Samples were then washed four times, for 5 min each, in PBS containing 0.1% Triton X-100 (PBT-1), blocked for 30 min in PBT-1/3% bovine serum albumin and immunostained with primary antibodies overnight at 4°C. Samples were then washed 4 × 5 min at room temperature in PBT-1, incubated with secondary antibodies at room temperature for 2 h, washed again as before and mounted in VectaShield®/DAPI (Vector Laboratories, H-1200). A detailed list of antibodies, their source and concentration is provided in the Supplementary Information.
Fluorescence in situ hybridization/immunofluorescence staining (FISH/IF)
We have previously published a detailed version of the FISH/IF protocol used in this study (Toledano et al, 2012). Briefly, posterior midguts were dissected in ice-cold PBS/DEPC, fixed in 4% formaldehyde for 30 min at room temperature and incubated with the primary antibodies overnight at 4°C in a buffer containing yeast tRNA, heparin and RNase inhibitors. The midguts were then washed, incubated with secondary antibodies, post-fixed and, following a series of washes and buffer equilibration steps, incubated with 1 μg/ml of the corresponding DIG-labeled RNA probes at 65°C overnight. Following additional washes and buffer equilibration steps, the midguts were incubated with an anti-DIG antibody conjugated to horseradish peroxidase (HRP, Roche, 11207733910) at 4°C overnight. Finally, probes were detected using a TSA™ Cy3 kit (NEL704A001KT), following the manufacturer's instructions. The esg probe was made from full-length cDNA, following the labeling protocol in Toledano et al (2012). The Amun probe corresponds to nucleotides 869–1821 in the CDS region of the Amun mRNA.
MARCM clonal analysis
yw,hs-flp122; esgG66, FRT40A/tub-Gal80, FRT40; UAS-2xGFP/tub-Gal4 flies were heat-shocked twice in a 12-h period (1 h at 37°C each), 3–4 days after eclosion. Flies were returned to 25°C and their midguts dissected 4 or 10 days later. Control clones were obtained by replacing esgG66, FRT40 with a wild-type FRT40 chromosome.
CellProfiler quantification
Images were originally obtained as z-stacks with a typical slice thickness of 750 nm. ImageJ was used to generate maximum or average projections from each channel, which were saved as individual TIFF or JPEG files. The images were then processed using ad hoc CellProfiler pipelines (available upon request). Four images were taken per gut, two on each side (top and bottom), from contiguous fov, starting at 1 fov from the pylorus (as explained above). For measurements of EE cell proportions, the Pros+/total cell ratios were determined for each image and average ratios from the four images corresponding to a single gut were used in subsequent analyses.
Statistical analysis
All our statistical analysis and graphical display of the data were performed using Prism5 (GraphPad). Datasets were subjected to a D'Agostino normality test, and parametric or non-parametric testing was used accordingly (and as indicated in figure legends).
In vivo DamID
Whole midguts were dissected from flies expressing ubiquitous low levels of a Dam:Esg fusion protein (or control flies expressing Dam alone), immediately frozen on dry ice and transferred to −80°C. Genomic DNA was isolated from approximately 50 midguts per genotype and processed following the protocol in Choksi et al (2006) (see Supplementary Materials and Methods for details). Triplicate samples of labeled DNA were hybridized with a dye-swap to NimbleGen 2.1 M whole-genome tiling arrays (Roche) at the FlyChip facility (http://www.flychip.org.uk). Original data are deposited in NCBI's Gene Expression Omnibus under accession number GSE55226. DamID data were analyzed to identify Esg binding regions (EBRs) with minor modifications to the protocol in Southall and Brand (2009).
RT–qPCR on whole guts
Whole guts from Su(H)-lacZ; esg-GFP, 5961-Gal4GS; UAS-esgRNAi females incubated on 10 μg/ml RU or EtOH food for 4 days were dissected and immediately frozen at −80°C, until approximately 250 guts per treatment group had been collected. Total RNA was extracted with TRIzol® (Life Technologies, cat#15596026), following the manufacturer's instructions. After confirming the integrity of the RNA sample by gel electrophoresis, 2 μg of RNA were treated with DNase Q1 (Promega, cat#M610A) in a 20 μl reaction volume. 10 μl of the DNase Q1-treated RNA were reverse-transcribed using the iScript kit (Bio-Rad, cat#170-8841, 2.5 μl were used to make a corresponding no-RT control sample). Standard qPCRs were carried out on a Bio-Rad CFX96/C1000 Touch system (Bio-Rad), using SsoAdvanced SYBR®Green (Bio-Rad, cat#1725-264). The following are the primer sequences used: RpL32 Fwd: ATCGTGAAGAAGCGCACCAA; RpL32 Rev: TGTCGATACCCTTGGGCTTG; GFP Fwd: TCCGCCCTGAGCAAAGAC; GFP Rev: GAACTCCAGCAGGACCATGTG; Amun Fwd: TAAACACCAGCCGGTCACTT; Amun Rev: GATGCGGATGTGTCGTTGTC.
RT–qPCR on FACS-purified intestinal cells
The protocol for gut dissociation and FACS sorting was carried out with minor modifications from Dutta et al (2013) (see the Supplementary Information for more details). Whole guts from Su(H)-lacZ; esg-GFP, 5961GS; UAS-esgRNAi females incubated on 25 μg/ml RU or EtOH food for 3 days were dissected in ice-cold DEPC/PBS and immediately digested with trypsin and elastase. Dissociated intestinal cells were collected by gentle centrifugation, filtered and sorted by FACS. Ten thousand GFP+ or GFP− cells were sorted directly into 30 μl of lysis buffer. Total RNA was extracted using the ArrayPure™ Nano-scale RNA Purification Kit (Epicentre, cat# MPS04050) and amplified using the MessageBOOSTER™ cDNA Synthesis Kit (Epicentre, cat# MB060124). The cDNA obtained was diluted 30× and used directly for qPCR measurements, using the following primer sequences: RpL32 Fwd: GCCGCTTCAAGGGACAGTAT; RpL32 Rev: ACTTCTTGAATCCGGTGGGC; esg Fwd: CGCCAGACAATCAATCGTAAGC; esg Rev: TGTGTACGCGAAAAAGTAGTGG; Amun Fwd: CCCGATCCAGAAGGCAGTAA; Amun Rev: TCTGCTGCTTGTTCTTCGGAT.
Acknowledgments
We thank H. Jasper, B. Ohlstein, L. Cooley, A. Christiansen, B. Baker, B. Edgar, S. Hou, N. Perrimon, GH. Baeg, B. Glise, the Vienna Drosophila RNAi Center (VDRC), Harvard Transgenic RNAi Project (TRiP) and Bloomington Stock Center for reagents and fly stocks. We are also grateful to Allison Bardin, Jerome Korzelius and Bruce Edgar for critical reading of the manuscript, and to Katia Horvay, Gary Hime and Helen Abud for sharing unpublished work related to this manuscript. We thank Cecilia D'Alterio for assistance and reagents used in our FISH/IF analysis, William Ansari for valuable experimental assistance, Jia Wu for help with the Perl script used in our DamID analysis, Pavan Kendale for guidance using CellProfiler, Haibin Xi for assistance with qPCR and the David Walker laboratory for assistance with GeneSwitch experiments. We also thank Felicia Codrea and Jessica Scholes from the UCLA Broad Stem Cell Research Center Flow Cytometry Core Resource for their technical support and advice for FACS sorting. S.L.S. was supported by a postdoctoral fellowship from the Damon Runyon Cancer Research Foundation and the UCSD IRACDA program. This work was supported by the American Cancer Society, the California Institute for Regenerative Medicine, the Eli and Edythe Broad Center of Regenerative Medicine and Stem Cell Research at the University of California, Los Angeles, and the NIH (D.L.J).
Author contributions
MLC and DLJ planned experiments. MLC performed the experiments and data analysis. TDS and AB generated the reagents used for DamID analysis; MLC and TDS carried out the DamID protocol and data analysis. SLS generated reagents used in the study. MLC and DLJ wrote and edited the manuscript.
Conflict of interest
The authors declare that they have no conflict of interest.
Supporting Information
Supplementary information for this article is available online: http://emboj.embopress.org
Supplementary Figures
Supplementary Information
Supplementary Table S2
Review Process File
References
- Abdelilah-Seyfried S, Chan YM, Zeng C, Justice NJ, Younger-Shepherd S, Sharp LE, Barbel S, Meadows SA, Jan LY, Jan YN. A gain-of-function screen for genes that affect the development of the Drosophila adult external sensory organ. Genetics. 2000;155:733–752. doi: 10.1093/genetics/155.2.733. [DOI] [PMC free article] [PubMed] [Google Scholar]
- Amatruda JF, Zon LI. Dissecting hematopoiesis and disease using the zebrafish. Dev Biol. 1999;216:1–15. doi: 10.1006/dbio.1999.9462. [DOI] [PubMed] [Google Scholar]
- Ashraf SI, Hu X, Roote J, Ip YT. The mesoderm determinant snail collaborates with related zinc-finger proteins to control Drosophila neurogenesis. EMBO J. 1999;18:6426–6438. doi: 10.1093/emboj/18.22.6426. [DOI] [PMC free article] [PubMed] [Google Scholar]
- Bardin AJ, Perdigoto CN, Southall TD, Brand AH, Schweisguth F. Transcriptional control of stem cell maintenance in the Drosophila intestine. Development. 2010;137:705–714. doi: 10.1242/dev.039404. [DOI] [PMC free article] [PubMed] [Google Scholar]
- Barrallo-Gimeno A, Nieto MA. The Snail genes as inducers of cell movement and survival: implications in development and cancer. Development. 2005;132:3151–3161. doi: 10.1242/dev.01907. [DOI] [PubMed] [Google Scholar]
- Biteau B, Karpac J, Supoyo S, Degennaro M, Lehmann R, Jasper H. Lifespan extension by preserving proliferative homeostasis in Drosophila. PLoS Genet. 2010;6:e1001159. doi: 10.1371/journal.pgen.1001159. [DOI] [PMC free article] [PubMed] [Google Scholar]
- Biteau B, Hochmuth CE, Jasper HCPCN. Maintaining tissue homeostasis: dynamic control of somatic stem cell activity. Cell Stem Cell. 2011;9:402–411. doi: 10.1016/j.stem.2011.10.004. [DOI] [PMC free article] [PubMed] [Google Scholar]
- Biteau B, Jasper H. Slit/Robo signaling regulates cell fate decisions in the intestinal stem cell lineage of Drosophila. Cell Rep. 2014;7:1867–1875. doi: 10.1016/j.celrep.2014.05.024. [DOI] [PMC free article] [PubMed] [Google Scholar]
- Bray S, Furriols M. Notch pathway: making sense of suppressor of hairless. Curr Biol. 2001;11:R217–R221. doi: 10.1016/s0960-9822(01)00109-9. [DOI] [PubMed] [Google Scholar]
- Cai Y, Chia W, Yang X. A family of snail-related zinc finger proteins regulates two distinct and parallel mechanisms that mediate Drosophila neuroblast asymmetric divisions. EMBO J. 2001;20:1704–1714. doi: 10.1093/emboj/20.7.1704. [DOI] [PMC free article] [PubMed] [Google Scholar]
- Carpenter AE, Jones TR, Lamprecht MR, Clarke C, Kang IH, Friman O, Guertin DA, Chang JH, Lindquist RA, Moffat J, Golland P, Sabatini DM. Cell Profiler: image analysis software for identifying and quantifying cell phenotypes. Genome Biol. 2006;7:R100. doi: 10.1186/gb-2006-7-10-r100. [DOI] [PMC free article] [PubMed] [Google Scholar]
- Choksi SP, Southall TD, Bossing T, Edoff K, de Wit E, Fischer BE, van Steensel B, Micklem G, Brand AH. Prospero acts as a binary switch between self-renewal and differentiation in Drosophila neural stem cells. Dev Cell. 2006;11:775–789. doi: 10.1016/j.devcel.2006.09.015. [DOI] [PubMed] [Google Scholar]
- Dutta D, Xiang J, Edgar BA. RNA expression profiling from FACS-isolated cells of the Drosophila intestine. Curr Protoc Stem Cell Biol. 2013;27:2. doi: 10.1002/9780470151808.sc02f02s27. Unit 2F. [DOI] [PubMed] [Google Scholar]
- Egger B, Gold KS, Brand AH. Notch regulates the switch from symmetric to asymmetric neural stem cell division in the Drosophila optic lobe. Development. 2010;137:2981–2987. doi: 10.1242/dev.051250. [DOI] [PMC free article] [PubMed] [Google Scholar]
- Fuse N, Hirose S, Hayashi S. Diploidy of Drosophila imaginal cells is maintained by a transcriptional repressor encoded by escargot. Genes Dev. 1994;8:2270–2281. doi: 10.1101/gad.8.19.2270. [DOI] [PubMed] [Google Scholar]
- Gentile L, Cebria F, Bartscherer K. The planarian flatworm: an in vivo model for stem cell biology and nervous system regeneration. Dis Models Mech. 2011;4:12–19. doi: 10.1242/dmm.006692. [DOI] [PMC free article] [PubMed] [Google Scholar]
- Goulas S, Conder R, Knoblich JA. The Par complex and integrins direct asymmetric cell division in adult intestinal stem cells. Cell Stem Cell. 2012;11:529–540. doi: 10.1016/j.stem.2012.06.017. [DOI] [PMC free article] [PubMed] [Google Scholar]
- Guo W, Keckesova Z, Donaher JL, Shibue T, Tischler V, Reinhardt F, Itzkovitz S, Noske A, Zurrer-Hardi U, Bell G, Tam WL, Mani SA, van Oudenaarden A, Weinberg RA. Slug and Sox9 cooperatively determine the mammary stem cell state. Cell. 2012;148:1015–1028. doi: 10.1016/j.cell.2012.02.008. [DOI] [PMC free article] [PubMed] [Google Scholar]
- Hayashi S, Hirose S, Metcalfe T, Shirras AD. Control of imaginal cell development by the escargot gene of Drosophila. Development. 1993;118:105–115. doi: 10.1242/dev.118.1.105. [DOI] [PubMed] [Google Scholar]
- Hemavathy K, Guru SC, Harris J, Chen JD, Ip YT. Human Slug is a repressor that localizes to sites of active transcription. Mol Cell Biol. 2000;20:5087–5095. doi: 10.1128/mcb.20.14.5087-5095.2000. [DOI] [PMC free article] [PubMed] [Google Scholar]
- Horvay K, Casagranda F, Gany A, Hime GR, Abud HE. Wnt signaling regulates Snai1 expression and cellular localization in the mouse intestinal epithelial stem cell niche. Stem Cells Dev. 2011;20:737–745. doi: 10.1089/scd.2010.0188. [DOI] [PubMed] [Google Scholar]
- Inaba M, Yamashita YM. Asymmetric stem cell division: precision for robustness. Cell Stem Cell. 2012;11:461–469. doi: 10.1016/j.stem.2012.09.003. [DOI] [PubMed] [Google Scholar]
- Jiang H, Edgar BA. Intestinal stem cell function in Drosophila and mice. Curr Opin Genet Dev. 2012;22:354–360. doi: 10.1016/j.gde.2012.04.002. [DOI] [PMC free article] [PubMed] [Google Scholar]
- Kamentsky L, Jones TR, Fraser A, Bray MA, Logan DJ, Madden KL, Ljosa V, Rueden C, Eliceiri KW, Carpenter AE. Improved structure, function and compatibility for Cell Profiler: modular high-throughput image analysis software. Bioinformatics. 2011;27:1179–1180. doi: 10.1093/bioinformatics/btr095. [DOI] [PMC free article] [PubMed] [Google Scholar]
- Kiger AA, White-Cooper H, Fuller MT. Somatic support cells restrict germline stem cell self-renewal and promote differentiation. Nature. 2000;407:750–754. doi: 10.1038/35037606. [DOI] [PubMed] [Google Scholar]
- Koch U, Lehal R, Radtke F. Stem cells living with a Notch. Development. 2013;140:689–704. doi: 10.1242/dev.080614. [DOI] [PubMed] [Google Scholar]
- Korzelius J, Naumann SK, Loza-Coll MA, Chan JS, Dutta D, Oberheim J, Glasser C, Southall TD, Brand AH, Jones DL, Edgar BA. Escargot maintains stemness and suppresses differentiation in Drosophila intestinal stem cells. EMBO J. 2014;33:2967–2982. doi: 10.15252/embj.201489072. [DOI] [PMC free article] [PubMed] [Google Scholar]
- Lee T, Luo L. Mosaic analysis with a repressible cell marker for studies of gene function in neuronal morphogenesis. Neuron. 1999;22:451–461. doi: 10.1016/s0896-6273(00)80701-1. [DOI] [PubMed] [Google Scholar]
- Losick VP, Morris LX, Fox DT, Spradling A. Drosophila stem cell niches: a decade of discovery suggests a unified view of stem cell regulation. Dev Cell. 2011;21:159–171. doi: 10.1016/j.devcel.2011.06.018. [DOI] [PMC free article] [PubMed] [Google Scholar]
- Maeda K, Takemura M, Umemori M, Adachi-Yamada T. E-cadherin prolongs the moment for interaction between intestinal stem cell and its progenitor cell to ensure Notch signaling in adult Drosophila midgut. Genes Cells. 2008;13:1219–1227. doi: 10.1111/j.1365-2443.2008.01239.x. [DOI] [PubMed] [Google Scholar]
- Mani SA, Guo W, Liao MJ, Eaton EN, Ayyanan A, Zhou AY, Brooks M, Reinhard F, Zhang CC, Shipitsin M, Campbell LL, Polyak K, Brisken C, Yang J, Weinberg RA. The epithelial-mesenchymal transition generates cells with properties of stem cells. Cell. 2008;133:704–715. doi: 10.1016/j.cell.2008.03.027. [DOI] [PMC free article] [PubMed] [Google Scholar]
- Marianes A, Spradling AC. Physiological and stem cell compartmentalization within the Drosophila midgut. eLife. 2013;2:e00886. doi: 10.7554/eLife.00886. [DOI] [PMC free article] [PubMed] [Google Scholar]
- Mathur D, Bost A, Driver I, Ohlstein B. A transient niche regulates the specification of Drosophila intestinal stem cells. Science. 2010;327:210–213. doi: 10.1126/science.1181958. [DOI] [PMC free article] [PubMed] [Google Scholar]
- McGuire SE, Le PT, Osborn AJ, Matsumoto K, Davis RL. Spatiotemporal rescue of memory dysfunction in Drosophila. Science. 2003;302:1765–1768. doi: 10.1126/science.1089035. [DOI] [PubMed] [Google Scholar]
- McGuire SE, Mao Z, Davis RL. Spatiotemporal gene expression targeting with the TARGET and gene-switch systems in Drosophila. Sci STKE. 2004;2004:pl6. doi: 10.1126/stke.2202004pl6. [DOI] [PubMed] [Google Scholar]
- Micchelli CA, Perrimon N. Evidence that stem cells reside in the adult Drosophila midgut epithelium. Nature. 2006;439:475–479. doi: 10.1038/nature04371. [DOI] [PubMed] [Google Scholar]
- Morrison SJ, Kimble J. Asymmetric and symmetric stem-cell divisions in development and cancer. Nature. 2006;441:1068–1074. doi: 10.1038/nature04956. [DOI] [PubMed] [Google Scholar]
- Nassour M, Idoux-Gillet Y, Selmi A, Come C, Faraldo ML, Deugnier MA, Savagner P. Slug controls stem/progenitor cell growth dynamics during mammary gland morphogenesis. PLoS ONE. 2012;7:e53498. doi: 10.1371/journal.pone.0053498. [DOI] [PMC free article] [PubMed] [Google Scholar]
- de Navascues J, Perdigoto CN, Bian Y, Schneider MH, Bardin AJ, Martinez-Arias A, Simons BD. Drosophila midgut homeostasis involves neutral competition between symmetrically dividing intestinal stem cells. EMBO J. 2012;31:2473–2485. doi: 10.1038/emboj.2012.106. [DOI] [PMC free article] [PubMed] [Google Scholar]
- Nieto MA. The snail superfamily of zinc-finger transcription factors. Nat Rev Mol Cell Biol. 2002;3:155–166. doi: 10.1038/nrm757. [DOI] [PubMed] [Google Scholar]
- O'Brien LE, Soliman SS, Li X, Bilder D. Altered modes of stem cell division drive adaptive intestinal growth. Cell. 2011;147:603–614. doi: 10.1016/j.cell.2011.08.048. [DOI] [PMC free article] [PubMed] [Google Scholar]
- Ohlstein B, Spradling A. The adult Drosophila posterior midgut is maintained by pluripotent stem cells. Nature. 2006;439:470–474. doi: 10.1038/nature04333. [DOI] [PubMed] [Google Scholar]
- Ohlstein B, Spradling A. Multipotent Drosophila intestinal stem cells specify daughter cell fates by differential notch signaling. Science. 2007;315:988–992. doi: 10.1126/science.1136606. [DOI] [PubMed] [Google Scholar]
- Osterwalder T, Yoon KS, White BH, Keshishian H. A conditional tissue-specific transgene expression system using inducible GAL4. Proc Natl Acad Sci U S A. 2001;98:12596–12601. doi: 10.1073/pnas.221303298. [DOI] [PMC free article] [PubMed] [Google Scholar]
- Perdigoto CN, Schweisguth F, Bardin AJ. Distinct levels of Notch activity for commitment and terminal differentiation of stem cells in the adult fly intestine. Development. 2011;138:4585–4595. doi: 10.1242/dev.065292. [DOI] [PubMed] [Google Scholar]
- Piccin D, Morshead CM. Wnt signaling regulates symmetry of division of neural stem cells in the adult brain and in response to injury. Stem Cells. 2011;29:528–538. doi: 10.1002/stem.589. [DOI] [PubMed] [Google Scholar]
- Resende LP, Jones DL. Local signaling within stem cell niches: insights from Drosophila. Curr Opin Cell Biol. 2012;24:225–231. doi: 10.1016/j.ceb.2012.01.004. [DOI] [PMC free article] [PubMed] [Google Scholar]
- Roman G, Endo K, Zong L, Davis RL. P[Switch], a system for spatial and temporal control of gene expression in Drosophila melanogaster. Proc Natl Acad Sci U S A. 2001;98:12602–12607. doi: 10.1073/pnas.221303998. [DOI] [PMC free article] [PubMed] [Google Scholar]
- Shalaby NA, Parks AL, Morreale EJ, Osswalt MC, Pfau KM, Pierce EL, Muskavitch MA. A screen for modifiers of notch signaling uncovers Amun, a protein with a critical role in sensory organ development. Genetics. 2009;182:1061–1076. doi: 10.1534/genetics.108.099986. [DOI] [PMC free article] [PubMed] [Google Scholar]
- Simons BD, Clevers H. Strategies for homeostatic stem cell self-renewal in adult tissues. Cell. 2011;145:851–862. doi: 10.1016/j.cell.2011.05.033. [DOI] [PubMed] [Google Scholar]
- Soleimani VD, Yin H, Jahani-Asl A, Ming H, Kockx CE, van Ijcken WF, Grosveld F, Rudnicki MA. Snail regulates MyoD binding-site occupancy to direct enhancer switching and differentiation-specific transcription in myogenesis. Mol Cell. 2012;47:457–468. doi: 10.1016/j.molcel.2012.05.046. [DOI] [PMC free article] [PubMed] [Google Scholar]
- Southall TD, Brand AH. Neural stem cell transcriptional networks highlight genes essential for nervous system development. EMBO J. 2009;28:3799–3807. doi: 10.1038/emboj.2009.309. [DOI] [PMC free article] [PubMed] [Google Scholar]
- Spradling AC, Nystul T, Lighthouse D, Morris L, Fox D, Cox R, Tootle T, Frederick R, Skora A. Stem cells and their niches: integrated units that maintain Drosophila tissues. Cold Spring Harb Symp Quant Biol. 2008;73:49–57. doi: 10.1101/sqb.2008.73.023. [DOI] [PubMed] [Google Scholar]
- van Steensel B, Henikoff S. Identification of in vivo DNA targets of chromatin proteins using tethered dam methyltransferase. Nat Biotechnol. 2000;18:424–428. doi: 10.1038/74487. [DOI] [PubMed] [Google Scholar]
- Takashima S, Gold D, Hartenstein V. Stem cells and lineages of the intestine: a developmental and evolutionary perspective. Dev Genes Evol. 2013;223:85–102. doi: 10.1007/s00427-012-0422-8. [DOI] [PMC free article] [PubMed] [Google Scholar]
- Toledano H, D'Alterio C, Loza-Coll M, Jones DL. Dual fluorescence detection of protein and RNA in Drosophila tissues. Nat Protoc. 2012;7:1808–1817. doi: 10.1038/nprot.2012.105. [DOI] [PMC free article] [PubMed] [Google Scholar]
- Voog J, D'Alterio C, Jones DL. Multipotent somatic stem cells contribute to the stem cell niche in the Drosophila testis. Nature. 2008;454:1132–1136. doi: 10.1038/nature07173. [DOI] [PMC free article] [PubMed] [Google Scholar]
- Voog J, Sandall SL, Hime GR, Resende LP, Loza-Coll M, Aslanian A, Yates JR, 3rd, Hunter T, Fuller MT, Jones DL. Escargot restricts niche cell to stem cell conversion in the Drosophila testis. Cell Rep. 2014;7:722–734. doi: 10.1016/j.celrep.2014.04.025. [DOI] [PMC free article] [PubMed] [Google Scholar]
- Wang L, Jones DLCPCN. The effects of aging on stem cell behavior in Drosophila. Exp Gerontol. 2011;46:340–344. doi: 10.1016/j.exger.2010.10.005. [DOI] [PMC free article] [PubMed] [Google Scholar]
- Wang L, Zeng X, Ryoo HD, Jasper H. Integration of UPRER and oxidative stress signaling in the control of intestinal stem cell proliferation. PLoS Genet. 2014;10:e1004568. doi: 10.1371/journal.pgen.1004568. [DOI] [PMC free article] [PubMed] [Google Scholar]
- Whiteley M, Noguchi PD, Sensabaugh SM, Odenwald WF, Kassis JA. The Drosophila gene escargot encodes a zinc finger motif found in snail-related genes. Mech Dev. 1992;36:117–127. doi: 10.1016/0925-4773(92)90063-p. [DOI] [PubMed] [Google Scholar]
- Wong MD, Jin Z, Xie T. Molecular mechanisms of germline stem cell regulation. Annu Rev Genet. 2005;39:173–195. doi: 10.1146/annurev.genet.39.073003.105855. [DOI] [PubMed] [Google Scholar]
- Wu PS, Egger B, Brand AH. Asymmetric stem cell division: lessons from Drosophila. Semin Cell Dev Biol. 2008;19:283–293. doi: 10.1016/j.semcdb.2008.01.007. [DOI] [PubMed] [Google Scholar]
- Yamashita YM, Jones DL, Fuller MT. Orientation of asymmetric stem cell division by the APC tumor suppressor and centrosome. Science. 2003;301:1547–1550. doi: 10.1126/science.1087795. [DOI] [PubMed] [Google Scholar]
- Zeng X, Chauhan C, Hou SX. Characterization of midgut stem cell- and enteroblast-specific Gal4 lines in drosophila. Genesis. 2010;48:607–611. doi: 10.1002/dvg.20661. [DOI] [PMC free article] [PubMed] [Google Scholar]
Associated Data
This section collects any data citations, data availability statements, or supplementary materials included in this article.
Supplementary Materials
Supplementary Figures
Supplementary Information
Supplementary Table S2
Review Process File