

Abstract
Purpose:
To characterize the effects of deformable image registration of serial computed tomography (CT) scans on the radiation dose calculated from a treatment planning scan.
Methods:
Eighteen patients who received curative doses (≥60 Gy, 2 Gy/fraction) of photon radiation therapy for lung cancer treatment were retrospectively identified. For each patient, a diagnostic-quality pretherapy (4–75 days) CT scan and a treatment planning scan with an associated dose map were collected. To establish correspondence between scan pairs, a researcher manually identified anatomically corresponding landmark point pairs between the two scans. Pretherapy scans then were coregistered with planning scans (and associated dose maps) using the demons deformable registration algorithm and two variants of the Fraunhofer MEVIS algorithm (“Fast” and “EMPIRE10”). Landmark points in each pretherapy scan were automatically mapped to the planning scan using the displacement vector field output from each of the three algorithms. The Euclidean distance between manually and automatically mapped landmark points (dE) and the absolute difference in planned dose (|ΔD|) were calculated. Using regression modeling, |ΔD| was modeled as a function of dE, dose (D), dose standard deviation (SDdose) in an eight-pixel neighborhood, and the registration algorithm used.
Results:
Over 1400 landmark point pairs were identified, with 58–93 (median: 84) points identified per patient. Average |ΔD| across patients was 3.5 Gy (range: 0.9–10.6 Gy). Registration accuracy was highest using the Fraunhofer MEVIS EMPIRE10 algorithm, with an average dE across patients of 5.2 mm (compared with >7 mm for the other two algorithms). Consequently, average |ΔD| was also lowest using the Fraunhofer MEVIS EMPIRE10 algorithm. |ΔD| increased significantly as a function of dE (0.42 Gy/mm), D (0.05 Gy/Gy), SDdose (1.4 Gy/Gy), and the algorithm used (≤1 Gy).
Conclusions:
An average error of <4 Gy in radiation dose was introduced when points were mapped between CT scan pairs using deformable registration, with the majority of points yielding dose-mapping error <2 Gy (approximately 3% of the total prescribed dose). Registration accuracy was highest using the Fraunhofer MEVIS EMPIRE10 algorithm, resulting in the smallest errors in mapped dose. Dose differences following registration increased significantly with increasing spatial registration errors, dose, and dose gradient (i.e., SDdose). This model provides a measurement of the uncertainty in the radiation dose when points are mapped between serial CT scans through deformable registration.
Keywords: deformable registration, lung, CT, dose difference
1. INTRODUCTION
For patients who receive radiation therapy (RT) treatment for lung cancer, radiation-induced toxicities including radiation pneumonitis (RP) and, later, radiation fibrosis may develop when radiation-sensitive normal lung tissue is damaged. Approximately 50%–100% of patients who receive lung radiation therapy will experience radiologically evident normal tissue inflammation, with up to 20% diagnosed with symptomatic RP.1,2 RP incidence is highly dependent on the delivered dose and the volume of normal lung tissue irradiated.3 Thus, many studies have investigated metrics for RP prediction that are based on dose-volume histograms generated from a patient’s treatment plan.4,5 Discrepancies in these findings, however, may be due to variability in treatment plan design or variable patient sensitivity to radiation.5 As a result, no factor has been identified as consistently predictive of RP development.
Several studies have adopted a more individualized approach to assess radiation-induced lung tissue damage based on a patient’s post-RT scan. Zhang et al.6 demonstrated the feasibility of registering radiation dose with standardized uptake value (SUV) maps of fluorine-18-fluorodeoxyglucose positron emission tomography (18F-FDG PET)/computed tomography (CT) scans acquired after RT to assess normal tissue damage. Phernambucq et al.7 measured a significant increase in regional CT scan density with increasing radiation dose for scans acquired >3 months following lung RT in 25 patients. To obtain voxel-by-voxel association between planned radiation dose and post-RT scans, both groups used deformable image registration to align radiation dose maps associated with the treatment planning scan with post-RT CT or PET/CT scans.
Deformable image registration has been widely studied for use in lung scan coregistration to accommodate the nonuniform changes introduced by patient respiration. Several multi-institutional studies have demonstrated high accuracy (i.e., <1 mm average error) in lung CT scan coregistration.8,9 Our past experience with the Plastimatch demons deformable registration algorithm10 showed that average registration errors of less than 0.5 mm were present between serial diagnostic CT scans obtained from healthy patients, compared with 4.8-mm average errors using rigid registration.11 Even the best algorithms, however, introduce errors during image registration; a multi-institutional study by Brock9 found that the nine most accurate registration algorithms in the study introduced errors as high as 5 mm when coregistering four-dimensional CT (4D-CT) lung scans. Registration may be further complicated when large differences between CT scans exist due to differences in patient positioning, breathing phase, or disease status, thus resulting in decreased registration accuracy. When deformable registration is used to map dose between scans, registration errors yield errors in the dose associated with the mapped location. Several studies have evaluated the dose-mapping error that results from inaccurate deformation of lung CT scans.12,13 The purpose of these studies was to incorporate respiratory changes during treatment planning; thus, these studies involved a single 4D-CT case as a demonstration of feasibility.
Treatment planning CT scans and dose maps could alternatively be registered with diagnostic CT scans acquired outside of the RT treatment dates, which would allow for correlation between planned dose and radiation-induced changes in lung tissue. The current study evaluated the dose-mapping error when the planning scans of 18 lung cancer patients were coregistered with diagnostic-quality CT scans acquired prior to RT. Scans were acquired during different imaging sessions that used different scanners, imaging parameters, patient setup, and respiratory phase; each of these factors can complicate the registration process. This study characterized how dose-mapping error was affected by local dose, dose gradient, the extent of registration accuracy, and the registration algorithm used. The goal was to determine the individual contributions of multiple factors to the error introduced when deformable registration was used to map planned radiation dose between serial CT scans.
2. METHODS
2.A. Patient database
Twenty patients who underwent curative-intent RT (≥60 Gy) for lung cancer at The University of Chicago Medicine between 2007 and 2011 were identified under IRB approval. These patients were randomly selected from a previously compiled database14 of 25 patients who had pre- and post-RT diagnostic CT scans and treatment planning scans available at our institution. Patients were treated with 6 MV or a mixture of 6 and 18 MV photons while immobilized using custom alpha cradles. Treatment planning was performed using Pinnacle® 7.6, 8.0, or 9.0 (Philips Systems, Andover, MA) under the supervision of a radiation oncologist. All doses were calculated with correction for heterogeneous tissue density. For each patient, a diagnostic-quality CT scan acquired prior to RT and a treatment planning scan with an associated dose map were collected. Diagnostic scans were acquired using Philips Brilliance 16 (n = 2), 16P (n = 10), or 64 (n = 8) scanners and reconstructed using identical high-resolution lung filters and lung convolution kernels. Treatment planning scans were acquired using Philips Brilliance CT Big Bore (n = 19) or ACQSIM CT (n = 1) scanners and reconstructed using identical soft tissue filters and soft tissue convolution kernels. Dose maps were interpolated to match the voxel size in the planning scans using trilinear interpolation in CERR v. 4.0 Beta.15 For all scans, semiautomated lung segmentation was performed by an experienced thoracic CT researcher (AC) using Pinnacle® 9.0 model-based segmentation. Two patients were later excluded from the study due to the inability to automatically identify distinctive landmark points in the patient’s planning scan (see Sec. 2.B). Information on patient demographics, treatment, and image acquisition parameters for the remaining 18 patients is displayed in Table I.
TABLE I.
Patient demographic information, treatment details, and image acquisition parameters.
| Number of patients | 18 |
| Male (n = 8) | |
| Female (n = 10) | |
| Median patient age (range) (yr) | 66 (49–79) |
| Number with smoking history | 17 |
| Lung cancer histology | NSCLC (n = 13) |
| SCLC (n = 5) | |
| Tumor lobe location | Upper (n = 13) |
| Middle (n = 2) | |
| Lower (n = 3) | |
| Treatment regimen | Concurrent chemo-RT (n = 15) |
| Sequential chemo-RT (n = 2) | |
| RT only (n = 1) | |
| Treatment planning strategy | 3D-CRT (n = 17) |
| IMRT (n = 1) | |
| Median radiation dose (range) (Gy) | 66 (60–70) |
| Dose per fraction (Gy) | 2 (n = 17) |
| 2.5 (n = 1) | |
| Median number of fractions (range) | 33 (26–35) |
| Mean PTV volume (range) (cm3) | 555 (90–1234) |
| Median time between scan acquisitionand RT start (range) | Planning scans: 10 day (2–16) |
| Diagnostic scans: 19 day (4–75) | |
| Treatment planning scan parameters | |
| Peak kilovoltage (kVp) | 120 |
| Slice thickness/spacing (mm) | 3 |
| Mean pixel spacing (range) (mm) | 1.08 (0.94–1.28) |
| Dose grid size (mm) | 3 × 3 × 3 (n = 17) |
| 2 × 2 × 2 (n = 1) | |
| Motion management | Gated (n = 13) |
| Free-breathing (n = 5) | |
| Diagnostic scan parameters | |
| Peak kilovoltage (kVp) | 120 (n = 15) |
| 140 (n = 3) | |
| Slice thickness/spacing (mm) | 1 |
| Mean pixel spacing (range) (mm) | 0.67 (0.57–0.83) |
Note: NSCLC, Non-small cell lung cancer; SCLC, Small cell lung cancer; 3D-CRT, Three-dimensional conformal radiation therapy; IMRT, Intensity modulated radiation therapy; PTV, Planning target volume; RT, Radiation therapy.
2.B. Landmark selection and matching
Anatomically corresponding landmark points between scans were manually identified by three researchers (CC, BW, and JJ) to establish the reference correspondence between each patient’s planning and diagnostic scans. To ensure that landmark points were identified across regions that represent a variety of dose levels, 2D 16 × 16-pixel regions of interest (ROIs) were first automatically placed within the lungs of the planning scan and distributed among four dose regions. Landmark points then were identified manually within each ROI in the planning scan and at the corresponding point in the diagnostic scan. The process to identify ROIs in the planning scan is displayed in Fig. 1. First, four “dose masks” were created using the dose map associated with the planning scan to identify regions in the lungs that lay within one of four dose regions (0–10 Gy, 10–30 Gy, 30–50 Gy, or >50 Gy). To focus analysis on normal lung tissue, pixels within the boundaries of the planned target volume (PTV), which had been generated by a radiation oncologist during treatment planning using 5–10 mm margins, were excluded from the dose masks. Next, an automated program (iX v. 1.2.0.0)16 was used to identify 100 high-pixel-value-gradient points in the planning scan. Stratified random sampling was used to ensure that points were uniformly distributed within each of the four dose masks. Two patients were excluded from the study due to either poor scan quality degraded by motion or the small volume of the lungs that received 30–50 Gy, preventing identification of 25 points in this dose region. Each of the 100 automatically identified points formed the center of a 2D 16 × 16-pixel ROI located entirely in one axial section of the planning scan, within which the user manually selected a single landmark point. The corresponding anatomically matched landmark point then was identified manually in the diagnostic scan. Placement of the matched landmark point in the diagnostic scan was not constrained spatially, allowing the user to identify a landmark match at any point within any axial section of the diagnostic scan.
FIG. 1.
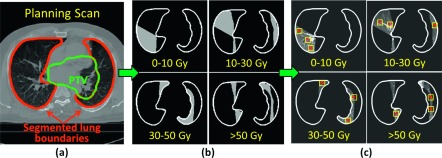
Process for automatic identification of landmark points. (a) Planning CT scan with lung and PTV boundaries overlaid. (b) Dose masks generated using the dose map associated with the planning scan (lung boundaries excluding the PTV shown in white). (c) Points (*) that were automatically placed at high-pixel-value-gradient locations within each of the four dose masks formed the center of 16 × 16-pixel ROIs (yellow squares), within which landmark points were later selected manually.
The graphical user interface for landmark identification and matching (Fig. 2) was developed using ABRAS v. 9.9b, an in-house software package for medical image visualization and manipulation.17 Throughout the study, the user could pan/zoom, scroll through multiple CT sections, and alter the window and level. Due to differences in the breathing phase, resolution, and reconstruction methods between scans, it was not always possible to identify matched landmark points between scans within each of the automatically selected ROIs. All landmark points were reviewed by an experienced thoracic CT researcher (AC) and altered if necessary.
FIG. 2.

Graphical user interface developed for landmark point identification and matching. Landmark points (green crosses) were manually placed within the ROI (yellow square), which had been automatically identified in the planning scan (left panel), and at the corresponding location in the diagnostic scan (right panel).
2.C. Observer training
Concurrence in landmark matching among the researchers identifying landmark points was tested using a training case, which was not used in the final analysis. The Euclidean distance between 100 matched landmark points identified by the experienced researcher (AC) and the three researchers (BW, CC, and JJ) was calculated. Multiple one-sided Wilcoxon signed rank tests were performed to determine if the distance was significantly larger than one-half of a voxel diagonal length (r/2 = 1.7 mm) in the planning scan. To maintain model significance of α = 0.05, significance levels of individual tests were modified according to the Bonferroni method.
2.D. Automated landmark matching and dose calculation
Each patient’s planning and diagnostic CT scans were coregistered using two deformable registration algorithms: Plastimatch demons registration10 and Fraunhofer MEVIS’s CT lung registration.18 Registration proceeded as an iterative process at multiple resolution levels, with scans subsampled at progressively higher resolutions to allow for coarse image matching prior to alignment of small structures. During demons registration, a moving image is allowed to diffuse through a fixed image until matching is achieved, with the force and direction of motion at each iteration calculated using an optical flow equation. The Plastimatch implementation of this algorithm determined the number of iterations based on minimization of the mean-squared intensity difference between scans. The Fraunhofer MEVIS algorithm used a discrete optimization approach to determine an optimal mapping between CT scans. Specifically, a discretized objective function was minimized based on matching image gradients, while penalizing unrealistic volume changes, extreme deformation field curvature, and misaligned lung boundaries. For the Fraunhofer MEVIS algorithm, two sets of registration parameters were analyzed: “Fraunhofer MEVIS Fast” used three resolution levels for fast registration, while “Fraunhofer MEVIS EMPIRE10” was optimized for submission to the EMPIRE10 challenge8 and used a four-level approach with no image subsampling at the finest level. For both Fraunhofer MEVIS methods, affine registration was performed prior to deformable registration. The parameters for registration with Plastimatch demons were selected based on past experience with this algorithm and parameter combination, which indicated highly accurate registration of diagnostic CT scans.11 Registration with Plastimatch was performed during six stages, with image translation and affine registration occurring during the preliminary stages and demons registration at three resolution levels for the final three stages. Using the displacement vector fields (DVFs) output by each of the three registration algorithms, manually placed landmark points in the diagnostic scan (see Sec. 2.B) were automatically mapped to the corresponding planning scan (Fig. 3). For each algorithm, the Euclidean distance (dE) between manually placed and automatically mapped landmark points in the planning scan was measured. Additionally, the difference in the planned dose between the two locations (ΔD = doseautomatic − dosemanual) and the absolute dose difference (|ΔD|) were calculated using the dose map associated with the planning scan (Fig. 3). Regression modeling and analysis of variance (ANOVA) were used to determine whether significant differences in dE existed among the three registration algorithms, accounting for patient-specific random effects. Furthermore, regression modeling was performed to characterize the individual contribution of dE, dose (D), dose standard deviation (SDdose), and registration algorithm on |ΔD| according to the following formula:
| (1) |
where β0 is the intercept, Patienti represents random patient-specific effects for each patient i, Algorithmj represents how each of j = 3 registration methods (Plastimatch demons, Fraunhofer MEVIS Fast, or Fraunhofer MEVIS EMPIRE10) contributed to |ΔD|, and β1, β2, and β3 are the fitted slopes for dE, D, and SDdose, respectively. ϵijk is the residual error associated with the model. Values of D were calculated at each automatically identified landmark point in the planning scan dose map, and SDdose was calculated in a 3 × 3 region centered at each of these points.
FIG. 3.
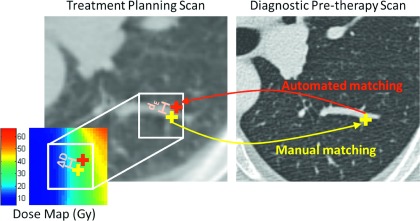
Depiction of the method used to calculate the Euclidean distance (dE) between manually and automatically placed landmark points and the resulting dose-mapping error (ΔD).
3. RESULTS
Comparable landmark matching accuracy was achieved among the multiple researchers using the training case (Table II). The distance between anatomically matched landmark points identified by different researchers in the diagnostic scans was not significantly larger than one-half of the size of a voxel in the planning scan.
TABLE II.
Euclidean distance between landmark point matches identified by the researchers compared with the experienced thoracic CT researcher.
| Researcher 1 | Researcher 2 | Researcher 3 | |
|---|---|---|---|
| Median (IQR) | 1.2 mm (0.7, 1.4) | 1 mm (0.7, 1.4) | 1 mm (0.7, 1.4) |
| Points with distance ≤r/2 (%) | 82% | 78% | 75% |
For each of the 18 patients, between 58 and 93 landmark point pairs (median: 84) were identified for a total of 1472 point pairs, 16% of which were modified by the experienced CT researcher. For each patient, the mean values of dE, ΔD, and |ΔD| were calculated for each registration algorithm. Table III displays the average of the 18 mean values of dE, ΔD, and |ΔD| for each algorithm. Registration accuracy, as reflected by dE, was similar for the Plastimatch demons and Fraunhofer MEVIS Fast algorithms but was greatly improved using Fraunhofer MEVIS EMPIRE10 (Fig. 4). For 15 of the 18 patients, Fraunhofer MEVIS EMPIRE10 achieved the lowest mean dE. The fitted coefficients output using regression modeling showed that, using Fraunhofer MEVIS EMPIRE10, dE decreased significantly (p < 0.05) by 2 mm compared with the Plastimatch algorithm and by 2.4 mm compared with the Fraunhofer MEVIS Fast algorithm. This 0.4 mm difference in dE between Fraunhofer MEVIS Fast and Plastimatch was also significant.
TABLE III.
Average values of dE, ΔD, and |ΔD| across patients for each of the three registration methods.
| Average dE (mm) (range) | Average ΔD (Gy) (range) | Average |ΔD| (Gy) (range) | |
|---|---|---|---|
| Plastimatch | 7.4 (2.1–19.0) | −0.8 (−7.5–3.0) | 3.5 (1.1–8.5) |
| MEVIS Fast | 7.6 (2.3–15.9) | −1.4 (−6.9–1.7) | 4.1 (1.2–10.6) |
| MEVIS EMPIRE10 | 5.2 (1.9–15.0) | −0.5 (−3.3–1.3) | 2.8 (0.9–6.4) |
FIG. 4.
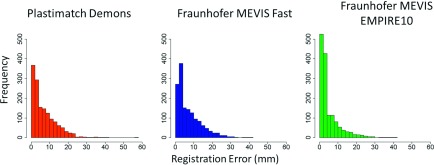
Distribution of registration errors (dE) using each of the three registration algorithms.
Despite CT scan alignment errors during deformable registration, the absolute dose-mapping error remained less than 2 Gy for the majority of points using each of the three algorithms (Fig. 5). Regression analysis and ANOVA indicated that dE, D, SDdose, and the registration algorithm significantly affected |ΔD| (Table IV). The model also indicated that, when dE, D, and SDdose were fixed, |ΔD| was increased by 0.12 Gy using Fraunhofer MEVIS EMPIRE10 and by 0.45 Gy using Fraunhofer MEVIS Fast compared with Plastimatch.
FIG. 5.
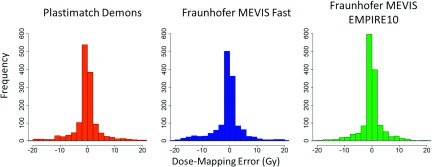
Distribution (2 Gy/bin) of dose-mapping errors (ΔD) calculated using each of the three registration algorithms. Outliers, which comprised <3% of the data, are not displayed for visualization purposes.
TABLE IV.
Model coefficients for Eq. (1) fitted using mixed effects regression modeling.
| Estimate (Gy) | Std. error (Gy) | F-statistic | p | |
|---|---|---|---|---|
| β0: Fitted model intercept (Algorithm0 = Plastimatch, dE = 0, D = 0, SDdose = 0) | −2.1 | 0.27 | — | — |
| 1: | ||||
| Change in |ΔD| using Fraunhofer MEVIS Fast | 0.45 | 0.19 | 28 | <0.001 |
| 2: | ||||
| Change in |ΔD| using Fraunhofer MEVIS EMPIRE10 | 0.12 | 0.19 | ||
| β1: | ||||
| Change in |ΔD| per mm increase in dE | 0.42 | 0.01 | 740 | <0.001 |
| β2: | ||||
| Change in |ΔD| per 1 Gy increase in D | 0.05 | 0.004 | 318 | <0.001 |
| β3: | ||||
| Change in |ΔD| per 1 Gy increase in SDdose | 1.4 | 0.11 | 199 | <0.001 |
4. DISCUSSION
Despite registration error introduced using deformable registration, the subsequent effect of registration error on the dose-mapping error was small (≤4 Gy on average). The average registration error across patients was 7.4 mm using the Plastimatch demons registration algorithm and 7.6 and 5.2 mm using the Fraunhofer MEVIS Fast and EMPIRE10 algorithms, respectively (Table III). In a previous study in which healthy patient diagnostic CT scans were coregistered using Plastimatch demons, average registration error was only 0.39 mm.11 The comparatively large registration errors measured in this study are likely due to differences in scan resolution, patient positioning, and respiratory phase between scans of a pair. Diagnostic scans were acquired during end-inspiration breath hold, while planning scans were acquired during free-breathing or end-exhalation. Scans were acquired using different scanners and reconstructed with different kernels. Additionally, the patient table used for the treatment planning scan was flat, while the diagnostic scanner table was curved, resulting in discrepancies in patient positioning. For this more complicated registration task, it is possible that use of a different set of registration parameters may decrease registration errors. Similar registration errors of 3–8 mm were measured in a study by Palma et al.19 when diagnostic scans acquired 3 months following RT were coregistered with planning CT scans using B-splines deformable registration.
The average dose error across patients due to errors in registration was 3.5 Gy using Plastimatch demons, 4.1 Gy using Fraunhofer MEVIS Fast, and 2.8 Gy using Fraunhofer MEVIS EMPIRE10 (Table III), which was roughly 4%–7% of the total prescribed dose. This average dose error is comparable to the 4% margin of error to the treatment site that is expected during treatment planning.20 For the majority of points, dose-mapping error was below 2 Gy (approximately 3% of the prescribed dose). Linear regression indicated that a 1 mm increase in registration error would only result in a 0.42 Gy increase in dose-mapping error, on average. The small effect of registration error on dose-mapping error may be attributed to plan geometry. RT plans were generally designed so that 3–6 overlapping photon beams delivered a uniformly high dose to the tumor site and a uniformly low dose to the surrounding normal tissue, with a sharp dose gradient in between. Thus, large dose differences resulting from registration error are mainly to be expected in the relatively small volume of the lungs where a large dose gradient exists. Our findings are consistent with a study by Saleh-Sayah et al.,13 who observed that, in low-dose-gradient regions, points displaced by up to 10 mm would result in an average dose-mapping error of <3.3 Gy for a single patient IMRT plan. In high-dose-gradient regions, however, the same average dose error would result from displacements as small as 1 mm. We observed that dose-mapping error was significantly affected by dose standard deviation (and thus, local dose gradient), a relationship also noted in other studies.12,21 To our knowledge, our study is the first to measure dose-mapping errors in thoracic CT scans across multiple patients in a clinical database. Furthermore, by mapping dose between diagnostic and planning scans rather than between different phases of 4DCT scans or between fractions of RT treatment, our study allows for association of planned RT dose with radiation-induced toxicities that may develop outside of the dates of treatment delivery.
Regression modeling indicated that, when registration error, local dose gradient, and local dose were fixed, the Fraunhofer MEVIS Fast and EMPIRE10 algorithms increased |ΔD| by 0.45 and 0.12 Gy, respectively, relative to Plastimatch (Table IV). These results may appear to contradict the results in Table III, which show that dose-mapping error was smallest for Fraunhofer MEVIS EMPIRE10. Regression modeling indicated, however, that the improved dose accuracy observed using Fraunhofer MEVIS EMPIRE10 was due largely to improved registration accuracy. In other words, for points where dE was the same between the Plastimatch and Fraunhofer MEVIS algorithms, ΔD was, on average, reduced using Plastimatch. DVFs for the Fraunhofer MEVIS algorithms demonstrated more pronounced curvature of the vector field (Fig. 6). A more curved DVF such as the one generated using Fraunhofer MEVIS is more likely to pass across multiple isodose levels, particularly when multiple impinging photon beams cause spatially linear dose gradients in 3D planning. As a result, the likelihood that points would be mapped from one dose region to another may be slightly increased using Fraunhofer MEVIS. While the superior registration accuracy achieved using the Fraunhofer MEVIS EMPIRE10 algorithm ultimately led to lower dose-mapping error on average (Table III), our findings indicate that dose alignment accuracy depends not only on the registration accuracy achieved by a deformable registration algorithm but also on the algorithm design itself. For instance, the curvature regularization term in the objective function used by the Fraunhofer MEVIS algorithm could be increased to allow for decreased DVF curvature. For the dose-mapping task, different considerations may be necessary to create a registration algorithm that is optimized to minimize dose-mapping errors.
FIG. 6.

(a) DVF generated using Fraunhofer MEVIS EMPIRE10 overlaid on a diagnostic scan section. The DVF for the Fast algorithm displayed similar curvature. (b) DVF generated using Plastimatch overlaid on the same diagnostic scan section. DVFs were visualized using VV (v. 1.3) (Ref. 22).
Several potential weaknesses may impact the results of this study. First, manual identification of landmark point pairs may have resulted in incorrect identification of point pairs. Furthermore, because the landmark matching task was divided among three researchers, differences in the accuracy of landmark point placement may exist among researchers. These errors were reduced in several ways. First, observer training (Sec. 2.D) ensured that all researchers were familiar with the interface and that significant differences in landmark matching accuracy did not exist among the researchers for a training case. Second, all manually placed landmark points were reviewed by an experienced researcher and edited when necessary.
Due to the retrospective nature of database collection, variability existed among patients and treatment plans. PTV volume ranged from 90 to 1234 cm3, which would impact treatment plan design to ensure appropriate tumor coverage. A single patient received intensity modulated RT (IMRT), while the remaining 17 patients were treated with three-dimensional conformal RT (3D-CRT). Though obvious differences in registration accuracy and dose-mapping error were not apparent for this single IMRT patient (average dE = 5.1 mm and average |ΔD| = 2.2 Gy), future studies involving a larger patient cohort should investigate the validity of our developed model for a variety of treatment planning strategies (e.g., IMRT, 3D-CRT, stereotactic body RT) and plan geometries, as different planning techniques are likely to affect the volume and location of the high-dose-gradient regions. The potential for application of our results to other tumor sites also remains to be investigated, as both organ motion and treatment plan design would vary for other sites.
In this study, dose-mapping error was modeled as a linear function of dE, D, and SDdose. During model development, we also considered quadratic rather than linear terms for the fixed effects and the inclusion of an interaction term between the registration algorithm and registration error (dE). For all alternative models, the model fit was inferior to the original model [Eq. (1)], indicated by increases in the Akaike information criteria.
Dose-mapping error was measured throughout the entirety of the normal lung tissue and at multiple levels of radiation dose, allowing for future studies to be performed that focus on a variety of lung regions. For example, future studies could assess the uncertainty in dose to regions in close proximity to organs at risk. Alternatively, studies could correlate local radiation dose with regions displaying radiation-induced injury. Rather than calculate registration errors manually as was done in this study, several methods have been proposed to estimate registration error based on DVF analysis.23–25 This concept was applied in a study by Salguero et al.,12 who estimated dose-mapping error in a single patient 4D-CT planning scan based on both regional dose and the dispersion of the DVF during multiple deformations. To our knowledge, however, no study has been performed to measure the error that results when diagnostic scans are registered to planning scans, where dissimilarities between scans complicate the deformation task. Instead, the focus of past research has been to assess uncertainty in dose delivered during RT treatment either due to interfraction changes in patient positioning or breathing motion. The purpose of our study, however, was to facilitate association between radiation treatment and RT-induced changes that may only become apparent following treatment delivery (e.g., radiation pneumonitis or radiation fibrosis). Coregistration of diagnostic and planning scans would allow for direct spatial association between radiation dose and RT-induced toxicities, thus informing future patient care.
Our findings demonstrate that the accuracy of dose mapping through deformable registration is highly dependent on the local dose gradient and, to a lesser extent, the local dose. Thus, the dose alignment accuracy may be improved if, during the registration process, increased weight is given to the accurate registration of high-dose-gradient regions. Improvements in dose alignment accuracy may be especially important when performing coregistration of planning scans and diagnostic scans acquired after RT. Work in our lab demonstrated that, when diagnostic pre- and post-RT CT scans were coregistered, the presence of fibrotic changes in post-RT scans significantly decreased the registration accuracy by 2.2 mm using Plastimatch and by 1.2 mm using Fraunhover MEVIS Fast. In future studies when planning CT scans are coregistered with post-RT diagnostic scans, the effect of the presence of fibrotic changes on RT-induced damage would need to be considered. One way to improve dose alignment accuracy would be to employ landmark-guided registration,26,27 with the majority of landmark points located in high-dose-gradient regions. The registration algorithm itself could instead be altered to more heavily weight high-dose-gradient regions when computing the similarity index between scans; unlike landmark-guided registration, this method has the advantage of being fully automated and thus more efficient for clinical implementation. Alternatively, post-RT diagnostic scans and planning CT scans both could be aligned with the pre-RT scan through deformable registration, allowing for association between post-RT diagnostic scans and planning scans without requiring direct coregistration of these two scans. This method also would have the advantage of allowing for treatment-related changes between pre- and post-RT scans to be assessed and associated with RT dose.
5. CONCLUSIONS
We measured the dose alignment accuracy when deformable registration was used to map planned dose between planning scans and diagnostic scans acquired before RT. Despite large inaccuracies in CT scan coregistration, dose-mapping error remained less than 2 Gy for the majority of points using each of three registration algorithms. Dose-mapping error increased significantly as a function of registration error, local dose, local dose gradient, and the registration algorithm used. This methodology could be used in future research to characterize the dose-mapping error that is introduced when deformable registration is used to associate planned radiation dose with abnormalities in CT scans that develop following treatment with RT, potentially informing future patient care.
ACKNOWLEDGMENTS
This work was supported, in part, by a 2013 AAPM Minority Undergraduate Summer Experience Fellowship, NSF REU Award No. 1062909 and NIH Grant Nos. S10 RR021039, P30 CA14599, and T32 EB002103. SGA receives royalties and licensing fees related to computer-aided diagnosis technology through The University of Chicago and research funding from Riverain Technologies through The University of Chicago. HAA receives royalties through The University of Chicago for computer-aided diagnosis of breast cancer. The authors would like to thank Jan Rühaak (Fraunhofer MEVIS) for development and thoughtful discussion of the Fraunhofer MEVIS registration algorithm, Adam Starkey for his help in developing the user interface, and The Human Imaging Research Office (HIRO) for providing anonymized, compliant images. The HIRO is supported in part by pilot research funding provided by the Virginia and D.K. Ludwig Fund for Cancer Research through the Imaging Research Institute in the Biological Sciences Division of The University of Chicago.
This work was presented, in part, at the 2014 AAPM Annual Meeting in Austin, TX.
REFERENCES
- 1.Ma J., Zhang J., Zhou S., Hubbs J. L., Foltz R. J., Hollis D. R., Light K. L., Wong T. Z., Kelsey C. R., and Marks L. B., “Regional lung density changes after radiation therapy for tumors in and around thorax,” Int. J. Radiat. Oncol., Biol., Phys. 76, 116–122 (2010). 10.1016/j.ijrobp.2009.01.025 [DOI] [PubMed] [Google Scholar]
- 2.Rovirosa A. and Valduvieco I., “Radiation Pneumonitis,” Clin. Pulm. Med. 17, 218–222 (2010). 10.1097/CPM.0b013e3181efac67 [DOI] [Google Scholar]
- 3.Marks L. B., Bentzen S. M., Deasy J. O., Kong F. M., Bradley J. D., Vogelius I. S., El Naga I., Hubbs J. L., Lebesque J. V., Timmerman R. D., Martel M. K., and Jackson A., “Radiation dose-volume effects in the lung,” Int. J. Radiat. Oncol., Biol., Phys. 76, S70–S76 (2010). 10.1016/j.ijrobp.2009.06.091 [DOI] [PMC free article] [PubMed] [Google Scholar]
- 4.Yorke E. D., Jackson A., Rosenzweig K. E., Merrick S. A., Gabrys D., Venkatraman E. S., Burman C. M., Liebel S. A., and Ling C. C., “Dose-volume factors contributing to the incidence of radiation pneumonitis in non-small-cell lung cancer patients treated with three-dimensional conformal radiation therapy,” Int. J. Radiat. Oncol., Biol., Phys. 54, 329–339 (2002). 10.1016/S0360-3016(02)02929-2 [DOI] [PubMed] [Google Scholar]
- 5.Rodrigues G., Lock M., D’Souza D., Yu E., and Van Dyk J., “Prediction of radiation pneumonitis by dose-volume histogram parameters in lung cancer—A systematic review,” Radiother. Oncol. 71, 127–138 (2004). 10.1016/j.radonc.2004.02.015 [DOI] [PubMed] [Google Scholar]
- 6.Zhang G. G., Huang T.-C., Forster K. M., Lin K.-P., Stevens C., Harris E., and Guerrero T., “Dose mapping: Validation in 4D dosimitery with measurements and application in radiotherapy follow-up evaluation,” Comput. Methods Programs Biomed. 90, 25–37 (2008). 10.1016/j.cmpb.2007.11.015 [DOI] [PubMed] [Google Scholar]
- 7.Phernambucq E. C. J., Palma D. A., Vincent A., Smit E. F., and Senan S., “Time and dose-related changes in radiological lung density after concurrent chemoradiotherapy for lung cancer,” Lung Cancer 74, 451–456 (2011). 10.1016/j.lungcan.2011.05.010 [DOI] [PubMed] [Google Scholar]
- 8.Murphy K., van Ginneken B., Reinhardt J. M., Kabus S., Ding K., Deng X., Cao K., Du K., Christensen G. E., Garcia V., Vercauteren T., Ayache N., Commowick O., Malandain G., Glocker B., Paragios N., Navab N., Gorbunova V., Sporring J., de Bruijne M., Han X., Heinrich M. P., Schnabel J. A., Jenkinson M., Lorenz C., Modat M., McClelland J. R., Ourselin S., Muenzing S. E., Viergever M. A., De Nigris D., Collins D. L., Arbel T., Peroni M., Li R., Sharp G. C., Schmidt-Richberg A., Ehrhardt J., Werner R., Smeets D., Loeckx D., Song G., Tustison N., Avants B., Gee J. C., Staring M., Klein S., Stoel B. C., Urschler M., Werlberger M., Vandemeulebroucke J., Rit S., Sarrut D., and Pluim J. P., “Evaluation of registration methods on thoracic CT: The EMPIRE10 challenge,” IEEE Trans. Med. Imaging 30, 1901–1920 (2011). 10.1109/TMI.2011.2158349 [DOI] [PubMed] [Google Scholar]
- 9.Brock K., “Results of a multi-institution deformable registration accuracy study (MIDRAS),” Int. J. Radiat. Oncol., Biol., Phys. 76, 583–596 (2010). 10.1016/j.ijrobp.2009.06.031 [DOI] [PubMed] [Google Scholar]
- 10.Sharp G., Kandasamy N., Singh H., and Folkert M., “GPU-based streaming architectures for fast cone-beam CT image reconstruction and demons deformable registration,” Phys. Med. Biol. 52, 5771–5783 (2007). 10.1088/0031-9155/52/19/003 [DOI] [PubMed] [Google Scholar]
- 11.Cunliffe A. R., Al-Hallaq H. A., Labby Z. E., Pelizzari C. A., Straus C., Sensakovic W. F., Ludwig M., and Armato S. G., “Lung texture in serial thoracic CT scans: Assessment of change introduced by image registration,” Med. Phys. 39, 4679–4690 (2012). 10.1118/1.4730505 [DOI] [PMC free article] [PubMed] [Google Scholar]
- 12.Salguero F. J., Saleh-Sayah N. K., Yan C., and Siebers J. V., “Estimation of three-dimensional intrinsic dosimetric uncertainties resulting from using deformable image registration for dose mapping,” Med. Phys. 38, 343–353 (2011). 10.1118/1.3528201 [DOI] [PMC free article] [PubMed] [Google Scholar]
- 13.Saleh-Sayah N. K., Weiss E., Salguero F. J., and Siebers J. V., “A distance to dose difference tool for estimating the required spatial accuracy of a displacement vector field,” Med. Phys. 38, 2318–2323 (2011). 10.1118/1.3572228 [DOI] [PMC free article] [PubMed] [Google Scholar]
- 14.Cunliffe A., Armato S., Straus C., Malik R., and Al-Hallaq H., “A texture analysis approach to assess the severity of acute normal tissue changes in thoracic CT scans following radiation therapy for lung cancer,” J. Thorac. Oncol. 8, S969 (2013). [Google Scholar]
- 15.Deasy J. O., Blanco A. I., and Clark V. H., “CERR: A computational environment for radiotherapy research,” Med. Phys. 30, 979–985 (2003). 10.1118/1.1568978 [DOI] [PubMed] [Google Scholar]
- 16.Murphy K., van Ginneken B., Klein S., Staring M., de Hoop B.J., Viergever M. A., and Pluim J. P. W., “Semi-automatic construction of reference standards for evaluation of image registration,” Med. Img. Anal. 15, 71–84 (2011). 10.1016/j.media.2010.07.005 [DOI] [PubMed] [Google Scholar]
- 17.Starkey A., Sensakovic W., and Armato S., “Abras: A portable application for observer studies and visualization,” Int. J. Comput. Assist. Radiol. Surg. 6, S193 (2011). [Google Scholar]
- 18.Rühaak J., Heldmann S., Kipshagen T., and Fischer B., “Highly accurate fast lung CT registration,” Proc. SPIE 8669, 86690Y-1–86690Y-9 (2013). 10.1117/12.2006035 [DOI] [Google Scholar]
- 19.Palma D. A., Van Sörnsen de Koste J., Verbakel W. F. A. R., and Senan S., “A new approach to quantifying lung damage after stereotactic body radiation therapy,” Acta Oncol. 50, 509–517 (2011). 10.3109/0284186X.2010 [DOI] [PubMed] [Google Scholar]
- 20.Mijnheer B. J., Battermann J. J., and Wambersie A., “What degree of accuracy is required and can be achieved in photon and neutron therapy?,” Radiother. Oncol. 8, 237–252 (1987). 10.1016/S0167-8140(87)80247-5 [DOI] [PubMed] [Google Scholar]
- 21.Janssens G., Orban de Xivry J., Fekkes S., Dekker A., Macq B., Lambin P., and van Elmpt W., “Evaluation of nonrigid registration models for interfraction dose accumulation in radiotherapy,” Med. Phys. 36, 4268–4276 (2009). 10.1118/1.3194750 [DOI] [PubMed] [Google Scholar]
- 22.Seroul P. and Sarrut D., “VV: A viewer for the evaluation of 4D image registration,” MIDAS Journal—Systems and architectures for computer Assisted Interventions (MICCAI 2008 Workshop) (available online: http://hdl.handle.net/10380/1458) (2008). [Google Scholar]
- 23.Hub M. and Karger C. P., “Estimation of the uncertainty of elastic image registration with the demons algorithm,” Phys. Med. Biol. 58, 3023–3036 (2013). 10.1088/0031-9155/58/9/3023 [DOI] [PubMed] [Google Scholar]
- 24.Vaman C., Staub D., Williamson J., and Murphy M. J., “A method to map errors in the deformable registration of 4DCT images,” Med. Phys. 37, 5765–5776 (2010). 10.1118/1.3488983 [DOI] [PMC free article] [PubMed] [Google Scholar]
- 25.Zhong H., Peters T., and Siebers J. V., “FEM-based evaluation of deformable image registration for radiation therapy,” Phys. Med. Biol. 52, 4721–4738 (2007). 10.1088/0031-9155/52/16/001 [DOI] [PubMed] [Google Scholar]
- 26.Johnson H. J. and Christensen G. E., “Consistent landmark and intensity-based image registration,” IEEE Trans. Med. Imaging 21, 450–461 (2002). 10.1109/TMI.2002.1009381 [DOI] [PubMed] [Google Scholar]
- 27.Lu H., Cattin P. C., and Reyes M., “A hybrid multimodal non-rigid registration of MR images based on diffeomorphic demons,” in Proceedings of the International Conference of the IEEE Engineering in Medicine and Biology Society (IEEE, Buenos Aires, Argentina, 2010), pp. 5951–5954. [DOI] [PubMed] [Google Scholar]