Abstract
Compression therapy has long been a standard treatment for hypertrophic scar prevention. However, due to the lack of objective, quantitative assessments, and measurements of scar severity, as well as the lack of a self-operated, controllable, and precise pressure delivery technique, limited concrete evidence exists, demonstrating compression therapy’s efficacy. We have designed and built an automatic pressure delivery system to apply and maintain constant pressure on scar tissue in an animal model. A force sensor positioned on a compression plate reads the imposed force in real-time and sends the information to a feedback system controlling two position actuators. The actuators move accordingly to maintain a preset value of pressure onto the skin. The system was used in an in vivo model of compression therapy on hypertrophic scars. It was shown that the system was capable of delivering a constant pressure of 30 mmHg on scar wounds for a period of two weeks, and that phenotypic changes were seen in the wounds.
I. INTRODUCTION
Applying controlled and precise mechanical pressure on cutaneous tissue is challenging, particularly in studies examining pressure ulcer formation, venous leg ulcer, and scar treatment. Several groups have introduced controlled pressure delivery instrumentation and techniques mostly for research purposes.1–10 Efficiency of a pressure delivery system critically depends on physical structure, size, surface texture, motion, and elastic properties of the target organ.
Different techniques have been introduced to improve scar quality. Both non-surgical and surgical procedures have been considered to control scar formation effectively. Silicon dressing, compression therapy, and radiation therapy are known as the major non-surgical techniques. Compression therapy is one of the most common treatments for hypertrophic scar (HTS) prevention. It is thought that applied pressure creates an ischemic condition with a reduction of blood perfusion within the target tissue. As a result, hypoxia occurs at the tissue level, and this leads to lowering of the rate of collagen production in the injured site, limiting scar formation.2–5,7
Compression therapy is routinely performed using bandages, stockings, or pneumatic compression devices. Either deficient or excessive pressure can cause inefficient results or tissue damage for patients, which is why it is important to be able to deliver consistent and appropriate levels of pressure to injured tissue. Several studies on the width, tension, and number of layers of bandage and also characteristics of pressure garments have been done by sensor placement and measuring the imposed pressure.8–17 Cheng et al. looked at the correlation of clinical response of compression therapy with magnitude of pressure for post-burn hypertrophic scar treatment.8 They used an electro-pneumatic sensor with the working range of 0–50 mmHg to record garment-scar interface pressure. Several recommendations on an effective compression therapy procedure were made. Other groups also utilized different pneumatic pressure sensors to study scar compression therapy.9–12 A commercial Oxford Pressure Monitor based on pneumatic electrodes was used to measure under garment pressure over soft tissue areas of different body locations.9 Performance of different models of pressure garments for various body organs was analyzed. Variability of applied pressure is related to the shape and size of organ, technique of the bandager, and elastic properties of the bandaging material. Barbenel et al. used a pneumatic pressure sensor with a piezo-resistive transducer with a good linearity and negligible hysteresis in the working range of 0–37.5 mmHg.10 Reproducibility of induced pressure by different types of commercial pressure garments used in post-burn scar treatment was also analyzed using a pneumatic sensor.12 Non-pneumatic techniques were also considered for scar compression therapy evaluation. Giele et al. used an invasive technique to measure subdermal cutaneous pressure directly.13,14 For this purpose, they utilized a needle connected to a continuous low flow pressure transducer, which is routinely used to monitor venous blood pressure. By inserting the needle subdermally, the resting subdermal pressure and the pressure post-garment fitting were obtained. Mann et al.15 introduced a pressure sensing tool named Iscan. This device consisted of multiple resistive sensors printed onto a thin plastic film substrate and used to demonstrate a comparison between different garment types. Another form of force sensitive resistor (FlexiForce) was applied for similar applications.16 FlexiForce contains an ink-sensitive layer and a silver layer printed on polyester film. A commercially available pressure monitoring system (Pliance X), including a capacitive transducer with good reliability and linearity, was also used to record scar-garment pressure.17
While hypertrophic scars are still commonly treated with pressure, there remains only scant molecular and cellular evidence of the efficacy of the treatment, and further, the significant question remains of what the true levels of pressure delivered by therapeutic garments are on mobile active patients. In order to provide appropriate therapies and assess their effectiveness, the first step must be to deliver consistent measureable levels of pressure.
The development of a precise automatic pressure delivery system (APDS) for HTS treatment was the focus of this study. A wound model of a human hypertrophic scar was employed to conduct an in vivo means for evaluation of the proposed treatment device. Building a highly compatible pressure delivery system to be applied on an animal scar model was the most challenging part of this study as the pressure delivery system had to withstand considerable forces in non-sterile environmental conditions while the animals were awake over the course of a 2-week treatment. The APDS had to be versatile and resistant to the animals’ behavioral tendencies. Our goal was to be able to monitor and adjust the pressure onto the animal skin continuously, to compensate for scar growth, surrounding skin relaxation, and possibly dramatic animal movement. The device was tested on two animals, and its function was monitored remotely by establishing a wireless communication route between each device and a monitoring station. In the present study, a pressure level of 30 mmHg was chosen for treatment based on the reported values used for hypertrophic scar treatment, clinically.2
II. MATERIALS AND METHODS
A. APDS
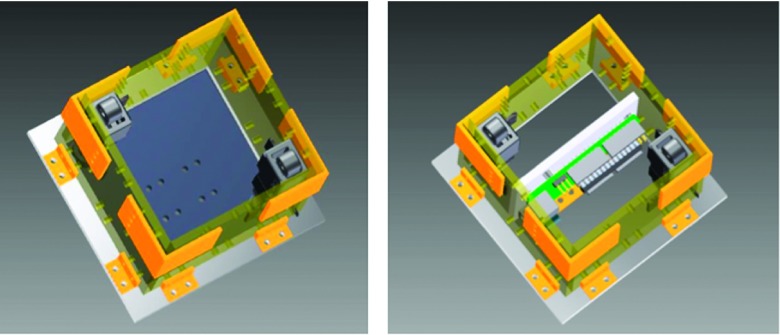
The APDS consisted of a polycarbonate enclosure that contained both controlling hardware and mechanical actuators. The choice of polycarbonate was made due to its low density, machining ease, and strength. The total box encumbrance was 7.6 cm × 7.6 cm × 7.6 cm (L × W × H). Two micro-linear actuators (Firgelli Technologies, Inc., Victoria BC, CA) were fixed to the two opposite corners of the enclosure, and their shaft’s ends were connected to a polycarbonate plate (7.6 cm × 7.6 cm). A design with four actuators and ultimate realization with two are shown in Figures 1 and 2.
FIG. 1.
APDS design.
FIG. 2.

APDS final prototype.
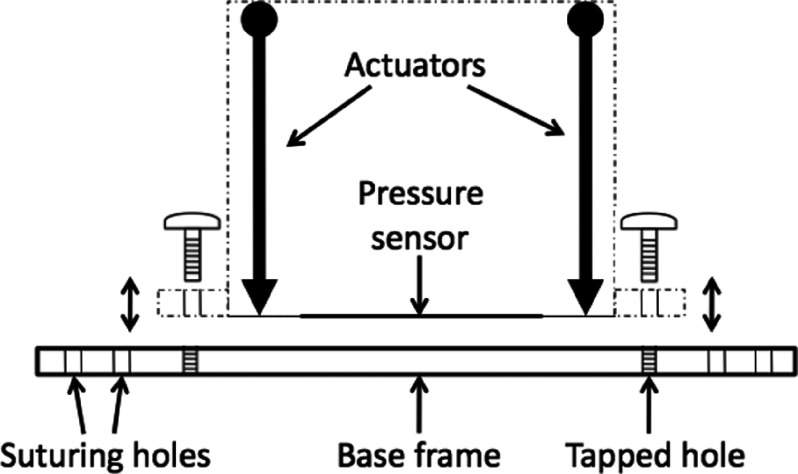
A polycarbonate base frame (12.7 cm × 12.7 cm) was also created to easily connect and remove the box from the animal (Figure 3). This relatively large base frame provides a contact area to stabilize APDS-animal implementation. The base frame is equipped with several holes for both box connection and suturing purposes. The actuators were tasked to push or pull loads along their full stroke length (3 cm). The speed of travel of actuators was determined by their gearing and the opposing load; without any load, a speed of 5 mm/s could be achieved with positional accuracy of 0.2 mm. When powered off, the actuators remained in place unless an applied load exceeded their back-drive force (150 N).
FIG. 3.
Side view of APDS-base frame positioning.
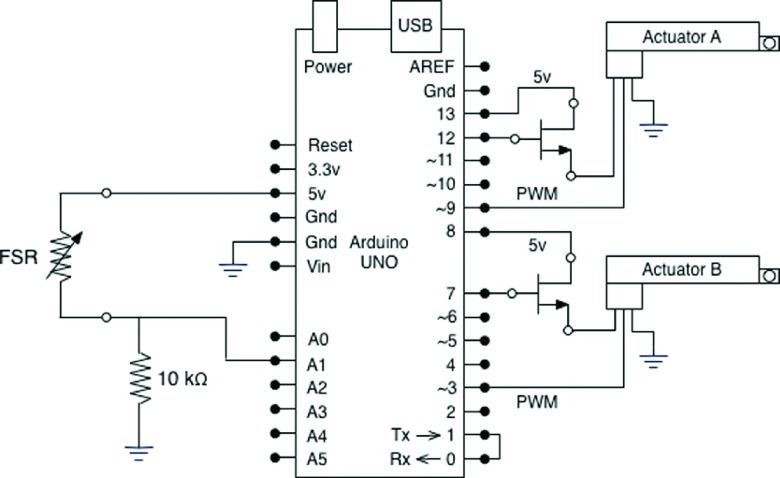
A continuous local pressure measurement was obtained using a force sensitive resistor (FSR) (Interlink Electronics, Camarillo, CA). A FSR shows a decrease in resistance with increase in force applied to the surface of the sensor. An ultra thin sensor (0.45 mm of thickness) with the actuation force as low as 0.1 N and working range up to 100 N was used for each APDS. For a simple force-to-voltage conversion, a voltage divider was also included in the design configuration (10 kΩ resistor shown in Figure 4). The control of actuators, sensor reading, and communication to the monitoring station were conducted with an Arduino controlling board (Arduino UNO, Italy). This microcontroller board is based on ATmega328 and has 14 digital input/output pins, 6 analog inputs each of which provide 10 bits of resolution, a USB connection, and a power jack. Six of the digital pins can be used as 8-bit Pulse-Width Modulation (PWM) outputs. The Arduino board was positioned vertically within the box, and it was fixed to the enclosure through a support (Figure 1). The board utilizes an open source physical computing platform based on a simple development environment. The FSR was connected to the microcontroller board through one of its six analog inputs, and six of the 14 digital outputs were used to control the actuators (two to power actuators, two to control power switches, and two PWM outputs for actuators positioning) (Figure 4).
FIG. 4.
Circuit diagram schematic of APDS.
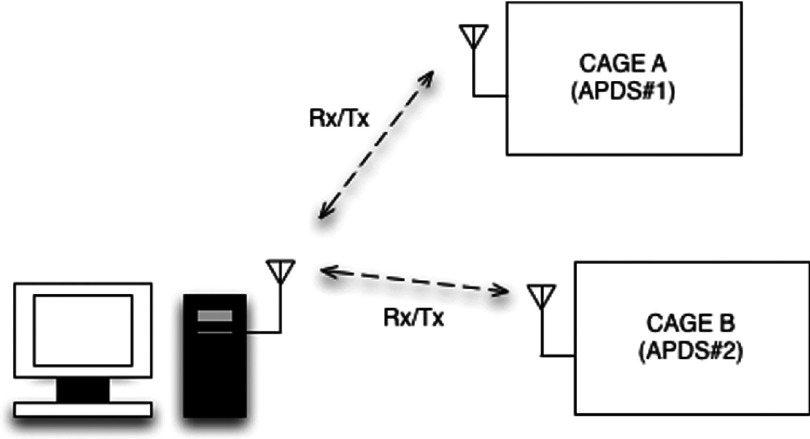
A wireless communication device (XBee 2.4 GHz RF modem, Digi International, Inc., Minnetonka, MN) was ultimately used to relay values to a remote computer interface. The XBee unit was connected to the microcontroller board and secured within the APDS enclosure to avoid animal interference. A single XBee modem was then connected to the monitoring computer, which was paired with all of the APDS’s XBee units (two units here) and remotely logged the pressure data along with the actuators position. An identifying flag was allocated to the data packet of each APDS, which enabled proper clustering of the data stream at the monitoring end point (Figure 5).
FIG. 5.
Wireless communication diagram.
The study required a continuous APDS operation for a period of one week. For this reason, energy consumption by all the APDS elements had to be accounted. The microcontroller board consumes 25 mA h at normal operation. Also, two linear actuators consume between 100 and 170 mA h based on the imposing force. In addition, each APDS utilizes a wireless communication module XBee, which can consume up to 50 mA in TX/RX mode. To reduce power consumption, the microcontroller was put in sleep mode between logging intervals, and this reduced the microcontroller consumption to 0.05 mA h; furthermore, a MOSFET power switch (Wishay, Shelton, CT) was used to turn each actuator off between log ging intervals, and finally high efficiency batteries were used. Different power supplies have been tested on an operating APDS. Ultimately, a battery pack (2x Li-Pol 9V, 2A) has been chosen, which gives a maximum battery lifetime of about 36 h. Even though the battery life was sufficient for more than a day of continuous study, we ultimately made the decision to replace it every day during routine animal checks. The boxes and batteries were protected using a custom fit vest and casting materials.
B. System control
A feedback routine was devised programmatically using the Arduino software (Arduino, Italy), so the pre-set values of pressure could be maintained over time by moving the actuators and the pressure plate. Every two seconds, each record of the FSR output voltage was collected by the microcontroller unit and compared to the reference voltage (30 ± 3 mmHg in this study). Accordingly, a control signal was created by the microcontroller unit and passed through the PWM output pins to control actuators’ position. As the Arduino board was maintained in sleep mode between queries to improve battery lifetime, a command was sent through the digital outputs to control the MOSFET power switches and turn the actuators off. Logged parameters of real-time pressure and actuators’ shaft position were transmitted to the monitoring station through XBee wireless route. A monitoring program in Matlab (MathWorks, Natick, MA) was tasked to record the data stream from each APDS.
C. System calibration
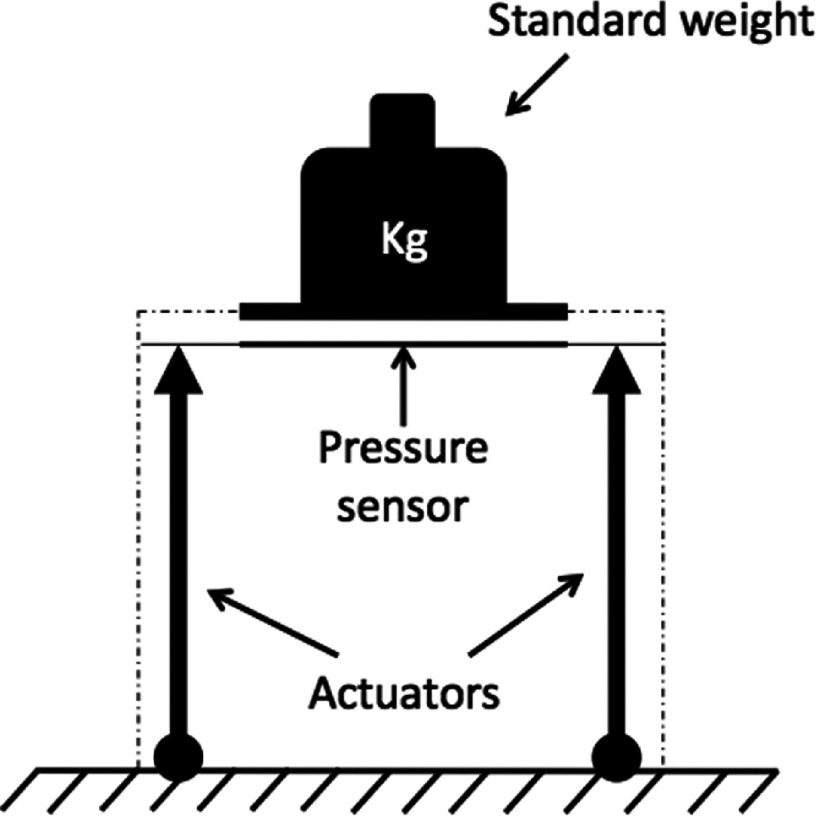
The calibration process of each APDS started by obtaining the FSR characteristic curve experimentally. Dead weights (10 g–1200 g) were used for this purpose. A rigid metal plate of the same size as the FSR sensor (4 cm × 4 cm) was used to distribute the weight onto the FSR. Voltage readings from each FSR sensor were recorded for each weight. Finally, pressure was calculated as Weight/Area and converted into mmHg. A range of pressure between 0 and ∼55 mmHg was ultimately obtained. Figure 6 shows the experimental setup used for this test. Actuators were not functional in this configuration.
FIG. 6.
Experimental setup for force sensitive resistor calibration.
Several tests were conducted to characterize the system, and included active tests where the system response to changes to an applied force was monitored, as well as passive tests where sensor drift and hysteresis were quantified.
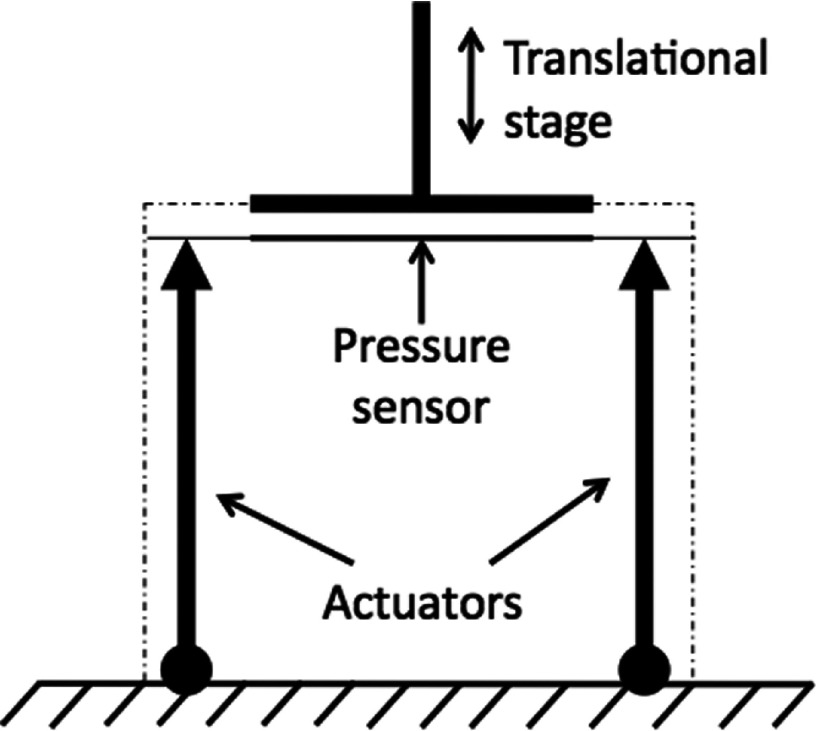
In Figure 7, we show the layout of the active test. An external adjustable source of pressure was created using a translational stage attached to the pressure plate of the APDS. The pressure on the FSR sensor was either decreased or increased by moving the translational stage into random positions. In this layout, the entire APDS was completely functional and was tasked to maintain a constant level of pressure despite changes in loading condition.
FIG. 7.
Experimental setup for APDS performance test.
Two passive tests were conducted, and in both cases, the actuators were inactive, and only the FSR was used. In the first test, sensor drift was measured. Well-known weights were loaded onto the FSR sensor and matching plate as shown in the calibration procedure. Resulting values of pressure were monitored over time for up to 5 min. To monitor hysteresis, the layout of Figure 7 was used, with the only difference that actuators were not active and the translational stage was motorized. The translational stage was programmed to leave a starting position, travel 3 mm, and then return to its starting position (acceleration 0.01 mm/s,2 velocity By doing so, up to 20 mmHg of pressure was applied to the FSR sensor. The test was repeated six times.
D. Animal model
APDS functionality was tested on two animals (Red Duroc pigs). All works were conducted after receiving approval of the Institutional Animal Care and Use Committee (IACUC) of MedStar Health Research Institute. Briefly, two 100 mm × 100 mm full-thickness wounds were created on the flanks of each animal with an electric dermatome (Zimmer, Inc., Warsaw, IN). The setting on the dermatome was adjusted to 0.76 mm depth of excision and was run across the wound area 3 times, yielding a total excisional depth of ∼2.3 mm. A fitted neoprene garment was made to protect wounds and secure dressings. Garment construction is discussed in detail in a previous report.18 After reepithelialization, on the 70th day of wounding, one wound on each animal was treated with APDS compression therapy for two consecutive weeks under the supervision of a clinical team, while the second wound on the opposite flank was treated with a “sham” therapy. Sham therapy was a box that contained the exterior construction and flange, secured in place in the same way the APDS was placed.
III. RESULTS AND DISCUSSION
A. Calibration
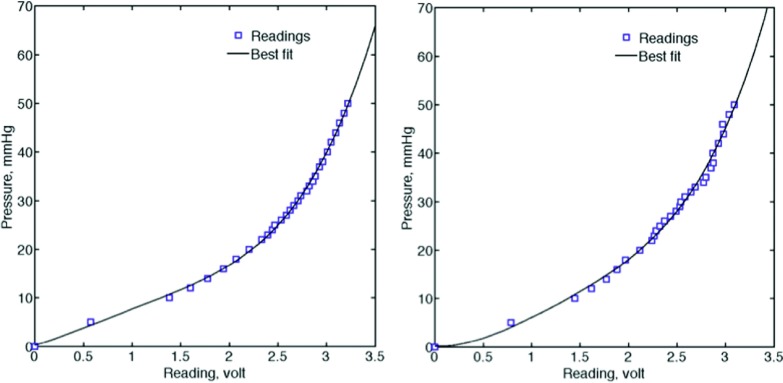
Data obtained from the calibration procedure were fitted to the fourth order polynomial (Matlab, Natick, MA) to find the best characteristic plot for each sensor. Figure 8 shows the voltage readings and its best polynomial fit. Table I shows fit ting (or calibration) parameters, which were ultimately used to convert the voltage readings, v, to the corresponding physical pressure data, p.
FIG. 8.
FSR characteristic plot, left frame: FSR #1 and right frame: FSR #2, symbols show the average voltage reading over 15 min. Curves show the best polynomial fit.
TABLE I.
APDS calibration parameters Ci of fourth-order polynomial; p and v denote pressure and voltage readings, respectively.
| Calibration | |||||
|---|---|---|---|---|---|
| parameters | C1 | C2 | C3 | C4 | C5 |
| APDS #1 | 0.823 | −2.851 | 3.570 | 5.937 | 0.205 |
| APDS #2 | 1.203 | −5.715 | 11.760 | −1.330 | 0.165 |
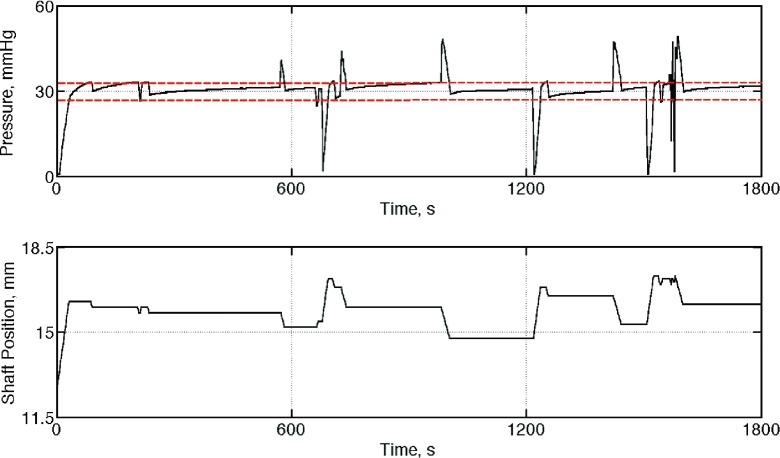
In the second calibration step, each APDS was tasked to maintain a pre-set level of pressure, 30 mmHg in this experiment, by adjusting the actuator shafts. A sample set of data (pressure and actuator’s position) showing the performance of one APDS is presented in Figure 9.
FIG. 9.
Sample results of the test conducted to demonstrate the ability of the APDS#1 to maintain a pre-set level of pressure (30 mmHg). Top frame: applied pressure on the pressure pad; bottom frame: position of the actuator shafts to adjust the pressure around the set point.
The sensor drift test showed some considerable changes in pressure immediately after positioning of the weight onto the FSR sensor up to 10% of its original value. Within about 1 minute, the measurement stabilized and a drift of less than 5% was noticeable. For the hysteresis test, peak pressure remained constant from measurement to measurement (less than 2% change), and minimal hysteresis was noticed when the measurement was repeated.
B. APDS-animal implementation
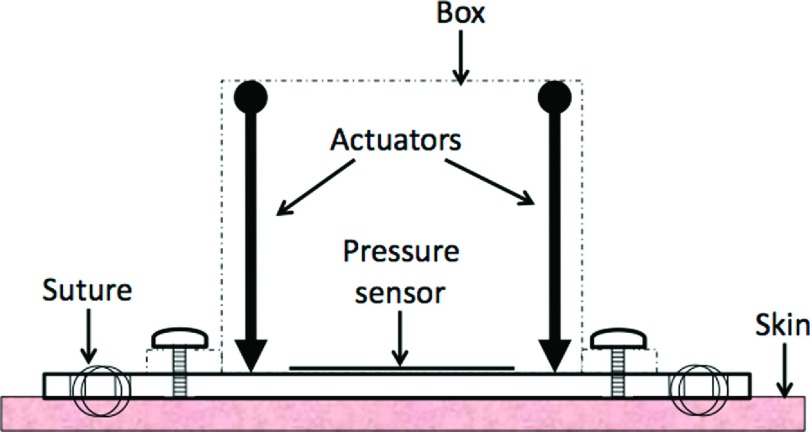
The connection of the APDS to each animal was conducted in a surgical suite under general anesthesia. The base frame of each box was sutured into place by experienced clinicians using a sternotomy wire (A&E Medical Corporation, Farmingdale, NJ). Figure 10 shows a drawing of APDS’s position on the skin tissue.
FIG. 10.
Side view drawing of APDS and its positioning on the skin.
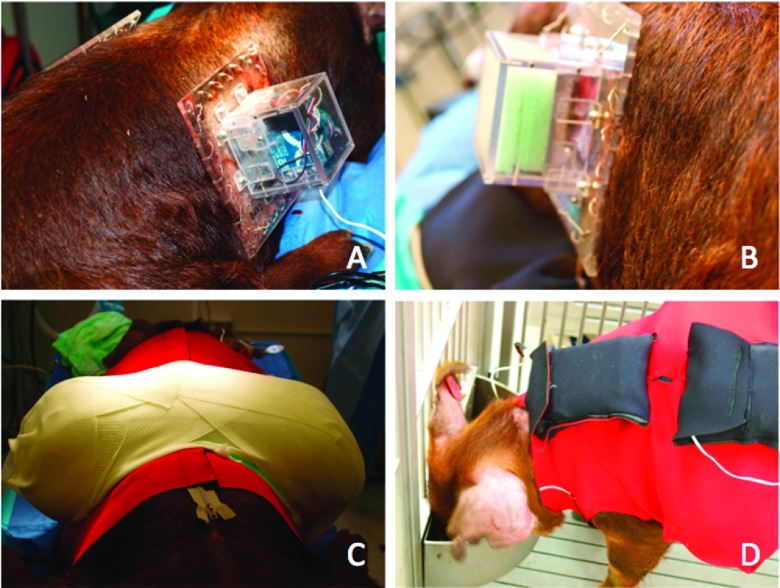
One APDS and one sham box, with the same dimensions and weight, were put on the scarred tissue on the right and left flank of any of the two animals accordingly (Figures 11(a) and 11(b)). The boxes were protected using the custom vest and casting materials shown in Figure 11(c). Fiberglass casting was used to make a sturdy shell to protect APDSs from animal interaction. An outer neoprene garment was also crafted for additional protection and housing of batteries (Figure 11(d)). The entire procedure took less than two hours.
FIG. 11.
Animal and APDS preparation on day 70 after wounding; APDS (a), sham box (b), protective vest and turtle shell (c), and outer garment and battery pocket (d).
C. In-vivo compression therapy
The boxes were left to run for two weeks while the animals were awake and active inside their cages. The computer monitoring station with a receiving XBee wireless modem was also located in the animal facility next to the cages. At the midpoint of treatment, the animals were brought to the operating room to check the condition of the boxes and to perform wound imaging and clinical assessments.
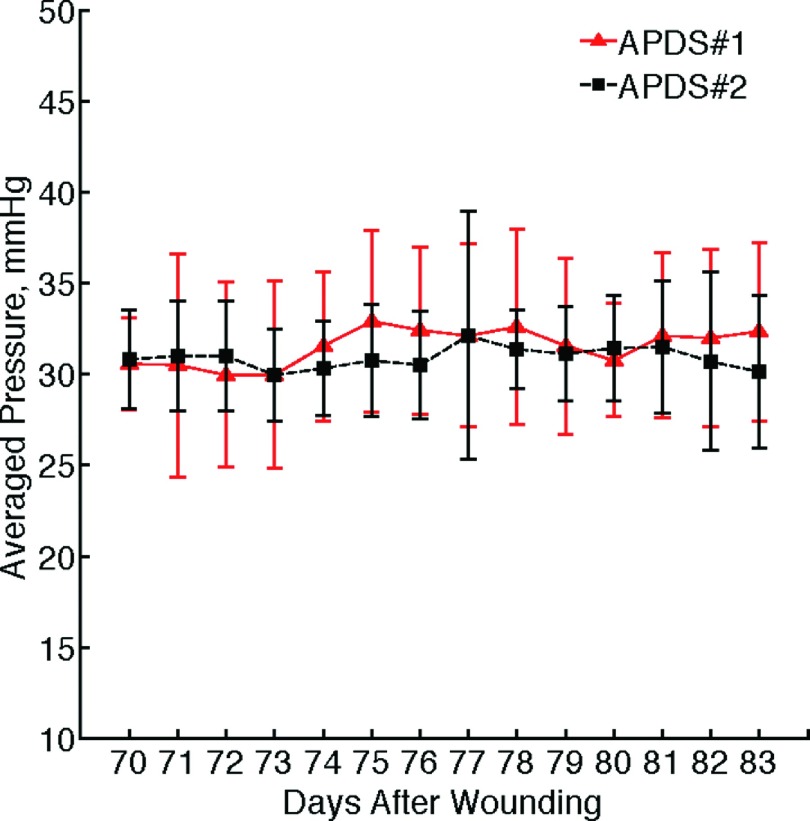
Figure 12 shows two sample sets of the data collected through the wireless communication channel from both APDSs, which were clustered at the monitoring workstation. Figure 13 presents the graphs of the averaged daily pressure for both devices. The total mean pressure applied on each scar over two weeks is 30.93 ± 3.371 mmHg and 31.54 ± 4.663 mmHg.
FIG. 12.

Sample data stream recorded from two pressure delivery systems implemented on two animals; APDS #1 (left frame) and APDS #2 (right frame). Top row shows the applied pressure on HTS versus time, and the bottom row shows the corresponding position of the actuators. The pre-set value of the pressure is 30 mmHg for this experiment.
FIG. 13.
Result of two weeks pressure delivery on scars versus time; symbols show the average daily pressure value, and error bars indicate the standard deviation of the data.
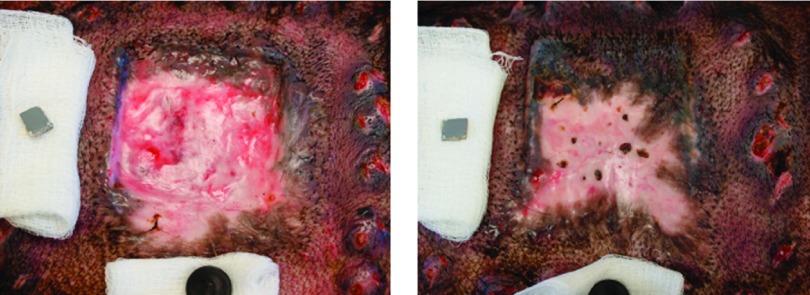
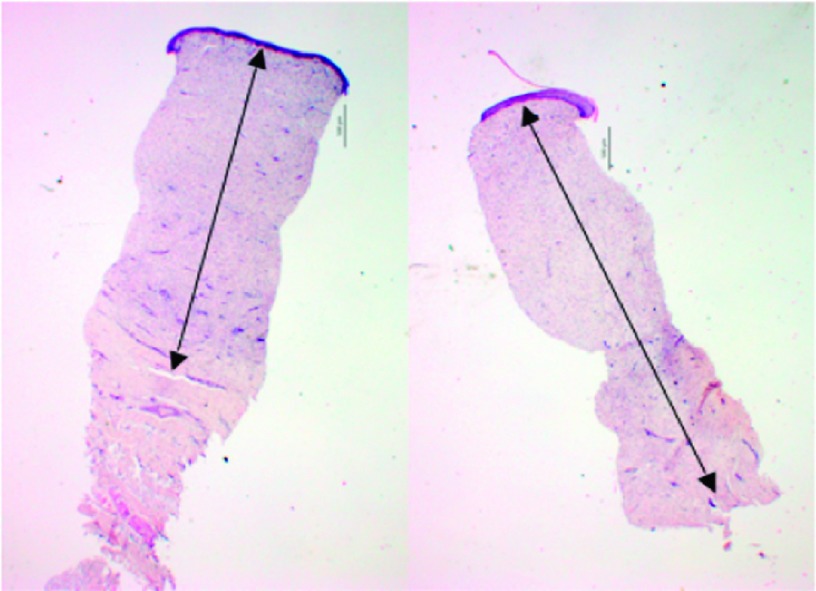
Figure 14 shows representative photographs of two hypertrophic scars (one pressure-treated scar and one sham) on the same animal on the 84th day after wounding. The gross effect of two weeks compression therapy is clearly visible on the pressure-treated scar. A decrease in dermal thickness was also observed histologically in the pilot animals. A sample set of histological images provided from the same animal on the 84th day after wounding is shown in Figure 15.
FIG. 14.
Representative photographs of the gross effects of compression therapy; left frame: pressure-treated scar, right frame: sham scar without compression therapy.
FIG. 15.
Representative histological images showing dermal thickness; left frame: pressure-treated scar, right frame: sham scar. Arrows highlight dermal thicknesses. Scale bars are 500 μm.
Quantitative assessment of scar quality is useful in clinical scar diagnosis and management. The Vancouver Scar Scale (VSS) is one of the most commonly used clinical scar assessment tools and relies on the physician’s subjective evaluation of skin pliability, height, vascularity, and pigmentation.19 In this pre-clinical study, a subjective VSS assessment was conducted on the animal model of human scar. Vascularity, pigmentation, height, and pliability were evaluated and scored every seven days. The effect of compression therapy on VSS scores in both animals is illustrated in Table II. Lower VSS scores equate with more clinically favorable scars, which were seen in the pressure-treated scar of a pilot animal. Additional clinical results have been presented in previous reports.20,21
TABLE II.
VSS score of two animals (#1 and #2) during compression therapy for the pressure-treated and sham scars.
| Vancouver scar scale | Vascularity score | Pigmentation score | Pliability score | Height score | Total VSS score | |||||||||||||||
|---|---|---|---|---|---|---|---|---|---|---|---|---|---|---|---|---|---|---|---|---|
| Treated | Sham | Treated | Sham | Treated | Sham | Treated | Sham | Treated | Sham | |||||||||||
| Animal index | #1 | #2 | #1 | #2 | #1 | #2 | #1 | #2 | #1 | #2 | #1 | #2 | #1 | #2 | #1 | #2 | #1 | #2 | #1 | #2 |
| Prior to therapy | 1 | 1 | 1 | 3 | 2 | 2 | 2 | 2 | 2 | 2 | 2 | 2 | 1 | 2 | 1 | 3 | 6 | 7 | 6 | 10 |
| After 1 week of therapy | 1 | 1 | 1 | 1 | 2 | 2 | 2 | 2 | 1 | 0 | 2 | 2 | 0 | 0 | 2 | 3 | 4 | 3 | 7 | 8 |
| After 2 weeks of therapy | 1 | 1 | 1 | 1 | 2 | 2 | 2 | 2 | 1 | 1 | 3 | 3 | 0 | 0 | 3 | 3 | 4 | 4 | 9 | 9 |
IV. CONCLUSION
We have demonstrated the construction of a simple APDS with the intent of treating wounds with a constant level of pressure for scar therapy. The device utilized two micro-actuators to adjust the position of a pressure plate to which they are connected. The plate then exhorts a controlled force on any surface to which it comes in contact. A microcontroller unit was in charge to handle the whole functionality of the device. The proposed APDS was entirely self-operated and was able to communicate via a wireless route for data transmission. To the best of our knowledge, this is the only fully automatic pressure delivery device capable of functioning in an in-vivo non-anesthetized environment. Operational performance of the first prototype was assessed using an experimental procedure. Afterwards, the proposed pressure delivery system was tasked to apply and maintain 30 mmHg of pressure on animal model during two weeks of scar treatment. By using wireless communication, remote access to the pressure delivery system was established, and therefore real-time data were successfully collected and stored in order to check the performance of the compression therapy. Results of the pilot animal study showed the ability of the constructed device to maintain the pressure close to the pre-set value at the maximum variation range of ±15%. Promising results were obtained from the clinician diagnosis reports (VSS scoring tool) and the histological examinations, which showed the effectiveness of the proposed therapeutic device on hypertrophic scar quality. Further studies of the effect of compression therapy on tissue at a molecular and cellular level are necessary to better understand the many mechanisms that influence scar formation. The focus of this study was the development of a device that could exert some biological change. Additional studies with a larger sample size are needed to be able to prove and further characterize clinical effects of this pressure delivery system. With this technology in hand, future controlled reproducible studies can now be undertaken to evaluate the effects of pressure on the pathophysiology of scar.
Acknowledgments
We thankfully acknowledge the support of NIH Grant No 1R15EB013439. The authors also want to thank Donald Smolley, Thuan Ho, Anh Vu, and Joseph Chue-Sang for their assistance in testing the FSR sensor.
REFERENCES
- 1.Vivas A. C., Tang J. C., Maderal A. D., and Viera M. H., “Hypertrophic scars and keloids, part 1: Conventional treatments,” Cosmet. Dermatol. 7(25), 309–316 (2012). [Google Scholar]
- 2.Ward R. S., “Pressure therapy for the control of hypertrophic scar formation after burn injury. A history and review,” J. Burn Care Rehabil. 12(3), 257–262 (1991). 10.1097/00004630-199105000-00011 [DOI] [PubMed] [Google Scholar]
- 3.Reno F., Sabbatini M., Lombardi F., Stella M., Pezzuto C., Magliacani G.et al. , “In vitro mechanical compression induces apoptosis and regulates cytokines release in hypertrophic scars,” Wound Repair Regener. 11(5), 331–336 (2003). 10.1046/j.1524-475X.2003.11504.x [DOI] [PubMed] [Google Scholar]
- 4.Macintyre L. and Baird M., “Pressure garments for use in the treatment of hypertrophic scars—A review of the problems associated with their use,” Burns 32(1), 10–15 (2006). 10.1016/j.burns.2004.06.018 [DOI] [PubMed] [Google Scholar]
- 5.Atiyeh B. S., “Nonsurgical management of hypertrophic scars: Evidence-based therapies, standard practices, and emerging methods,” Aesthetic Plast. Surg. 31(5), 468–492 (2007). 10.1007/s00266-006-0253-y [DOI] [PubMed] [Google Scholar]
- 6.Gauglitz G. G., Korting H. C., Pavicic T., Ruzicka T., and Jeschke M. G., “Hypertrophic scarring and keloids: Pathomechanisms and current and emerging treatment strategies,” Mol. Med. 17(1-2), 113–125 (2011). 10.2119/molmed.2009.00153 [DOI] [PMC free article] [PubMed] [Google Scholar]
- 7.Hardy M. A., “The biology of scar formation,” Phys. Ther. 69(12), 1014–1024 (1989). [DOI] [PubMed] [Google Scholar]
- 8.Cheng J. C. Y., Evans J. H., Leung K. S., Clark J. A., Choy T. T. C., and Leung P. C., “Pressure therapy in the treatment of post-burn hypertrophic scar—A critical-look into its usefulness and fallacies by pressure monitoring,” Burns 10(3), 154–163 (1984). 10.1016/0305-4179(84)90020-2 [DOI] [PubMed] [Google Scholar]
- 9.Harries C. A. and Pegg S. P., “Measuring pressure under burns pressure garments using the oxford pressure monitor,” Burns 15(3), 187–189 (1989). 10.1016/0305-4179(89)90180-0 [DOI] [PubMed] [Google Scholar]
- 10.Barbenel J. C. and Sockalingham S., “Device for measuring soft-tissue interface pressures,” J. Biomed. Eng. 12(6), 519–522 (1990). 10.1016/0141-5425(90)90062-R [DOI] [PubMed] [Google Scholar]
- 11.Steinberg M. D. and Cooke E. D., “Design and evaluation of a device for measurement of interface pressure,” J. Biomed. Eng. 15(6), 464–468 (1993). 10.1016/0141-5425(93)90059-8 [DOI] [PubMed] [Google Scholar]
- 12.Van den Kerckhove E., Fieuws S., Massage P., Hierner R., Boeckx W., Deleuze J. P.et al. , “Reproducibility of repeated measurements with the Kikuhime pressure sensor under pressure garments in burn scar treatment,” Burns 33(5), 572–578 (2007). 10.1016/j.burns.2006.08.032 [DOI] [PubMed] [Google Scholar]
- 13.Giele H., Liddiard K., Booth K., and Wood F., “Anatomical variations in pressures generated by pressure garments,” Plast. Reconstr. Surg. 101(2), 399–406 (1998). 10.1097/00006534-199802000-00021 [DOI] [PubMed] [Google Scholar]
- 14.Giele H. P., Liddiard K., Currie K., and Wood F. M., “Direct measurement of cutaneous pressures generated by pressure garments,” Burns 23(2), 137–141 (1997). 10.1016/s0305-4179(96)00088-5 [DOI] [PubMed] [Google Scholar]
- 15.Mann R., Yeong E. K., Moore M. L., and Engrav L. H., “A new tool to measure pressure under burn garments,” J. Burn Care Rehabil. 18(2), 160–163 (1997). 10.1097/00004630-199703000-00012 [DOI] [PubMed] [Google Scholar]
- 16.Ferguson-Pell M., Hagisawa S., and Bain D., “Evaluation of a sensor for low interface pressure applications,” Med. Eng. Phys. 22(9), 657–663 (2000). 10.1016/S1350-4533(00)00080-1 [DOI] [PubMed] [Google Scholar]
- 17.Lai C. H. and Li-Tsang C. W., “Validation of the pliance X system in measuring interface pressure generated by pressure garment,” Burns 35(6), 845–851 (2009). 10.1016/j.burns.2008.09.013 [DOI] [PubMed] [Google Scholar]
- 18.Mino M. J., Mauskar N. A., Matt S. E., Pavlovich A. R., Prindeze N. J., Moffatt L. T.et al. , “A fitted neoprene garment to cover dressings in swine models,” Lab Anim. 42(1), 23–25 (2012). 10.1038/laban.164 [DOI] [PubMed] [Google Scholar]
- 19.Sullivan T., Smith J., Kermode J., McIver E., and Courtemanche D. J., “Rating the burn scar,” J. Burn Care Rehabil. 11(3), 256–260 (1990). 10.1097/00004630-199005000-00014 [DOI] [PubMed] [Google Scholar]
- 20.Ghassemi P., Travis T. E., Shupp J. W., Moffatt L. T., and Ramella-Roman J. C., “A polarized multispectral imaging system for quantitative assessment of hypertrophic scars,” Biomed. Opt. Express 5(10), 3337–3354 (2014). 10.1364/BOE.5.003337 [DOI] [PMC free article] [PubMed] [Google Scholar]
- 21.Ghassemi P., Travis T. E., Shupp J. W., Moffatt L. T., and Ramella-Roman J. C., “Monitoring the influence of compression therapy on pathophysiology and structure of a swine scar model using multispectral imaging system,” Proc SPIE 8926, 892606 (2014). 10.1117/12.2037373 [DOI] [Google Scholar]


