Abstract
Purpose:
To provide a rapid method to reduce the radiofrequency (RF) E-field coupling and consequent heating in long conductors in an interventional MRI (iMRI) setup.
Methods:
A driving function for device heating (W) was defined as the integration of the E-field along the direction of the wire and calculated through a quasistatic approximation. Based on this function, the phases of four independently controlled transmit channels were dynamically changed in a 1.5 T MRI scanner. During the different excitation configurations, the RF induced heating in a nitinol wire immersed in a saline phantom was measured by fiber-optic temperature sensing. Additionally, a minimization of W as a function of phase and amplitude values of the different channels and constrained by the homogeneity of the RF excitation field (B1) over a region of interest was proposed and its results tested on the benchtop. To analyze the validity of the proposed method, using a model of the array and phantom setup tested in the scanner, RF fields and SAR maps were calculated through finite-difference time-domain (FDTD) simulations. In addition to phantom experiments, RF induced heating of an active guidewire inserted in a swine was also evaluated.
Results:
In the phantom experiment, heating at the tip of the device was reduced by 92% when replacing the body coil by an optimized parallel transmit excitation with same nominal flip angle. In the benchtop, up to 90% heating reduction was measured when implementing the constrained minimization algorithm with the additional degree of freedom given by independent amplitude control. The computation of the optimum phase and amplitude values was executed in just 12 s using a standard CPU. The results of the FDTD simulations showed similar trend of the local SAR at the tip of the wire and measured temperature as well as to a quadratic function of W, confirming the validity of the quasistatic approach for the presented problem at 64 MHz. Imaging and heating reduction of the guidewire were successfully performed in vivo with the proposed hardware and phase control.
Conclusions:
Phantom and in vivo data demonstrated that additional degrees of freedom in a parallel transmission system can be used to control RF induced heating in long conductors. A novel constrained optimization approach to reduce device heating was also presented that can be run in just few seconds and therefore could be added to an iMRI protocol to improve RF safety.
Keywords: RF heating, parallel transmission
1. INTRODUCTION
Interventional MRI (iMRI) is a promising field for minimally invasive medical procedures.1 Unfortunately, the interaction of the radiofrequency (RF) field with conductive devices can lead to dangerous local heating.2–8 Temperature increments (ΔT) above 20 °C have been measured on the tip of a wire or guidewire immersed in a like-tissue conductivity gel phantom when transmitting RF power with the body coil of the scanner.2,6 Even though these measurements were performed under extreme conditions, by placing the guidewire in the maximum E-field region and limiting heat convection, they need to be considered for the device safety approval.9 Reasonable heating predictions of wire structures were possible in phantoms by modeling the wire and its surrounding through a transfer function that weighted the integration of the tangential E-field along the wire.10 On the other hand, very little information is available on the actual heating within the body that could be considerably different than homogeneous model phantoms.11
One possible solution to the RF heating problem would be to eliminate or minimize metallic parts in interventional devices; however, there are restrictions in the type of materials that can be used based on mechanical properties and the ease of maneuvering the device through the vasculature. Different approaches have been studied related to the engineering of the device itself, such as combining synthetic fibers with metallic material to reduce the induced heating while keeping the mechanical specifications.12,13 In addition, coaxial chokes have been proposed to eliminate the antenna or resonance effect of a long wire in the RF environment.14 However, so far none of these techniques has been completely successful in presenting a safe and mechanical stable device and active research continues to be performed in this direction.
Another approach to reduce RF heating on wires is to optimize the RF transmitter to reduce the source of heating. Induced currents in long conductors and consequent local heating were minimized by amplitude and phase weights to the excitation of the many channels of a parallel transmit (pTX) system.15 Additionally, reduced heating of a curved wire was possible by generation of a zero-electrical-field plane through an optimal B1 excitation using a body coil transmitter in linear polarization mode.16 Recently, a simulation study has proposed device-friendly modes through optimization of the RF pulse of a pTX array to reduce the local SAR around deep brain stimulation implants.17
In this work, we present an optimized parallel excitation scheme based on the minimization of a driving function for device heating closely related to those defined in previous works.5,10 We tested simple phase configurations that minimize the E-field coupling in a long conductor aligned along the z-axis of the MRI scanner. RF transmission was performed with a four-channel planar array driven by near-to-coil current-source amplifiers.18,19 In addition to simple phase configurations, we present a set of amplitude and phase configurations that resulted from the minimization of the driving function for device heating but constrained by B1 homogeneity in a predefined ROI.
2. THEORY
A thin long wire immersed in the electromagnetic field of the MRI scanner can be thought as a receiver antenna where the incident electrical field is the tangential component of the total electrical field. In a receiver antenna, the voltage (or potential) across the antenna’s gap can be calculated from the integral of the incident tangential field along the length of the antenna.3,20 For the case of a conductive wire without central gap, this potential drop is concentrated at the point of impedance transition located at the tip of the device.21 Based on this analogy, a reasonable prediction of the heating at the tip of a bare wire, as well as at the tip of an insulated wire with tip exposed, was possible by weighting the integration of the tangential E-field with a transfer function calculated from a model of the device and the surrounding medium.10 If we only aim for reducing the excitation of the wire without attempting to predict temperature or SAR values we can dispense of this model. Therefore, our goal here is to optimize the RF excitation based only on the minimization of the excitation potential across the wire, which we consider as the driving function for device heating.22 Using complex notation for the fields, the excitation potential is formulated as follows:
| (1) |
Equation (1) was expressed as a function of the magnetic potential A1, assuming we can neglect the contribution to the field due to static charges. This is a valid approximation for surface loops properly designed which have minimum dielectric losses when coupled to the sample at 64 MHz.
The total magnetic potential for a pTX system results from the sum of the individual magnetic potentials and it is given by
| (2) |
where is the normalized spatial distribution of the magnetic potential, mn and ejθn are the amplitude and phase weighting factors given by the current applied to channel n, respectively. By replacing Eq. (2) in Eq. (1), the wire potential can be obtained as
| (3) |
where the complex wire potential due to each coil is given by
| (4) |
On the other hand, the total complex magnetic field B1 is given by
| (5) |
where is the normalized magnetic field spatial distribution corresponding to coil n. A set of gain mn and phase θn parameters that minimize the sum in Eq. (3) will also have a cancelation effect on Eq. (5), therefore affecting B1 homogeneity. A trade-off solution could be found based on the following formulation:
| (6) |
where h(B1(r)) is a function defined to weight B1 homogeneity in a specified ROI, and Wmin and H are constants that represent specified threshold values. Based on Eq. (6), we aim to find a set of amplitudes and phases for the array that would minimize the coupling of the E-field along the wire at a particular location while preserving B1 homogeneity in a predefined ROI.
3. METHODS
3.A. Transmit array
All experiments were performed with a four-channel planar coil array driven by near-coil current-mode class-D (CMCD) with envelope feedback amplifiers.18,19 Current-source amplification allows direct control of the B1 field based on a one-time calibration.18 The loops of size 13 × 19 cm (inner dimensions) were constructed on a 0.8 mm thickness FR-4 board using a 6 mm copper tape. In a loaded condition, each loop was resonated at 63.66 MHz by six capacitors splitting with values around 80 pF. Nearest neighbor elements were overlapped to add isolation to the amplifier decoupling method, while next neighbor decoupling was exclusively achieved by the amplifier decoupling method.23 All elements were aligned along their shorter dimensions on same plane resulting in an array of 46 cm total length. Since a typical iMRI procedure uses a guidewire oriented largely along the scanner’s z-axis, the array’s long axis was also aligned in this direction to have independent phase control along the wire. To reach the distal element and to keep amplifiers far enough to avoid susceptibility artifacts from the slightly magnetic amplifier prototypes, each element was connected to each amplifier through a λ/4 (85 cm) trapped coaxial cable. To keep same impedance condition seen by the coil into the amplifier (ideally infinite) and amplifier into coil (<10 Ω), the cable was combined with a λ/4 discrete phase shifter to behave as a λ/2 connection. Nearest and next neighbor decoupling values were better than −20 dB for most drain voltage conditions as it was similarly presented in previous work.18
3.B. Wire and phantom setup
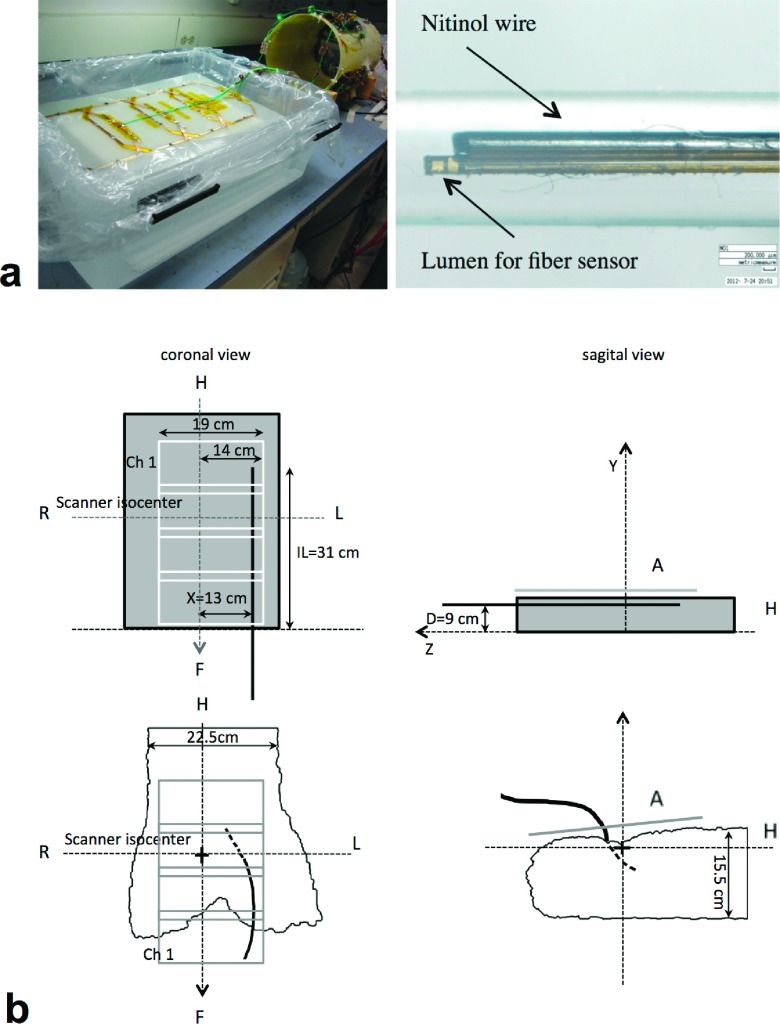
A saline phantom made of 20 l of H2O and 10 g of NaCl was built in a 50 × 40 × 17 cm (length × width × height) container to simulate similar loading that the average human torso previously calculated from measurements performed on ten volunteers of varying size. In addition, 30 ml of gadolinium (469.01 mg/ml gadopentate dimeglumine, Magnevist) was added to the solution to shorten T1 relaxation (to approximately 300 ms) to increase the SNR in the MRI experiment. Several holes were drilled on one of the phantom’s side to insert the wire at different off center positions and an acrylic grid was placed at the bottom to set the wire in a stable position through acrylic holders. From previous experiments under the same setup, we proved that an insulated nitinol wire with tip exposed heats up more than its bare counterpart, in agreement with previously presented work.6,10 In addition, under the same setup, higher temperature increments were measured with the insulated wire versus an active guidewire used for subsequent animal experiments. Therefore, in all phantom experiments presented here, we chose the insulated wire to have higher temperature fluctuations per applied power. The device was 128 cm in length, 0.6 mm total diameter, and had a lumen to insert a fiber-optic sensor (0 °C–85 °C OTG-M170-10-80F2.5-1.55, Opsens, Canada) to measure the temperature of the wire when exposed to the RF environment of the transmit setup at 1.5 T Espree scanner (Siemens, Erlangen, Germany). Figure 1(a) shows the planar array loaded with the phantom (left) and the insulated version of the nitinol wire with the lumen attached for the location of the fiber-optic sensor (right).
FIG. 1.
Four-channel planar array driven by near-coil CMCD amplifiers and nitinol wire with attached lumen for position of the fiber-optic temperature sensor (a). Coronal and sagittal views of phantom and animal experiment setup showing the wire/guidewire location (b).
3.C. Imaging and temperature measurements
Initially, using the body coil transmitter, critical insertion length was determined with the device located at a 13 cm off-center position and 9 cm from the bottom of the phantom. Once critical IL was determined, the center of the pTX array was located at a 4.5 cm off-center position such that the device was located 1 cm apart from the nearest parallel coil’s trace [Fig. 1(b)]. With the insulated wire immersed in the phantom, real-time temperature measurements, using the optical temperature sensor connected to a signal conditioner (Multisens, Opsens, Canada), were performed at the tip of the device while running a gradient-echo (GRE) sequence for imaging with 2 ms RF pulse, 10 ms TE, 20 ms TR, 450 × 450 mm FOV, and 5 mm slice thickness (STH). Before heating evaluation in all setups, continuous scanning and temperature reading were performed while slowly moving the sensor tip to confirm the hotspot was positioned at the tip of the wire (expected to be the hot spot). This procedure was repeated for each wire configuration at their critical insertion length which was confirmed to be similar under both body coil and local transmission setups. In all temperature measurements, temperature increment (ΔT) was calculated by subtracting the average baseline temperature from the steady state temperature after a 1 min scan.
In addition, temperature along the wire was measured by pulling the sensor in 1 cm steps from the tip toward the distal end of the wire up to its exit from the phantom. For each of these temperature readings, we let the phantom reach a steady temperature value after 1 min scan and cool down to the original baseline temperature before next excitation cycle. These measurements were first performed while transmitting with the body coil, and later with the transmit array in a phase configuration for maximum B1 homogeneity and a configuration for reduced heating while keeping same target flip angle at the plane of the wire than that was set previously for the body coil transmitter.
Once body coil transmission was disabled, single and simultaneous channel transmissions were performed with the array loaded with the saline phantom with and without the wire immersed in it. Images were acquired using same GRE sequence with 100 ms TR and signal was received by the body coil of the scanner. The same sequence, with 10% excitation duty cycle (20 ms TR), was used for additional imaging and heating measurements during phantom experiments. Flip angle and B1 maps of each channel were obtained through the double angle method24 using the same GRE but with 3 s TR to reduce relaxation effects. B1 and flip angle maps were obtained in the plane of the wire while images of the phantom were obtained at a coronal plane 2 cm below and away from the strong field distortion artifacts originated in the surrounding of the wire.
3.D. Quasistatic numerical simulations and constrained minimization of E-field coupling to the wire
Using a customized matlab (Mathworks, Natick, MA) routine based on quasistatic numerical simulations, B1 profiles and W [in arbitrary units (a.u.)] were obtained for the presented coil configuration and wire location relative to the array [Fig. 1(b) left]. In a matlab script file, the parameters that set the coil array configuration (number of elements, loop dimensions, and overlapping distance) and the wire configuration (length, orientation, and position relative to the coil) were specified. Based on this configuration, a function was called that numerically calculated the different components of the B1 field for each loop of the array in a coronal plane (B1xn and B1zn) when the currents driving the loops had same amplitude (mn = 1) and phases (θn = 0). The total B1 field for the four-channel array was then calculated as
| (7) |
The excitation potential along the wire that resulted from each loop of the array was obtained by calling another function that performed a numerical integration (using the “quad” function) of the corresponding magnetic potential (A) along the length of the wire (A was recalculated at each step of the integration). The amplitude and phase of each current were set to one and zero, respectively, and a simplified version of w (=w0n) was calculated along the length of the wire
| (8) |
where xw, yw, and l were the off-center position, coronal plane, and length of the wire, respectively. It is important to highlight that in the simulations, we used simplified versions of the physical variables [for example, the ω term is missing in Eq. (8)] and therefore, we used a.u. From this initial calculation, the total wire potential that resulted from any set of amplitude and phase values was
| (9) |
Based on this equation and as proof-of-concept experiments, w was calculated for predetermined phase configurations that were tested in subsequent scanner experiments and correlated to temperature measurements.
Additionally, an optimization problem was created in the same script using the global optimization toolbox from matlab. First, a ROI was specified in the coronal (x,z)y plane
Defining as input variables mn and θn, a minimization of Eq. (9) was performed through a gradient-based nonlinear solver (fmincon, matlab optimization toolbox) constrained to a function of B1 [given by Eq. (7)] and defined as
| (10) |
where
| (11) |
In Eq. (11), ε is the maximum normalized error allowed between the field value and a target value in the specified ROI. This function will have a maximum value of one when the B1 field at a point r in the selected ROI is identical to the target field and will approach to zero as the normalized field error increases. For the experiments performed here, B1T was set equal to 8 μT that corresponded to approximately 90° flip angle excitation at the plane of the wire located approximately at 1 cm of distance from the surface of the array. To confirm that the result of this constrained minimization problem led to a heating reduction, the resulting optimum phase and amplitude configurations for a predefined ROI were tested on the benchtop with the same wire, phantom, and temperature measurement setup than that used in the MRI scanner. To confirm that the right ROI was excited each time, B1 was monitored through a pickup loop connected to the oscilloscope and shifted manually along the z-axis.
3.E. Finite-difference time-domain (FDTD) simulations
The four-channel pTx array, phantom, and a modified version of the insulated wire were modeled in 3D electromagnetic software (XFdtd 7.3, Remcom, Inc.). The model of the insulated wire had 1.5 mm total diameter (perfect conductor with 0.6 mm diameter and insulation material with 10−14 S/m conductivity and 0.45 mm thickness), 2 mm long exposed tip, and 31 cm insertion length. The total length of the wire (128 cm) was shortened to allow for reasonable simulation times. With the aim of analyzing the effect of this modification, B1 and SAR simulations were run for two different wire lengths (40 and 50 cm) while keeping insertion length the same. Decoupling of nearest neighbors was achieved only by geometric overlapping while no decoupling method was performed for next neighbors. Decoupling values were −10.1 and −13.1 dB between neighbor and next neighbor elements, respectively. Current through each loop was controlled by a 64 MHz sinusoidal current source whose phase was set according to the desired pTx excitation (same amplitude was set for all channels). Current feed adjustments were performed so the current in each loop was approximately 1 A. Target cell and minimum cell sizes were 1.5 and 0.5 mm, respectively (XACT Meshing, XFdtd 7.3 was used), resulting in 10 h simulation time for each phase configuration. B1 excitation profiles were evaluated in the same plane where images of the phantom were acquired in the MRI scanner (2 cm below the plane of the wire). SAR maps were obtained in the plane of the wire and local maximum and global values were reported for each of the phase configurations previously tested in the MRI scanner.
3.F. MRI animal experiment
Animal experiments were approved by the Institutional Animal Care and Use Committee according to contemporary NIH guidelines. The transmit array was set over the abdomen of a 32 kg Yorkshire pig under anesthesia in the MRI scanner with channel 4 being the closest to the animal’s head. An active guidewire11 was inserted from femoral vein through an 8 Fr × 23 cm introducer sheath (Fast-Cath, St. Jude, MN). The guidewire insertion length was 15 cm and the guidewire trajectory is shown in Fig. 1(b). This insertion length was identified as critical during body coil transmission as similarly performed by Sonmez et al.11 An inner temperature probe was positioned at the tip of the guidewire. Images were obtained by transmitting simultaneously with all channels and the temperature at the tip of the guidewire was measured for different phase configurations previously tested on the saline phantom. Temperature was measured while running the GRE sequence. The target flip angle was 60° and TR was set for 5% duty cycle excitation. In vivo flip angle maps were obtained using similar method than that for the phantom experiment (DAM) but with a single-shot EPI readout. This sequence had the same RF pulse than the GRE sequence used for imaging (2 ms hanning windowed sinc pulse) and the imaging protocol was set with 13 ms TE, 3 s TR, 5 NA, 12.06 s TA, 2717 BW/pixel, 5 mm STH, and 170 × 340 mm FOV. Using this method, B1 map per channel was obtained in approximately 24 s.
4. RESULTS
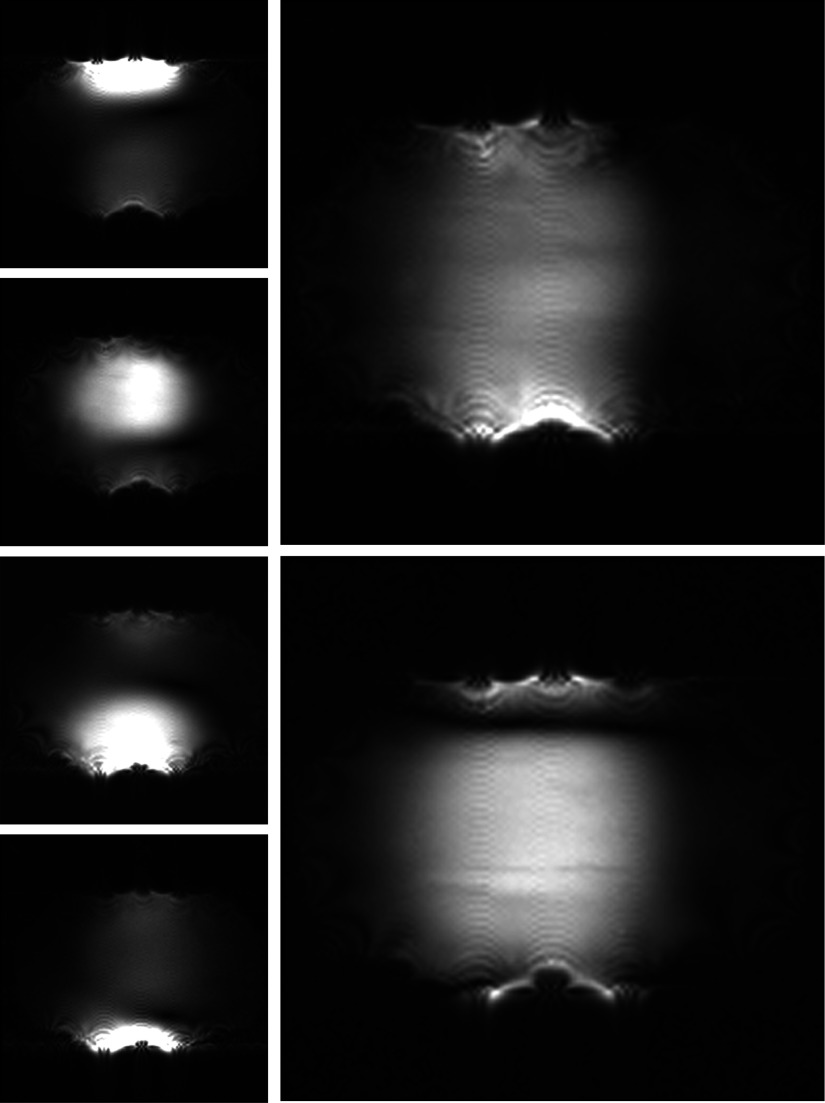
Images obtained through single and simultaneous transmission using the planar array loaded with the saline phantom and without the wire are shown in Fig. 2.
FIG. 2.
Coronal images of the saline phantom obtained with single (left) and simultaneous (right) channel transmission with all channels in phase (top right) and channels 1 and 4 180° out-of-phase (bottom right).
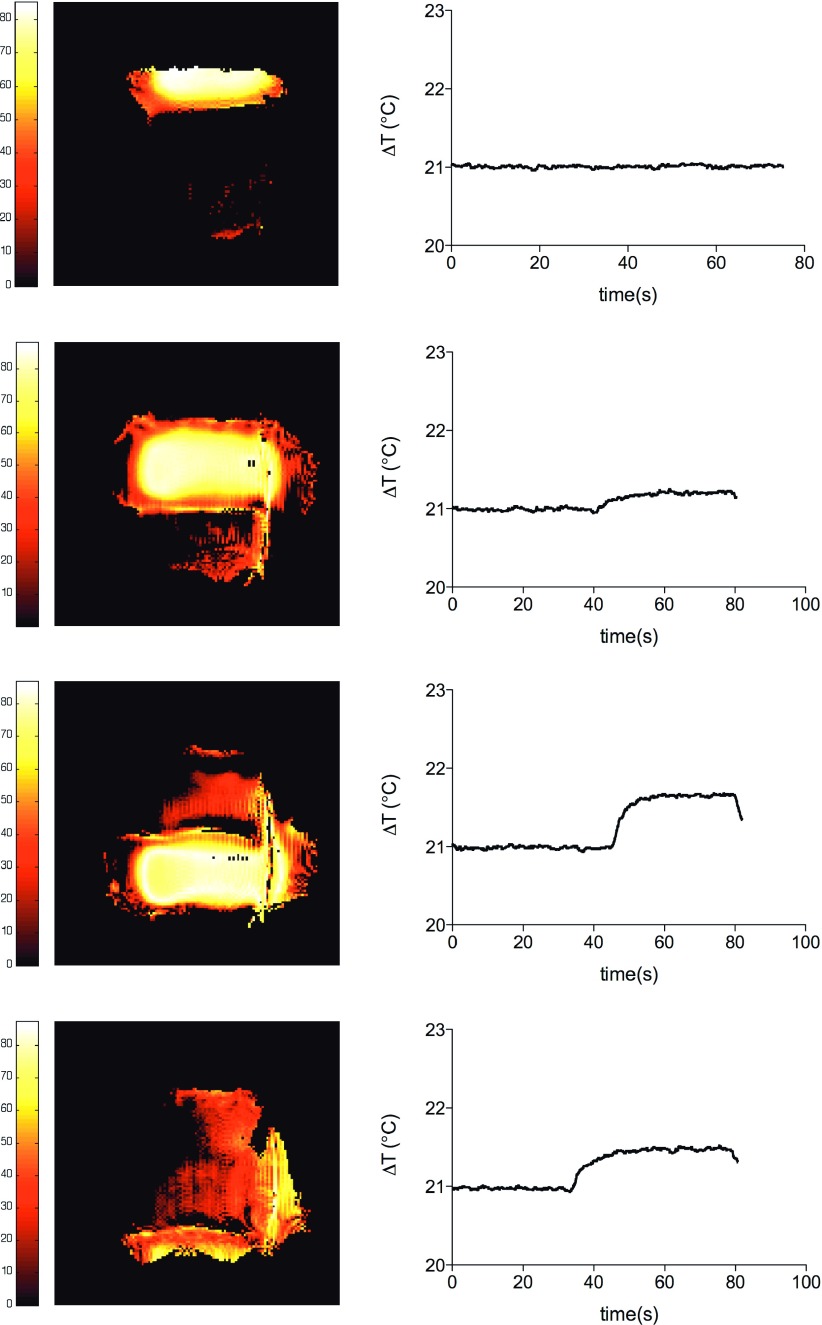
These images show successful decoupling between elements and phase control as indicated by the two signal suppression bands that resulted from the 180° out-of-phase excitation of channels 1 and 4. Figure 3 shows single channel flip angle maps and corresponding ΔT on the tip of the wire (a baseline temperature is shown in the first 40 s). We can see how channel 1 (top element in the phantom setup) has almost no contribution to the induced E-field on the wire which was expected since the wire was largely not covered by the excitation FOV of this element.
FIG. 3.
Coronal flip angle maps obtained during single channel transmission with the wire immersed in the saline phantom and corresponding temperature increments measured on the tip of the wire (hot spot).
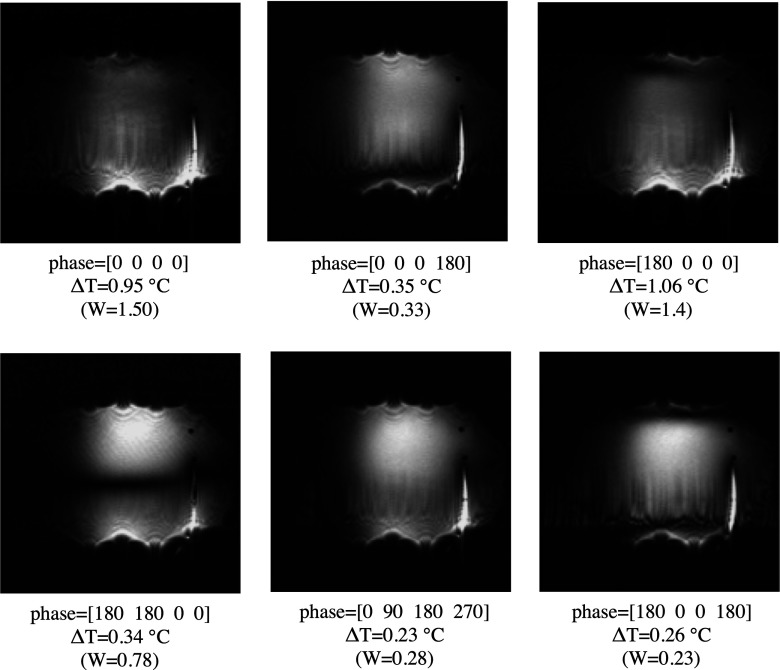
Maximum heating of the tip was observed when transmitting with channel 3. From the maps, we confirmed that flip angle was approximately 90° close to the surface of the coil as expected from previous calibration of the system on the benchtop. Interestingly, from these maps, we can also see how higher field distortions caused by the interaction of the wire with the RF environment were correlated with higher ΔT measured at the tip of the device. Figure 4 shows the result of simultaneous phased excitation at a plane 2 cm below the plane of the wire. We chose this plane to show image of the in-phase excitation with reduced field distortion caused by the “hot wire.”
FIG. 4.
Images of the wire and phantom obtained in a coronal plane 2 cm below the plane of the wire. All channels were transmitting simultaneously and with different phase configurations. The resulting temperature increment at the tip of the wire and the simulated W values (in arbitrary unit) are shown in the images. Based on the sensor resolution, the temperature increments were within ±0.1 °C.
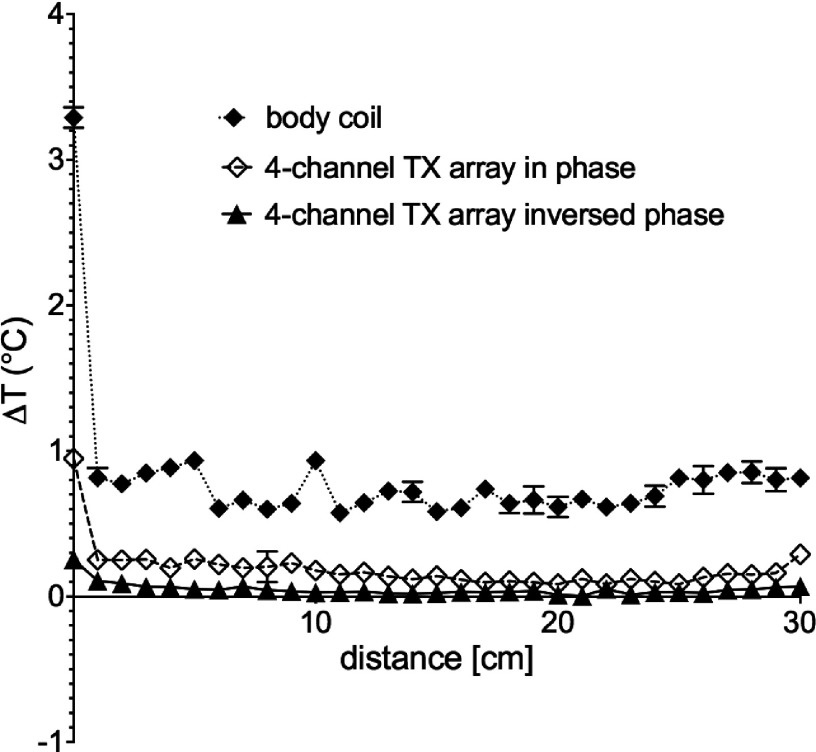
Simulated W and corresponding ΔT at the tip of the wire are shown at the bottom of each image for a 90° flip angle excitation. The temperature data fit reasonable a quadratic dependence on W (graphic not shown). Additionally, heating reduction was effective all along the critical immersed length of the wire for the 180° out-of-phase configuration as confirmed by Fig. 5.
FIG. 5.
Temperature increment measured along the wire from the tip (0 cm) to the phantom exit (30 cm) at points located 1 cm apart. The sensor was pulled out while transmitting with the body coil of the scanner (solid diamond), transmitting with the planar array in a phase configuration that maximizes B1 homogeneity (open diamond), and with a phase configuration that minimizes the total electrical field induced on the wire (triangle). For all experiments, the target flip angle at the plane of the wire was approximately 90°.
For this experiment, the maximum temperature at the tip was reduced by 92% compared to that obtained during body coil transmission, and 73% compared to that obtained during parallel transmission with the phase configuration for maximum B1 homogeneity at the same flip angle (approximately 90°). Note that in the case of heating, there is a steep temperature evolution along the wire, which is expected for the insulated wire where the E-field is highly concentrated at the exposed tip as previously shown by Park et al.10
The execution time of the constrained minimization algorithm was approximately 12 s in a standard CPU (Intel Xeon CPU E5-2620 @ 2.0 GHz) and it could be further accelerated by a GPU implementation. Figure 6(a) shows simulated B1 profiles and W values at the specified ROI that resulted from transmitting with reduced number of elements while Fig. [6(b)] shows the results from transmitting simultaneously with all channels by setting the phases and amplitudes obtained through the optimization algorithm.
FIG. 6.

Simulated B1 profiles of the four-channel transmitter at different ROIs and induced potential (W) along z-direction for a wire located at the same position relative to the array and phantom than that set in the MRI experiments. An amplitude of 1 corresponded to a RF excitation where flip angle value was twice (double current value) than that set in the MRI experiments shown in Figs. 4 and 5. Target ROI was simply achieved by exciting the corresponding channels (a) and by simultaneous transmission with the set of amplitude and phase values that resulted from the optimization algorithm at a given ROI (b). Temperature increment on the wire’s tip was estimated from real-time temperature curve measured on the benchtop for each configuration.
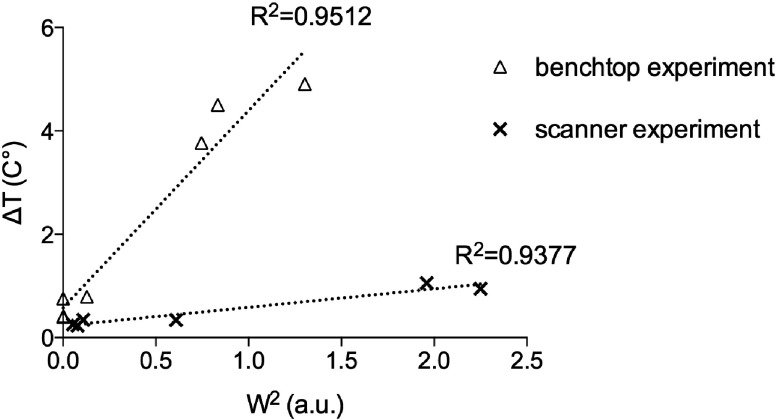
The temperature at the tip measured on the benchtop for each phase and amplitude configuration is also shown in this figure. We can see the advantage of the method in obtaining similar FOV but at a reduced ΔT on the tip of the wire by exploiting the additional degree of freedom offered by the pTX system [Fig. 6(b)]. Maximum heating reduction was around 90% for ROI#4 and minimum reduction was around 50% for ROI#1. Note that for ROI#1, ΔT was only 0.79 °C when transmitting with reduced number of elements. This was in agreement with the fact that the induced field on the wire by channels 1 and 2 was minimal at the set relative position. Figure 7 shows measured temperature values vs simulated W2 values for both heating tests performed in the scanner (Fig. 4) and on the benchtop (Fig. 6). A linear curve fit is shown in dashed line for both cases.
FIG. 7.
Temperature increment vs simulated W2 corresponding to the RF phased excitations shown in Figs. 4 and 6 at the two different current levels. Linear curve fits are shown in dashed lines.
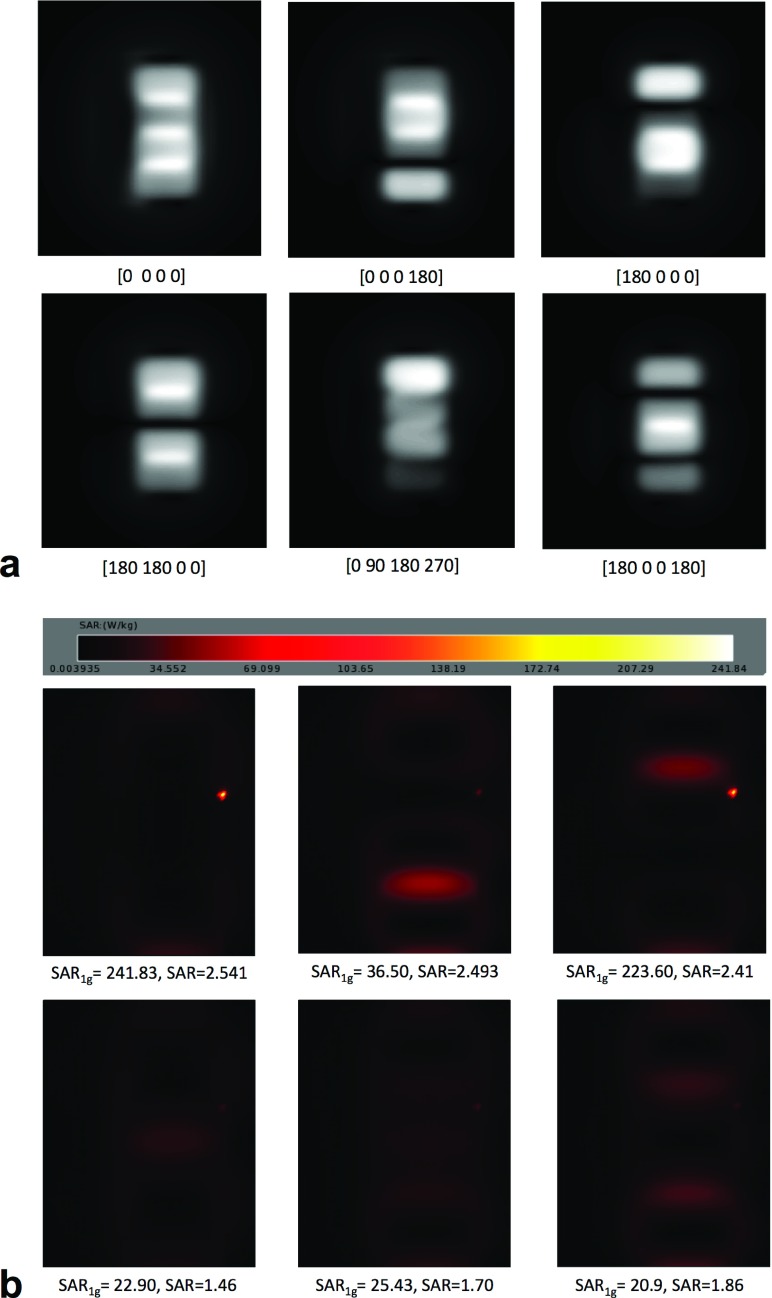
Despite the poorer decoupling values among modeled loops, RF excitation profiles obtained by FDTD simulations [Fig. 8(a)] were in agreement with those obtained in the MRI scanner for same phase combinations (Fig. 4). In the SAR maps [Fig. 8(b)], the location of the hot spot (local SAR maximum) was confirmed to be at the tip of the device, and its evolution with the different phase combinations was in close agreement to the experiment shown in Fig. 4. Additionally, the reduction of local maximum SAR at the tip of the device was possible without an important increase in global SAR value.
FIG. 8.
B1 excitation profiles (a) and corresponding SAR maps (b) for the different phase setups simulated by FDTD method for a wire of 40 cm in length. For all phase configurations, local SAR maxima at the tip of the device and global SAR were obtained for a current loop of 1 A (indicated at the bottom of each map).
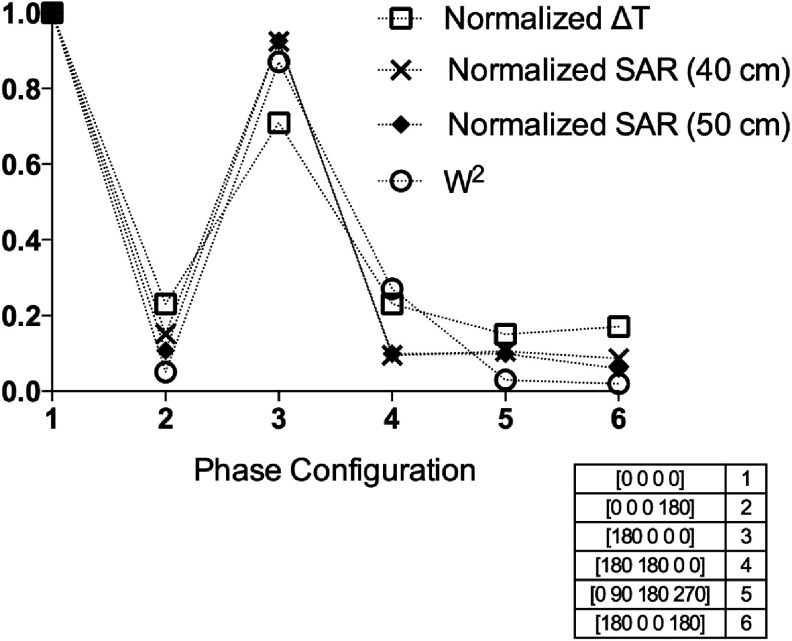
This can be clearly seen in the plot shown in Fig. 9, where the temperature increments measured in the MRI experiments were compared with SAR obtained by FDTD simulations (for two different total lengths of the wire) and with W2 obtained through the quasistatic numerical simulation, all these variables referred to its maximum value obtained with all channels in phase.
FIG. 9.
Temperature measurements versus RF heating simulations (both FDTD and quasistatic method) of the wire in the phantom setup for different phase combinations of the pTX system. All variables were normalized to their corresponding maximum value obtained with all channels in phase (configuration 1) and a current amplitude of 1 A.
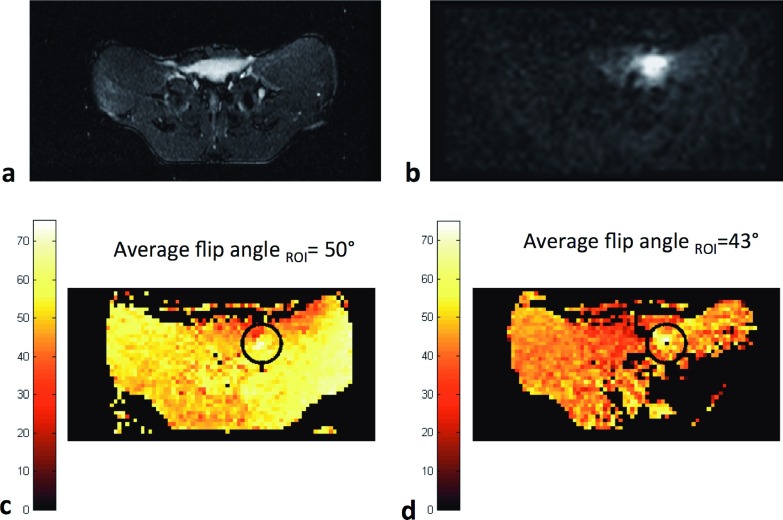
Because of the relative load insensitivity of the CMCD amplifiers, no additional adjustments from the phantom experiment were necessary for successful imaging of the animal. Figure 10(a) shows an axial slice of the animal’s anatomy obtained with a standard localizer sequence. The signal received with the active guidewire for the same slice is shown in Fig. 10(b). Flip angle maps and average flip angle in the surrounding of the guidewire (ROI with 6 pixel-radius) are shown in the case of transmitting with body coil [Fig. 10(c)] and transmitting with the pTX system with all channels in phase [Fig. 10(d)].
FIG. 10.
Axial images and B1 maps at the isocenter obtained with EPI sequence. Axial image of animal’s abdomen obtained through body coil TX/RX using a localizer sequence (a). Device visualization through body coil TX and local RX by active guidewire (b). Axial flip angle map and average flip angle in the highlighted ROI obtained through EPI sequences when transmitting with body coil (c) and with the pTX array with all channels in phase (d).
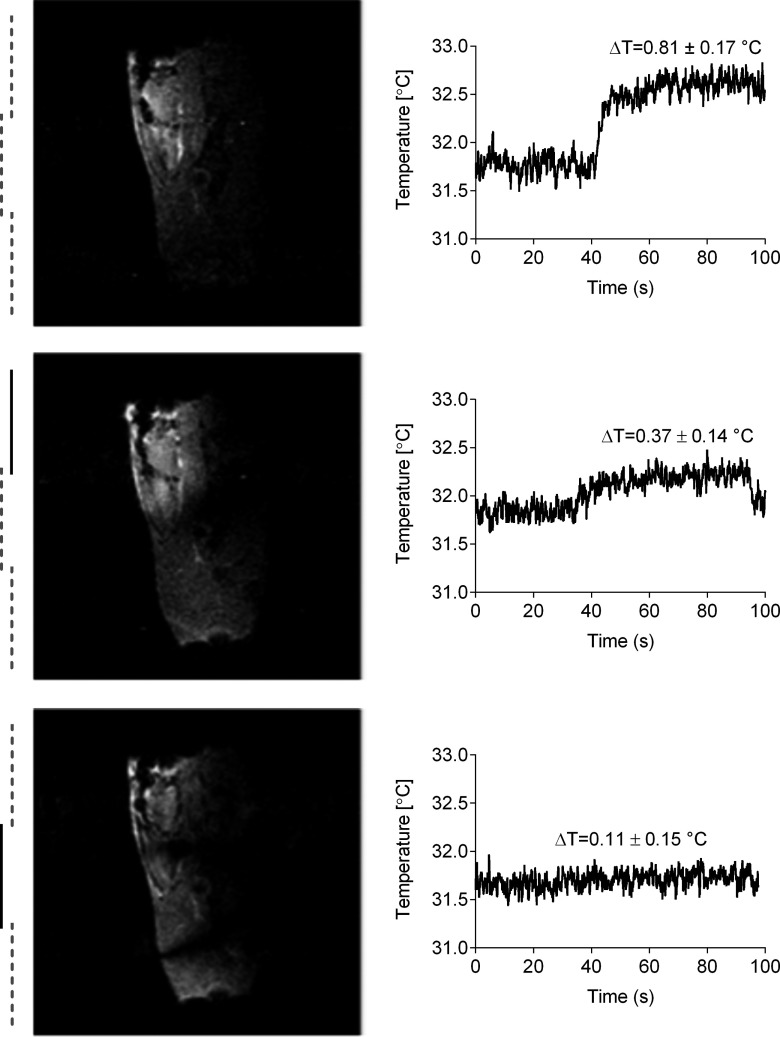
In this setup, average flip angle in the highlighted ROI (surrounding of the guidewire) was 50° when transmitting with body coil and 43° when transmitting with the pTX array. At same power settings, Fig. 11 shows from top to bottom sagittal images and corresponding ΔT on the tip of the wire when transmitting with the transmit array with all channels in phase, with channel 1 and channel 4 180° out-of-phase and with channel 1 and channel 3 180° out-of-phase (elements with phase inversion are indicated by dark solid lines). Note that channel 1 was outside the image FOV (in the foot direction) and only coupled to the part of the guidewire outside the animal’s body. Temperature was reduced by 54% when the phases of channels 1 and 4 were inverted and by 86% when the phases of channels 1 and 3 were inverted instead. For this last phase configuration, the temperature increment was close to the minimum detectable value of the measurement system; however, B1 homogeneity was further compromised by the presence of two signal suppression bands.
FIG. 11.
Sagittal images of the animal’s abdomen and corresponding temperature increment at the tip of the guidewire at the same power setting than that set for flip angle maps (Fig. 10). All channels were transmitting simultaneously in phase (top), channel 1 and channel 4 180° out-of-phase (middle), and channel 1 and channel 3 180° out-of-phase (bottom). Dark solid lines indicate the elements with phase inversion.
5. DISCUSSION
We have shown that a device-friendly excitation is possible through the minimization of a variable defined as the total excitation potential along the wire. The excitation potential on the wire W was formulated here as the driving force of the induced RF heating for a given coil geometry and wire location. We confirmed that as this variable was minimized by a particular phased excitation, the ΔT at the tip of the wire was also reduced. Since we did not aim to predict absolute temperature or SAR values, we were able to formulate the problem independent of the structure of the device and its surrounding. Note that Eq. (1) can be seen as a simplified model, with unity transfer function (assuming the transfer function is positive and real), from that presented in the work by Park et al.10
We showed around a fourfold reduction of heating in the MRI phantom experiments when replacing the body coil TX by the pTX excitation where the elements at the edge of the array were 180° out-of-phase. For this case, signal suppression bands were close to the edge of the FOV but homogeneous excitation was possible toward the center of the phantom. Therefore, we obtained reasonable B1 homogeneity in a large part of the FOV with significantly reduced heating. Similar improvement was shown on the benchtop when testing the amplitude and phase weighted excitations that resulted from the constrained minimization algorithm, clearly showing how the degrees of freedom of the four-channel transmitter can be exploited to further control the E-field along the wire while sacrificing some B1 homogeneity outside a predefined ROI. Note that high B1 homogeneity was not possible for the entire ROI#3 which was proved to be a region of strong E-field coupling to the wire. This situation could be improved by a more stringent threshold of the constraint function at the expense of increasing W. In practice, this approach would be acceptable if the resulting ΔT is still below a predefined safety threshold. Even though the effective excitation FOV will be reduced to that of a system with reduced number of elements (shown two or three channels), the significant reduction of heating (up to tenfold reduction) justifies transmitting simultaneously with the additional channels.
Importantly, the trend of W2 and SAR with phase combinations, obtained by quasistatic numerical simulation and FDTD method, respectively, was both in close agreement with the trend in temperature measured in the MRI experiments, reinforcing the validity of a quasistatic approach for the presented problem at 64 MHz. The aim of this study was to present a simple and fast method to calculate a device-friendly excitation for the elements of the array without prediction of absolute temperature or SAR values. In a real iMRI procedure, we would tailor the RF excitation based on the minimization of W and adopt a real-time device safety monitoring method during excitation.11,25–28
FDTD methods offer more accurate predictions of the fields for a given wire and phantom configuration but require more calculation power (that could take many hours to days of simulations) which currently is not practical for near-real-time monitoring during an intervention. Conversely, the matlab routine runs in just few seconds, and the relative position of the wire to the array (obtained through imaging) could be updated in the algorithm to get a new set of optimum phase and amplitude values that minimize heating. Interventional devices as the active guidewire used in the in vivo experiments are more complex structures than plain wires and modeling is expected to be more difficult and time consuming. Even though different wires and phantom solution will present different heating behaviors, we think that the general solutions described here should apply to a wide range of configurations.
We have shown successful operation of the system in the in vivo experiments. Previously reported in vivo procedures with this guidewire under body coil transmission11 showed negligible heating under normal parameter scanning. As expected, in this work we also measured relatively low in vivo heating, presumably due to effects such as convection in the blood stream and location of the guidewire relative to the body coil transmitter (low E-field area). Even at these low temperature increase values (∼1 °C), we were able to detect close to zero ΔT when the phase of successive channels was set 180° out-of-phase. Importantly, this “zero” ΔT was achieved at approximately 43° average flip angle in the surrounding of the guidewire as indicated by the flip angle maps, confirming an effective cancelation of the E-field coupled to the guidewire at this no optimal condition for B1 homogeneity.
In the phantom experiments, we did not aim to set a worst-case scenario for heating like it is usually performed in safety tests.9 As mentioned in Sec. 3.B, we matched the average Q-value for the human torso; this resulted in a solution of conductivity around 0.1 s/m which is more than four times lower than the conductivity of standard phantoms which simulate average or maximum tissue conductivity. Importantly, the on-coil current-source amplifier, as opposed to a conventional 50 Ω voltage-source amplifier, was designed for a load of just few ohms (1–10 Ω)18 and the selected conductivity value represented a reasonable loading for the specified loop dimension and phantom spacer distance. Using an array with higher number of smaller loops, as it will be necessary for real applications, will allow the use of higher conductivity phantoms while keeping the loading to the amplifier small, such as the FET drain voltage is minimized for a given output current. Additionally, heat convection was not reduced through a gelled solution, this also contributed to have less heating than in other related works.2,6,29
Finally, parallel transmit excitation has been broadly proposed for B1-shimming and SAR reduction applications at high field. We have shown here further data that support the use of a pTX system at clinical field strengths. We exploited our current-source transmitter to have a direct control on the amplitude and phase of the current/B1 in each element and minimized the effect of E-field coupling to a straight wire located in the scanner z-direction. By using a higher order TX array, we could also control E-field coupling to devices that have more complex trajectories in space as a curved guidewire setup, pacemaker, or deep brain stimulators leads.
ACKNOWLEDGMENTS
The authors would like to acknowledge Siemens Healthcare for its financial support. The author would also like to thank Jeffrey Duerk, Kenneth Loparo, Robert Brown, Xin Yu, Peter Kellman, and Peter Van Gelderen for their important feedback. To Katherine Lucas, Victor Wright, Majdi Halabi, Bill Schenke, and Toby Rogers for their assistance during animal experiments. Finally, to the LFMI, NIH research group for their help and constant support.
REFERENCES
- 1.Barbash I. M.et al. , “Direct percutaneous left ventricular access and port closure: Pre-clinical feasibility,” JACC: Cardiovasc. Interventions 4(12), 1318–1325 (2011). 10.1016/j.jcin.2011.07.017 [DOI] [PMC free article] [PubMed] [Google Scholar]
- 2.Konings M. K., Bartels L. W., Smits H. F., and Bakker C. J., “Heating around intravascular guidewires by resonating RF waves,” J. Magn. Reson. Imaging 12(1), 79–85 (2000). 10.1002/1522-2586(200007)12:13.0.CO;2-T [DOI] [PubMed] [Google Scholar]
- 3.Liu C. Y., Farahani K., Lu D. S., Duckwiler G., and Oppelt A., “Safety of MRI-guided endovascular guidewire applications,” J. Magn. Reson. Imaging 12(1), 75–78 (2000). 10.1002/1522-2586(200007)12:13.0.CO;2-# [DOI] [PubMed] [Google Scholar]
- 4.Yeung C. J., Susil R. C., and Atalar E., “RF safety of wires in interventional MRI: Using a safety index,” Magn. Reson. Med. 47(1), 187–193 (2002). 10.1002/mrm.10037 [DOI] [PubMed] [Google Scholar]
- 5.Yeung C. J., Susil R. C., and Atalar E., “RF heating due to conductive wires during MRI depends on the phase distribution of the transmit field,” Magn. Reson. Med. 48(6), 1096–1098 (2002). 10.1002/mrm.10310 [DOI] [PubMed] [Google Scholar]
- 6.Park S. M., Kamondetdacha R., Amjad A., and Nyenhuis J. A., “MRI safety: RF-induced heating near straight wires,” IEEE Trans. Magn. 41(10), 4197–4199 (2005). 10.1109/TMAG.2005.854803 [DOI] [Google Scholar]
- 7.Nordbeck P.et al. , “Spatial distribution of RF-induced E-fields and implant heating in MRI,” Magn. Reson. Med. 60(2), 312–319 (2008). 10.1002/mrm.21475 [DOI] [PubMed] [Google Scholar]
- 8.Martin A. J., Baek B., Acevedo-Bolton G., Higashida R. T., Comstock J., and Saloner D. A., “MR imaging during endovascular procedures: An evaluation of the potential for catheter heating,” Magn. Reson. Med. 61(1), 45–53 (2009). 10.1002/mrm.21817 [DOI] [PubMed] [Google Scholar]
- 9.ASTM F2182 -09 Standard Test Method for Measurement of Radio Frequency Induced Heating Near Passive Implants During Magnetic Resonance Imaging.
- 10.Park S.-M., Kamondetdacha R., and Nyenhuis J. A., “Calculation of MRI-induced heating of an implanted medical lead wire with an electric field transfer function,” J. Magn. Reson. Imaging 26(5), 1278–1285 (2007). 10.1002/jmri.21159 [DOI] [PubMed] [Google Scholar]
- 11.Sonmez M., Saikus C. E., Bell J. A., Franson D. N., Halabi M., Faranesh A. Z., Ozturk C., Lederman R. J., and Kocaturk O., “MRI active guidewire with an embedded temperature probe and providing a distinct tip signal to enhance clinical safety,” J. Cardiovasc. Magn. Reson. 14, 38 (2012). 10.1186/1532-429X-14-38 [DOI] [PMC free article] [PubMed] [Google Scholar]
- 12.Krueger S., Schmitz S., Weiss S., Wirtz D., Linssen M., Schade H., Kraemer N., Spuentrup E., Krombach G., and Buecker A., “An MR guidewire based on micropultruded fiber-reinforced material,” Magn. Reson. Med. 60(5), 1190–1196 (2008). 10.1002/mrm.21743 [DOI] [PubMed] [Google Scholar]
- 13.Bell J. A., Saikus C. E., Ratnayaka K., Wu V., Sonmez M., Faranesh A. Z., Colyer J. H., Lederman R. J., and Kocaturk O., “A deflectable guiding catheter for real-time MRI-guided interventions,” J. Magn. Reson. Imaging 35(4), 908–915 (2012). 10.1002/jmri.23520 [DOI] [PMC free article] [PubMed] [Google Scholar]
- 14.Ladd M. E. and Quick H. H., “Reduction of resonant RF heating in intravascular catheters using coaxial chokes,” Magn. Reson. Med. 43(4), 615–619 (2000). 10.1002/(SICI)1522-2594(200004)43:43.0.CO;2-B [DOI] [PubMed] [Google Scholar]
- 15.Etezadi-Amoli M., Stang P., Zanchi M. G., Pauly J. M., Scott G. C., and Kerr A. B., “Controlling induced currents in guidewires using parallel transmit,” in Proceedings of the 18th ISMRM Meeting (International Society for Magnetic Resonance in Medicine, Stockholm, Sweden, 2010), p. 777. [Google Scholar]
- 16.Eryaman Y., Turk E. A., Oto C., Algin O., and Atalar E., “Reduction of the radiofrequency heating of metallic devices using a dual-drive birdcage coil,” Magn. Reson. Med. 69(3), 845–852 (2013). 10.1002/mrm.24316 [DOI] [PubMed] [Google Scholar]
- 17.Eryaman Y., Guerin B., Akgun C., Herraiz J. L., Martin A., Torrado-Carvajal A., Malpica N., Hernandez-Tamames J. A., Schiavi E., Adalsteinsson E., and Wald L. L., “Parallel transmit pulse design for patients with deep brain stimulation implants,” Magn. Reson. Med. (2014) (E-pub ahead of print). 10.1002/mrm.25324 [DOI] [PMC free article] [PubMed] [Google Scholar]
- 18.Gudino N., Heilman J. A., Riffe M. J., Heid O., Vester M., and Griswold M. A., “On-coil multiple channel transmit system based on class-D amplification and pre-amplification with current amplitude feedback,” Magn. Reson. Med. 70(1), 276–289 (2013). 10.1002/mrm.24462 [DOI] [PMC free article] [PubMed] [Google Scholar]
- 19.Gudino N. and Griswold M. A., “Multi-turn transmit coil to increase efficiency in current source amplification,” Magn. Reson. Med. 69(4), 1180–1185 (2013). 10.1002/mrm.24612 [DOI] [PMC free article] [PubMed] [Google Scholar]
- 20.Orfanidis S. J., Electromagnetic Waves and Antennas (Rutgers University, NJ, 2002), Chap. 20, http://www.ece.rutgers.edu/~orfanidi/ewa/. [Google Scholar]
- 21.Shellock F. G., Magnetic Resonance Procedures: Health Effects and Safety (CRC, Boca Raton, 2001). [Google Scholar]
- 22.Heilman J. A., “Muli-dimensional excitation in magnetic resonance imaging for homogeneity correction in the presence of dielectric media,” Thesis (Case Western Reserve University, 2009). [Google Scholar]
- 23.Kurpad K. N., Wright S. M., and Boskamp E. B., “RF current element design for independent control of current amplitude and phase in transmit phased arrays,” Concepts Magn. Reson. 29B, 75–83 (2006). 10.1002/cmr.b.20059 [DOI] [Google Scholar]
- 24.Insko E. K. and Bolinger L., “Mapping of the radiofrequency field,” J. Magn. Reson., Ser. A 103(1), 82–85 (1993). 10.1006/jmra.1993.1133 [DOI] [Google Scholar]
- 25.van den Bosch M. R., Moerland M. A., Lagendijk J. J., Bartels L. W., and van den Berg C. A., “New method to monitor RF safety in MRI-guided interventions based on RF induced image artefacts,” Med. Phys. 37(2), 814–821 (2010). 10.1118/1.3298006 [DOI] [PubMed] [Google Scholar]
- 26.Ellenor C. W., Stang P. P., Etezadi-Amoli M., Pauly J. M., and Scott G. C., “Offline impedance measurements for detection and mitigation of dangerous implant interactions: An RF safety prescreen,” Magn. Reson. Med. (2014) (E-pub ahead of print). 10.1002/mrm.25202 [DOI] [PMC free article] [PubMed] [Google Scholar]
- 27.Graesslin I., Krueger S., and Vernickel P., “Detection of RF unsafe devices using a parallel transmission MR system,” Magn. Reson. Med. 70(5), 1440–1449 (2013). 10.1002/mrm.24558 [DOI] [PubMed] [Google Scholar]
- 28.El-Sharkawy A. M., Qian D., Bottomley P. A., and Edelstein W. A., “A multichannel real-time MRI RF power monitor for independent SAR determination,” Med. Phys. 39(5), 2334–2341 (2012). 10.1118/1.3700169 [DOI] [PMC free article] [PubMed] [Google Scholar]
- 29.Park S. M.et al. , “Gelled versus nongelled phantom material for measurement of MRI-induced temperature increases with bioimplants,” IEEE Trans. Magn. 39(5), 3367–3371 (2003). 10.1109/TMAG.2003.816259 [DOI] [Google Scholar]


