

Abstract
Emotions of fear and disgust are related to core symptoms of depression. The neurobiological mechanisms of these associations are poorly understood. This functional magnetic resonance imaging study aimed at examining the Blood oxygenation level dependent (BOLD) response to facial expressions of fear and disgust in patients with major depressive disorder.
Nine patients in an episode of major depression and nine healthy controls underwent two functional magnetic resonance imaging experiments where they judged the gender of facial identities displaying different degrees (mild, strong) of fear or disgust, intermixed with non-emotional faces.
Compared with healthy controls, patients with depression demonstrated greater activation in left insula, left orbito-frontal gyrus, left middle/inferior temporal gyrus, and right middle/inferior temporal gyrus to expressions of strong disgust. Depressed patients also demonstrated reduced activation in left inferior parietal lobe to mildly fearful faces.
Enhanced activation to facial expressions of disgust may reflect an emotion processing bias that suggests high relevance of emotion of disgust to depression.
Keywords: Depression, fMRI, Fear, Disgust
1. Introduction
Negative biases during facial affect processing in major depressive disorder (MDD) have been reported frequently in previous studies. In particular, findings indicate that depressed patients recognise significantly more sadness in facial expressions compared with healthy volunteers (Bouhuys et al., 1999; Gur et al., 1992) or perceive positive emotional faces as less positive (Surguladze et al., 2004). Depressed individuals may also have greater direction of attention towards negative facial expressions (Gotlib et al., 2004) or away from happy facial expressions (Suslow et al., 2001).
Functional neuroimaging studies examining negative, mood-congruent attentional biases in depression have demonstrated in depressed individuals patterns of abnormally increased activity in limbic-subcortical and extrastriate visual object processing regions in response to sad and abnormally decreased activity in these regions in response to happy facial expressions (Surguladze et al., 2005; Fu et al., 2007). There are discrepant findings, however, regarding the nature of subcortical limbic regional activation in response to fearful faces in depressed individuals. One study (Lawrence et al., 2004) demonstrated reduced activation in right amygdala/hippocampus and in right parahippocampal gyrus relative to healthy controls during implicit processing of mild and strong fearful expressions, respectively, while earlier findings (Sheline et al., 2001) had demonstrated increased amygdala activity in response to masked fearful facial expressions in depressed patients relative to healthy controls. A recent study showed no significant difference in amygdala activity to fearful faces in depressed individuals relative to healthy controls (Almeida et al., in press).
Although disgust is an important negative emotion (Ekman, 1992), its role in depression has been largely unrecognised. The experience of disgust may be associated not only with food but also with social interactions, and, in some cases could be directed to one’s self. These social and self-related aspects of disgust are especially relevant to depression. In particular, since the facial expressions of disgust may convey social rejection (Rozin et al., 1994; Marzillier and Davey, 2004), increased sensitivity to disgust (expressed by others) may be characteristic to depression. Indeed, there have been reports demonstrating that the processing of facial expressions of disgust is enhanced in people with depression. Hayward et al. (2005) observed enhanced recognition of facial expressions of disgust in a recovered depressed sample compared with healthy control subjects. Acute tryptophan depletion (ATD) in remitted patients with a history of major depressive disorder (a procedure previously shown to induce transient depressed mood in such individuals) was associated with decreased recognition of expressions of fear, but faster recognition of disgust (Merens et al., 2008). There have also been findings of no difference between depressed individuals and controls with regard to labelling the facial expressions of disgust (Bediou et al., 2005).
Regarding self-directed disgust, some authors (Power and Dalgleish, 1997) argued that the commonly experienced secondary emotions of shame and guilt in depression are derived from the basic emotion of disgust, and that depression may in part depend on a coupling of sadness and self-disgust. This proposal was supported in a study (Power and Tarsia, 2007) found that the emotion of disgust was experienced significantly more by individuals with depression, anxiety or with comorbid anxiety and depression – compared with healthy controls. Another study (Overton et al., 2008) provided direct evidence that self-disgust (as measured by the newly developed Self-Disgust Scale) played an important role in depression by mediating the relationship between dysfunctional cognitions and depressive symptomatology. It should be noted however that the questionnaire-based study of disgust sensitivity (Schienle et al., 2003) did not find any elevation in disgust sensitivity in patients with depression – in contrast to those with schizophrenia and OCD. The authors suggested that whereas the questionnaire tapped on the disgust directed to external stimuli, the crucial feelings for depression would be self-disgust, shame and guilt which were not covered by the questionnaire.
The neurobiology of processing of facial expressions of disgust is well established and has been shown to involve the insula, striatum, inferior frontal cortex, in addition to visual object processing regions such as extrastriate and inferior temporal cortices (Calder et al., 2000; Phillips et al., 1997). There has been little research that has examined the extent to which abnormalities in neural systems implicated in disgust perception are associated with depression. The only study of this kind published so far (McCabe et al., 2009) showed that the unmedicated individuals recovered from depression had an increased activity in bilateral caudate in response to the disgust-eliciting pictures of mouldy food. We were interested in social dimensions of the emotion of disgust in people with depression. Therefore in the present study we examined patterns of neural activation to facial expressions of disgust and fear in currently depressed individuals with a history of MDD. The emotional expressions of fear were included in the study to provide additional emotionally negative stimuli which may help to differentiate the neural responses specific for the processing of disgust. Based on the close associations between disgust and depression, we hypothesized that depressed patients would show greater activity in visual object processing and limbic regions to facial expressions of disgust than healthy controls, but that activity in these regions to facial expressions of fear would be less likely to distinguish the two groups.
2. Materials and methods
2.1. Participants
Nine individuals with DSM-IV primary diagnosis of Major Depressive Disorder were recruited from the hospital and community services of the South London and Maudsley National Health Service Trust. None of them had diagnosable comorbidity in terms of other Axis I disorders.
Nine healthy individuals without a history of major depressive disorder or other psychiatric history, determined by interview, were recruited from the local community and ancillary staff of the Institute of Psychiatry.
Ethical approval was obtained from the Ethical Committee of the South London and Maudsley Trust and the Institute of Psychiatry. Written consent was obtained from all subjects prior to participation in the study. All participants were right-handed (Oldfield, 1971). Both groups were matched for age, sex ratio, and years of education. There was no significant difference between depressed group and controls in age of male (t[9] = 1.7; p = .2), or female subjects (t[7] = .3; p = .8).
Exclusion criteria included a history of head injury, illicit substance abuse, and a score of less than 24 on the Mini-Mental State Examination (MMSE) (Folstein et al., 1975). Depression severity was measured using the Beck Depression Inventory (BDI, Beck et al., 1986) and the Hamilton Depression Rating Scale (HDRS, Hamilton, 1960). Depressed individuals had significantly higher BDI scores compared with healthy individuals (U = 0, p < .001), ranging from 15 to 50 with mean score 31.8 corresponding to moderate/severe depression (Table 1). There was no evidence for psychotic symptoms experienced by patients either at the time of assessment or in their past. All data on duration of illness in depressed individuals was collected from the medical records and interview with each depressed individual.
Table 1.
Socio-demographic and clinical characteristics and on-line performance data.
| MDD patients (n = 9) |
Control subjects (n = 9) |
|
|---|---|---|
| Female/Male ratio | 4/5 | 4/5 |
| Age, years | 42.8 ± 7.2 | 39.7 ± 14.6 |
| Education, years | 13.4 ± 2.4 | 13.6 ± 1.7 |
| Duration of illness, years | 8.0 ± 5.1 | – |
| Mini-Mental State Examination | 28.7 ± 1.7 | 30 ± 0 |
| Beck Depression Inventory** | 31.8 ± 11.8 | 2.8 ± 3.8 |
| Hamilton Depression Rating Scale | 17.7 ± 5.5 | – |
| Correct responses for gender decision in disgust task | 47.2 ± 9.5 | 48.6 ± 7.6 |
| Reaction time to 50% disgust faces, sec. | 1.17 ± .31 | .97 ± .26 |
| Reaction time to 100% disgust faces, sec. | 1.17 ± .26 | 1.0 ± .26 |
| Correct responses for gender decision in fear task | 49.2 ± 7.4 | 49.5 ± 7.6 |
| Reaction time to 50% fearful faces, sec. | 1.1 ± .22 | 1.0 ± .24 |
| Reaction time to 100% fearful faces, sec. | 1.2 ± .33 | 1.0 ± .25 |
p < .01.
Values shown are means ± SD.
All patients were taking antidepressant medication. Four of them were taking the serotonin and noradrenaline re-uptake inhibitor venlafaxine; three, selective serotonin re-uptake inhibitors (sertraline and paroxetine); one patient was taking the MAO inhibitor phenelzine; and one, the tricyclic antidepressant dothiepine. Two patients were additionally treated with Lithium; one, with diazepam; and one, with promethazine. As in our previous study (Surguladze et al., 2005), for the purposes of further analysis medication dose was coded from 1 (low-dose) to 4 (high-dose), and the group of patients was divided into two subgroups depending on medication dose: 5 patients comprised medium-high dosage subgroup (levels 3–4) and 4 patients comprised low dosage subgroup (levels 1–2).
2.2. Functional neuroimaging task
All subjects participated in two 6-min experiments employing event-related functional magnetic resonance imaging (fMRI). In one of the experiments participants were presented with photographs of expressions of disgust and emotionally neutral faces, in another experiment, fearful and neutral faces from a standardised series (Young et al., 2002). The order of these tasks was counterbalanced across participants. The photographs depicted 10 individuals (4 male, 6 female) devoid of any gender- specific details (e.g., moustache, long hair). The prototypical expressions of disgust and fear were manipulated by morphing software to depict expressions of mild (50%) intensity along the continuum between neutral and prototypical (100%) expressions. Thus, in each experiment, participants viewed 20 expressions of prototypical (100%) emotion, 20 expressions of mild (50%) emotion and 20 neutral expressions. Each facial stimulus was presented for 2 s. All stimuli were presented in a pseudo-randomized order, and additional effort was made to ensure that there was no immediate repetition of the same facial expression. The duration of the inter-stimulus interval (ISI) varied from 3 to 8 s according to a Poisson distribution to prevent participants from predicting the timing of the next stimulus presentation, with average ISI, 4.9 s. During the ISI, participants viewed a fixation cross. In subsequent analyses, the fixation cross was used as the baseline stimulus. In the current study, participants decided on the gender of each face and pressed one of two buttons accordingly. These responses, as well as reaction times, were recorded. The order of the stimuli in each task was fixed. The details of the paradigm are presented elsewhere (Surguladze et al., 2003).
2.3. Off-line facial affect recognition task
After the neuroimaging scan, the participants were examined with regard to accuracy of facial expression labelling. In this task, participants viewed on a computer screen expressions of disgust or fear interspersed with emotionally neutral faces from a standardised set (Young et al., 2002). Each facial emotion had two different intensities (50% and 100%), and each was presented twice during the task: for 100 ms and 2000 ms. Ten neutral faces were presented at two durations each: 100 ms and 2000 ms. Participants, therefore, viewed 100 stimuli in total, with an ISI of 1500 ms, during the first 500 ms of which a fixation cross was displayed. Participants were instructed that they would view expressions of disgust, fear or neutral faces and were requested to recognise the emotion by moving a computer joystick according to the labels presented on the computer screen. Before testing, all participants performed a practice trial to ensure they were able to perform the task.
Raw data was transformed into measures of accuracy and response bias similarly to our previous study. High accuracy values indicated an ability to discriminate accurately among emotional and neutral expressions. Higher response bias scores indicated a tendency to misidentify neutral faces as emotional.
2.4. Image acquisition
Magnetic resonance (MR) images were acquired using a GE Signa 1.5T Neuro-optimised MR system (General Electric, Milwaukee, Wisconsin) for gradient echo echoplanar imaging (EPI) at the Maudsley Hospital, London, United Kingdom. A quadrature birdcage headcoil was used for radio frequency (RF) transmission and reception. A gradient echo EPI dataset was acquired at 43 near-axial 3-mm thick planes parallel to the anterior commissure – posterior commissure (AC–PC) line: echo time (TE) 73 ms, time to inversion (TI) 80 ms, repetition time (TR) 3 s, in-plane resolution 1.72 mm, interslice gap .3 mm, matrix size: 128 × 128 pixels. This higher resolution EPI dataset was used to register the fMRI datasets acquired from each individual in standard stereotactic space. One hundred and eighty T2-weighted images depicting blood oxygenation level dependent (BOLD) contrast (Ogawa et al., 1990) were acquired at each of 16 near-axial non-contiguous 7-mm thick planes parallel to the inter-commissural (AC–PC) line: TE 40 ms, TR 2 s, in-plane resolution 3.44 mm, interslice gap .7 mm, matrix size 64 × 64 pixels.
2.5. Neuroimaging data analysis
2.5.1. Analytical approach
Data were analysed using the method XBAM developed at the Institute of Psychiatry and based on permutation testing (Brammer et al., 1997, c.f. http://brainmap.it).
Most assessments of the significance of the model fits commonly used in fMRI analysis are based on normal theory and the validity of the normality assumption is not often tested. The XBAM software makes no such assumptions. Instead, it uses median statistics to control outlier effects and employs permutation rather than normal theory based inference. Furthermore its most common test statistic is computed by standardising for individual difference in residual noise before embarking on second level, multi-subject testing using robust permutation-based methods. This allows a mixed effects approach to analysis. A recent paper by Thirion et al. (2007) has conducted a detailed analysis of the validity and impact of normal theory based inference in fMRI in a large number of subjects (81). They have found substantial deviations from normality in a significant number (22%) of intracerebral voxels using the most common measure of response size (unstandardised beta) used in fMRI analysis. Thirion et al. recommend a mixed effects rather than simple random effects analysis (i.e. an approach in which differences in intra-subject residual error as well as inter-subject variability are specifically included in the analysis). To deal with the issue of nonnormality and its (unknown) effects on parametric hypothesis testing, they recommend permutation-based inference and cluster or parcel level rather than voxel level inference. This supports the approach that has been implemented by the authors of XBAM. Specifically, the statistic used in XBAM consists of the ratio of the sum of squares of deviations from the mean image intensity (over the whole time series) due to the model to the sum of squares of deviations due to the residuals (SSQ ratio). This statistic is used to overcome the problem inherent in the use of the F (variance ratio) statistic, which is that the residual degrees of freedom are often unknown in fMRI time series due to the presence of colored noise in the signal. The computation of a standardised measure of effect, the SSQ ratio, at the individual level, followed by analysis of the median SSQ ratio maps over all individuals treats intra- and inter-subject variations in effect separately, constituting a mixed effect approach to analysis which is deemed desirable in fMRI.
2.5.2. Analytical procedure
Data were first pre-processed (Bullmore et al., 1999a) to minimize motion-related artifacts. A 3D volume consisting of the average intensity at each voxel over the whole experiment was calculated and used as a template. The 3D image volume at each timepoint was then realigned to this template by computing the combination of rotations (around the x, y and z axes) and translations (in x, y and z) that maximised the correlation between the image intensities of the volume in question and the template. Following realignment, data were then smoothed using a Gaussian filter (FWHM 7.2 in-plane fMRI voxel size mm) to improve the signal to noise characteristics of the images.
Neural responses to faces with neutral and emotional (mild, strong disgust, fear) expressions compared with baseline were determined by time series analysis using gamma variate functions (peak responses at 4 and 8 s) to give the best-fit (least-squares) model of the time series of the BOLD response at each intracerebral voxel. A goodness-of-fit statistic, the sum of squares (SSQ) ratio, was then computed at each voxel. This was the ratio of the sum of squares of deviations from the mean intensity value due to the model (fitted time series) divided by the sum of squares due to the residuals (original time series minus model time series). To sample the distribution of SSQ ratio under the null hypothesis that observed values of SSQ ratio were not determined by experimental design (with minimal assumptions), the time series at each voxel was permuted using a wavelet-based resampling method (Bullmore et al., 1999b). Observed and randomized SSQ ratio maps were transformed into the standard space (Talairach and Tournoux, 1988). First, a group brain activation map (GBAM) was produced for each experimental condition by testing the median observed SSQ ratio over all subjects (median values were used to minimize outlier effects) at each voxel in standard space against a critical value of the permutation distribution for median SSQ ratio ascertained from the spatially transformed wavelet-permuted data. Secondly, the voxel-wise and cluster-wise significance of differences between groups were obtained by analysis of variance (ANOVA) per each emotional experiment (Bullmore et al., 1999b). For each contrast, the significance threshold was set at the level where there was a probability to observe less than half false-positive cluster per whole brain map.
3. Results
3.1. Neuroimaging experiments
3.1.1. Group patterns of neural activity to expressions of disgust
First, within-group patterns of activity to disgust vs. neutral faces were determined. In response to expressions of 50% disgust vs. neutral expressions, healthy controls showed significant activity in right superior frontal gyrus (BA8), right anterior and middle cingulate gyri, bilateral fusiform gyrus (BA37). Patients with depression showed significant activity in left ventrolateral prefrontal cortex (BA 47), left anterior cingulate gyrus (BA32), right precuneus (BA 31), right inferior frontal gyrus (BA44), left insula, left putamen. In response to expressions of 100% disgust vs. neutral expressions, healthy controls showed significant activity in middle/anterior cingulate gyrus (BA32), left medial frontal gyrus (BA6), left posterior cingulate (BA29), bilateral fusiform gyrus (BA37) and bilateral insula.
To the expressions of 100% disgust patients with depression showed significant activity in the medial aspects of superior frontal gyrus (BA8), left orbito-frontal cortex (BA11), bilateral fusiform gyrus (BA37), bilateral insula, left precuneus (BA 7), anterior cingulate gyrus (BA32) (Tables 2 and 3).
Table 2.
Significant clusters of neural activation in response to facial expressions of disgust in healthy controls (n = 9).
| Brain region (BA) | Talairach and Tournoux coordinates
|
||||
|---|---|---|---|---|---|
| x | y | z | Size | p | |
| Disgust (50%) vs. neutral | |||||
| Superior frontal gyrus, medial aspect (BA8) | 14 | 33 | 37 | 10 | .0001 |
| Right anterior cingulate gyrus (BA32) | 6 | 36 | 20 | 54 | .0001 |
| Right middle cingulate gyrus (BA24) | 9 | 33 | 31 | 12 | .0001 |
| Left fusiform gyrus (BA37) | −29 | −42 | −13 | 12 | .001 |
| Right fusiform gyrus (BA37) | 32 | −42 | −18 | 8 | .0006 |
| Disgust (100%) vs. neutral | |||||
| Left anterior/middle cingulate gyrus (BA32) | −12 | 19 | 42 | 20 | .001 |
| Left medial frontal gyrus (BA6) | −3 | 14 | 48 | 8 | .003 |
| Left posterior cingulate gyrus (BA29) | −6 | −42 | 9 | 60 | .001 |
| Left fusiform gyrus (BA37) | −32 | −42 | −18 | 123 | .001 |
| Right fusiform gyrus (BA37) | 32 | −42 | −18 | 43 | .001 |
| Left insula | −46 | −11 | 9 | 2 | .001 |
| Right insula | 38 | 22 | 4 | 2 | .0002 |
Coordinates of regions in which significant within-group differences were demonstrated. Voxel-wise and cluster-wise differences at p = .05 and p = .0008, respectively. Brodmann areas are indicated in parentheses (BA).
Table 3.
Significant clusters of neural activation in response to facial expressions disgust in patients (n = 9).
| Brain region (BA) | Talairach and Tournoux coordinates
|
||||
|---|---|---|---|---|---|
| x | y | z | Size | p | |
| Disgust (50%) vs. neutral | |||||
| Left inferior frontal gyrus (BA47) | −14 | 22 | −18 | 11 | .0007 |
| Right posterior cingulate (BA31) | 9 | −53 | 37 | 20 | .002 |
| Right inferior frontal gyrus (BA44) | 43 | 3 | 31 | 11 | .0005 |
| Left anterior cingulate gyrus (BA32) | −3 | 36 | 26 | 43 | .002 |
| Left insula | −43 | 0 | 4 | 9 | .0003 |
| Left putamen | −26 | 14 | −7 | 7 | .003 |
| Disgust (100%) vs. neutral | |||||
| Left superior frontal gyrus, medial | −17 | 14 | 53 | 27 | .001 |
| aspect (BA8) | |||||
| Orbita-frontal cortex (BA11) | −9 | 42 | −13 | 65 | .0007 |
| Left precuneus (BA7) | −9 | −53 | 48 | 26 | .002 |
| Right anterior cingulate gyrus (BA32) | 0 | 36 | 26 | 16 | .001 |
| Left anterior cingulate gyrus (BA32) | −6 | 42 | 9 | 78 | .00001 |
| Left insula (BA13) | −35 | 0 | 15 | 6 | .0002 |
| Right insula (BA13) | 38 | 17 | −7 | 13 | .0002 |
| Right fusiform gyrus (BA37) | 20 | −39 | −18 | 24 | .002 |
| Left fusiform gyrus (BA37) | −35 | −44 | −18 | 8 | .002 |
Coordinates of regions in which significant within-group differences were demonstrated. Voxel-wise and cluster-wise differences at p = .05 and p = .0008, respectively. Brodmann areas are indicated in parentheses. BA, Brodmann area.
3.1.2. Between-group ANOVA of BOLD response to expressions of disgust
To determine between-group differences in response to expressions of increasing intensity of disgust, the data were analysed with 3 × 2 repeated measures ANOVA with intensity (neutral, 50%, 100%) as within-subject variable and group (patients, controls) as between-subject variable.
The XBAM program allows choice of a set value for the significance of results, controlling for the type I error. The results of the 3 × 2 factorial ANOVA were thresholded at p = .006, which controls for the probability to observe any false-positive clusters per the whole brain. At the significance level p = .006 there was a probability of less than one false-positive cluster to be observed per the whole brain map. This analysis produced two clusters (F [1,48] = 5.7; observed power = .81), indicating group by condition interaction: a) a large cluster of activation spreading across left frontal and temporal regions, including left insula, left orbito-frontal cortex BA47, left middle/inferior temporal gyrus BA21/37, p = .0001 and b) a cluster in right middle/inferior temporal gyrus BA21/BA37, p = .0004 (Table 6; Fig. 1).
Table 6.
Significant between-group differences in neural response to expressions of disgust and fear.
| No. | Brain region, BA | Emotion
|
Areas with significant differences
|
Direction of difference
|
||||
|---|---|---|---|---|---|---|---|---|
| Intensity | x | y | z | Size | Patients | Controls | ||
| 1. | L inferior temporal gyrus, BA37 | 100% D | −51 | 4 | −40 | 131 | Increase | Decrease |
| 2. | L middle temporal gyrus, BA21 | 100% D | −51 | −15 | −13 | 11 | Increase | Decrease |
| 3. | L insula | 100% D | −43 | − 11/−15 | −2/4 | 13 | Increase | Decrease |
| 4. | L orbito-frontal cortex, BA47 | 100% D | −18 | 22 | −24 | 4 | Increase | Decrease |
| 5. | R middle temporal gyrus, BA21 | 100% D | 54 | −4 | −29 | 91 | Increase | Decrease |
| 6. | R inferior temporal gyrus, BA37 | 100% D | 54 | −4/−15 | −24 | 18 | Increase | Decrease |
| 7. | L inferior parietal lobule, BA40 | 50% F | −40 | −26 | 26 | 62 | Decrease | Increase |
The regions in the table represent the components of main clusters produced by the 3 × 2 ANOVAs. Regions 1–4 constitute the large left frontal/temporal cluster with differential response to 100% disgust; regions 5 & 6 constitute right middle/inferior temporal cluster with differential response to 100% disgust; region 7 represents a cluster with differential response to 50% fear. BA, Brodmann area; D – disgust; F – fear.
Fig. 1.
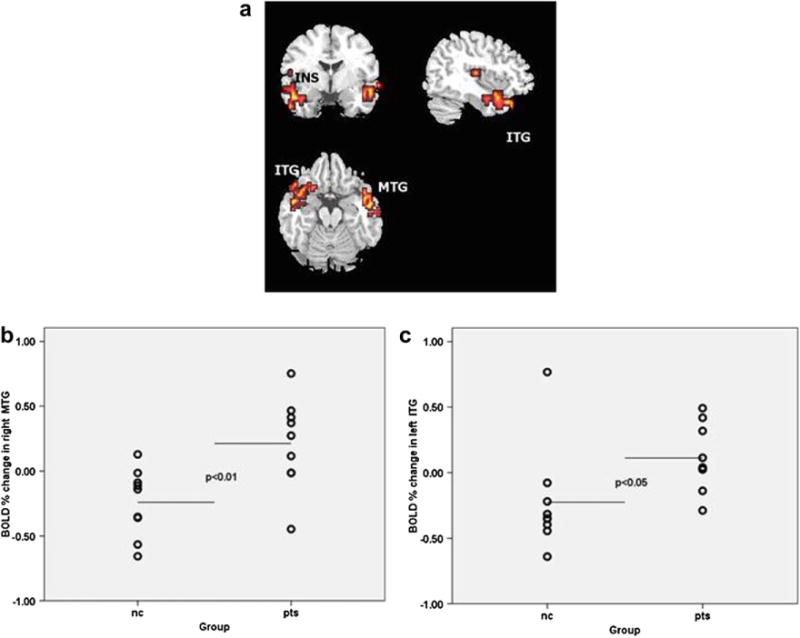
Between-group differences in BOLD response to disgust. a. Axial, coronal and sagittal images depicting increased neural responses in patients with depression in response to prototypical (100%) intensity of disgust. The right and the left sides of each brain slice are displayed on the right and left sides of each image, respectively. BA, Brodmann area. MTG: middle temporal gyrus; ITG: inferior temporal gyrus; INS: insula. b. Scatter plot of neural response values (expressed as % signal change) extracted from the significant cluster in right middle/inferior temporal gyrus. Horizontal lines indicate means. c. Scatter plot of neural response values (expressed as % signal change) extracted from the significant cluster including left insula, left orbito-frontal cortex, left middle/inferior temporal gyrus. Horizontal lines indicate means. nc: normal controls; pts: patients with depression.
The between-group tests demonstrated that the interaction was accounted for by depressed patients showing greater activity than healthy controls to expressions of 100% intensity of disgust within both left fronto-temporal and the right middle/inferior temporal regions (U =12, p = .012, and U = 11, p = .009, respectively).
3.1.3. On-line gender labelling performance in the disgust task
There were no significant between-group differences in correct responses (U = 32.5, p = .73) and reaction time in the gender decision tasks for neutral (U = 18, p = .08), 50% disgust (U = 21.5, p = .16) and 100% disgust (U = 23, p = .21) conditions.
3.1.4. Group patterns of neural activity to expressions of fear
Within-group activation patterns demonstrated the following. In response to expressions of 50% fear vs. neutral, healthy controls showed significant activation in left inferior parietal gyrus (BA40), right inferior temporal gyrus (BA20), left cerebellum and left inferior occipital gyrus (BA18), medial frontal lobe (BA32), and left hippocampus. To the fearful expressions of the same intensity, depressed individuals showed significant activation in right cerebellum and right lingual gurus (BA19), left posterior cingulate gyrus (BA23) and left angular gyrus (BA39).
In response to 100% fearful expressions vs. neutral, healthy controls showed significant activation in left inferior posterior temporal cortex (BA37), left and right cerebellum, left and right fusiform gyri (BA19/37), left precuneus (BA 7), left and right inferior parietal lobule (BA40), left amygdala, and right hippocampus. Patients with depression activated left and right supramarginal gyri (BA40), left and right cerebellum, medial frontal cortex (BA32) and posterior cingulate gyrus (BA31) (Tables 4 and 5).
Table 4.
Significant clusters of neural activation in response to fearful facial expressions in healthy controls (n = 9).
| Brain region (BA) | Talairach and Tournoux coordinates
|
||||
|---|---|---|---|---|---|
| x | y | z | Size | p | |
| Fear (50%) vs. neutral | |||||
| Left inferior parietal gyrus (BA40) | −43 | −33 | 48 | 20 | .00006 |
| Right inferior temporal gyrus (BA20) | 36 | −43 | −18 | 16 | .001 |
| Left cerebellum | −21 | −60 | −18 | 14 | .001 |
| Medial frontal lobe (BA32) | 0 | 39 | 9 | 9 | .00007 |
| Left inferior occipital gyrus (BA18) | −32 | −86 | −7 | 9 | .00006 |
| Left hippocampus | −32 | −20 | −7 | 2 | .001 |
| Fear (100%) vs. neutral | |||||
| Left inferior temporal lobe (BA37) | −47 | −50 | −18 | 100 | .001 |
| Right fusiform gyrus (BA37) | 32 | −46 | −18 | 46 | .002 |
| Left fusiform gyrus (BA19) | −36 | −63 | −7 | 29 | .0005 |
| Left cerebellum | −7 | −52 | −13 | 28 | .002 |
| Right cerebellum | 32 | −50 | −24 | 36 | .00004 |
| Left precuneus (BA7) | −25 | −43 | 53 | 13 | .0005 |
| Left amygdala | −15 | −7 | −13 | 4 | .002 |
| Right hippocampus | 32 | −43 | −2 | 3 | .002 |
Coordinates of regions in which significant within-group differences were demonstrated. Voxel-wise and cluster-wise differences at p = .05 and p = .003, respectively. Brodmann areas are indicated in parentheses. BA, Brodmann area.
Table 5.
Significant clusters of neural activation in response to fearful facial expressions in patients (n = 9).
| Brain region (BA) | Talairach and Tournoux coordinates
|
||||
|---|---|---|---|---|---|
| x | y | z | Size | p | |
| Fear (50%) vs. neutral | |||||
| Right cerebellum | 25 | −69 | −35 | 9 | .001 |
| Posterior cingulate gyrus (BA23) | −11 | −56 | 9 | 8 | .001 |
| Left angular gyrus (BA39) | −36 | −67 | 26 | 5 | .0001 |
| Right lingual gyrus (BA19) | 15 | −60 | −2 | 4 | .003 |
| Fear (100%) vs. neutral | |||||
| Right supramarginal gyrus (BA40) | 50 | −43 | 31 | 20 | .002 |
| Left supramarginal gyrus (BA40) | −47 | −26 | 26 | 14 | .0006 |
| Right cerebellum | 40 | −63 | −24 | 12 | .002 |
| Left cerebellum | −21 | −52 | −24 | 11 | .001 |
| Medial frontal lobe (BA32) | −11 | 39 | 20 | 10 | .001 |
| Posterior cingulate gyrus (BA31) | 28 | −63 | 26 | 6 | .002 |
Coordinates of regions in which significant within-group differences were demonstrated. Voxel-wise and cluster-wise differences at p = .05 and p = .003, respectively. Brodmann areas are indicated in parentheses. BA, Brodmann area.
3.1.5. Between-group ANOVA of BOLD response to the expressions of fear
To determine the between-group difference in linear trends, we performed 3 × 2 repeated measures ANOVA with intensity (neutral, 50%, 100%) as within-subject variable and group (patients, controls) as between-subject variable. The analysis produced a significant cluster in the left inferior parietal lobule (BA40).
Between-group tests demonstrated that the differential pattern of activation in this cluster was accounted for by depressed patients having less activation than healthy controls in response to 50% intensity of fear (U = 18, p = .04) (Table 6 and Fig. 2). Examination of the trends of activation per emotional condition showed that whereas there was a drop in parietal cortex activity to 50% fear in depressed people, the activity levels in other conditions i.e. neutral and 100% fear were at the same level as in controls.
Fig. 2.
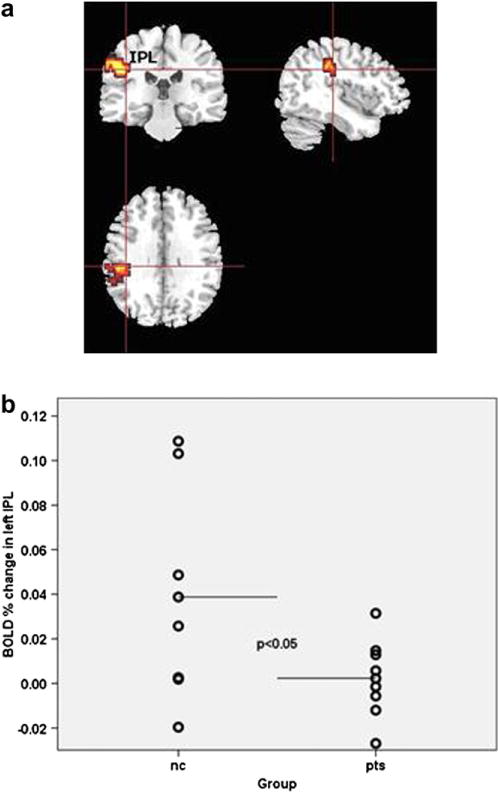
Between-group differences in BOLD response to fear. a axial, coronal and sagittal images depicting decrease in neural response to 50% fear in patients with depression in left inferior parietal lobule BA 40 (x = −40, y = −26, z = 26). The right and the left sides of each brain slice are displayed on the right and left sides of each image, respectively. BA, Brodmann area. IPL: inferior parietal lobule. b. scatter plot of neural response values (expressed as % signal change) extracted from the significant cluster in left inferior parietal lobule. Horizontal lines indicate means; nc: normal controls; pts: patients with depression.
3.1.6. On-line gender labelling performance in fear task
There were no significant between-group differences in correct responses (U = 27, p = .43) and reaction time in the gender decision tasks for neutral (U = 28, p = .23), 50% fearful (U = 30.5, p = .60) and 100% fearful (U = 13, p = .30) expressions.
3.2. Off-line facial affect recognition task
During the fMRI experiment the stimuli were presented for 2000 ms, therefore the off-line behavioural task results were analysed with regard to this particular stimuli duration.
Values of discrimination accuracy (Pr) were entered into 2 × 2 × 2 repeated measures analysis of variance (ANOVA) with intensity (50%, 100%), and emotion (fear, disgust) as within-subject factors, and group (patients, controls) as the between-subject factor. There were significant main effects of intensity (F[1, 54] = 169.2, p < .001), emotion (F[1,54] = 30.5, p < .001), but no significant effect of group and no significant interactions. Comparison of the mean values for discrimination accuracy indicated that in both groups, the significant main effect of intensity was the result of disgust and fear expressions with higher intensity being recognised more accurately than those with lower intensity (t[55] = 13.1; p < .001). The main effect of emotion was accounted for by the emotion of disgust being recognised more accurately compared with the emotion of fear across all participants (t[55] = 5.6; p < .001). Response bias data were entered into a 2 × 2 repeated measures ANOVA with stimuli emotion (fear, disgust) as within-subject variables and group (patients, controls) as the between-subject variable. There were no significant main effects or interactions, in other words, patients and controls had equal tendency to label expressions as fear, disgust or neutral in the situation of uncertainty.
3.3. Medication effects
We examined the potential effects of antidepressant medication on the above findings of between-group differences in BOLD response to 100% disgust faces and 50% fearful faces. There was no significant difference in activity between low-dose vs. high-dose subgroups during processing of expressions of disgust: in right middle temporal gyrus U = 9.0, p = .81; left inferior temporal gyrus: U = 4.1, p = .14; or fear: left inferior parietal lobule U = 4.0; p = .2.
4. Discussion
There has been a growth in the number of studies of disgust in various psychiatric conditions over the last 10 years (Olatunji and McKay, 2007), so that disgust is not a “forgotten emotion of psychiatry” (Phillips et al., 1998) any more. There has been less interest, however, in the role of disgust in neurobiology of depression. Our study shows that the emotion of disgust has high relevance to depression.
In particular, we found that our patients with major depressive disorder differentially activated areas of frontal, parietal and temporal cortex in response to the expressions of disgust and fear. Attending to prototypical expression of disgust, patients had greater activation than healthy controls in right middle temporal gyrus and left inferior temporal gyrus extending to left middle temporal gyrus, orbito-frontal cortex and insula. Importantly, this pattern of differential activation was not related to any differences in behavioural performance: patients with depression did not differ from the controls with regard to on-line (gender decision) or offline (emotion recognition) task performance. The latter results replicate previous findings (Bediou et al., 2005) who also reported comparable performance in recognition of disgust in depressed individuals and healthy controls.
The insula and left inferior frontal cortex have been strongly implicated in the perception and recognition of facial expressions of disgust in others (Phillips et al., 1997; Sprengelmeyer et al., 1998). The insula is also involved in self-referential processing – both of own faces and the self-description words (Kircher et al., 2000). The studies of patients with lesioned insula indicate close connection between experience and the recognition of emotion of disgust (Calder et al., 2000; Adolphs et al., 2003). We suggest that over-activation of insula in our patients may underlie elevated susceptibility to experiencing the emotion of disgust. Moreover, due to close links between the expression of disgust in others and signals of rejection (Rozin et al., 1994), an enhanced brain response in depressed individuals to expressions of disgust may reinforce feelings of interpersonal rejection and adversely affect social relationships. On a behavioural level it is known that depression is associated with impairments in various aspects of interpersonal functioning, e.g., interpersonal problem-solving performance (Gotlib and Asarnow, 1979), social competence (Fisher-Beckfield and McFall, 1982), or marital interactions (Gotlib and Whiffen, 1989). In remitted patients with depression, disturbed relationships with less attunement and mutual involvement are predictive of the relapse (Bos et al., 2002). We emphasize, however, that in our fMRI experiments participants were processing the expressions of disgust implicitly and we could not establish how relevant this emotion was for them in their everyday functioning. This aspect warrants further research.
Conventionally, the middle temporal gyrus has been regarded as a structure involved in language/semantic processing (Fiebach et al., 2007; Tyler et al., 2003). However, Iidaka et al. (2001) found that the right middle temporal gyrus was one of the areas specifically associated with implicit (gender decision) processing of angry and disgusted facial expressions compared with neutral faces, and found to interact with activity in right amygdala and hippocampus. Interestingly, an earlier study (Critchley et al., 2000) reported activation in left middle temporal cortex during an explicit emotional face labelling task. Thus, left and right middle temporal cortex may differentially respond to facial emotions – depending on the experimental task.
The involvement of the middle and inferior temporal gyri in emotional processing in the present study is supported by anatomical data indicating that the posterior temporal cortex receives input from visual sensory cortices (Ungerleider and Haxby, 1994), and direct back projections from amygdala (Amaral, 2002).
We emphasize that these results reflect between-group differences in linear trends of activation. Whereas in the simple within-group contrasts (emotion vs. neutral) both patients and control groups demonstrated activation typical for disgust processing (e.g., in bilateral fusiform areas, insula, inferior frontal cortex), the between-group difference of trends involved some other regions of differential activity. This may mean that the groups differed not simply in terms of greater/smaller activation in the typical emotional circuits, but rather in activation of some other brain regions – which may have reflected a different strategy in emotion processing. Importantly, however, these areas of differential activation extended to regions implicated in emotion processing – i.e. the insula and left inferior frontal cortex (Sprengelmeyer et al., 1998).
In the fearful face processing task, patients showed reduced neural activity in left inferior parietal cortex in response to mild fear. The inferior parietal cortex, especially, right-sided inferior parietal cortex (Adolphs et al., 1996), is implicated in visual-spatial attention. There have been however indications that the attention to facial emotions is modulated by a wider network involving bilateral parietal regions (Zhou et al., 2005; Feinstein et al., 2002).
Examination of the pattern of activation per group and emotional condition showed that in depressed individuals there was a drop in parietal cortex response to 50% fear, whereas in other conditions i.e. in response to neutral faces and 100% fear, the activation was at the same level as in controls. We suggest that this lack of activity in left parietal cortex towards mildly fearful faces may represent reduced attention to these stimuli in depressed individuals. A possible basis for this differential activation could lie in differential habituation of spatial attention network (Feinstein et al., 2002). Another interpretation might be based on the effect of antidepressant medication which is known to reduce the identification of the negative facial expressions of anger and fear (Harmer et al., 2004). We are confident that our results were not confounded by the abnormal performance in fear recognition, since there was no difference between patients and controls in the fear recognition task off-line. However, we cannot completely rule out the medication effect in implicit (on-line) task. Further studies of medication-naïve patients are required to clarify this effect.
Unlike our findings, previous studies demonstrated increased amygdala activity to masked fearful (Sheline et al., 2001) or angry (Dannlowski et al., 2007) faces in depressed patients. We suggest that the discrepancy between these findings and our study may be due to the different analytical approaches: the previous studies employed a region of interest (ROI) approach where the amygdala was specifically targeted as a region of interest, whereas we used a whole brain between-group analysis of trends with three levels of emotion intensity (neutral, mild, prototypical). Our analysis therefore resulted in large clusters of differential activation that were characteristic for each group, per emotion intensity.
Our results suggest an effect of negative emotional expression type upon patterns of abnormal neural activity in depressed patients. Regions differentially activated in this study to fearful and disgusted faces in depressed patients were different from those regions that were differentially activated in our larger group of depressed patients in response to sad and happy faces (Surguladze et al., 2005). In this previous study, depressed patients, relative to controls showed significantly greater activity within left para-hippocampal gyrus/amygdala, left putamen and areas of right occipital/fusiform cortex to sad faces, and reduced activity within right putamen and bilateral fusiform gyrus to happy faces. In the present study, depressed patients showed significantly greater medial temporal, orbito-frontal cortical and insular activity to facial expressions of prototypical disgust, but significantly reduced activity to mild fearful facial expressions in the left inferior parietal cortex.
We suggest that the finding of differential increase in insula activity to disgust in depressed patients adds to the knowledge of neurobiological substrates underlying depressive disorder. This paves the way to future studies that could test a hypothesis of a link between the increased insula activity and feelings of self-disgust in depression.
Considering possible confounders, it is possible that differences in neural activity observed between depressed patients and healthy controls were secondary to differences in task performance. Indeed, the recent study of depressed primary care patients (Tranter et al., 2009) demonstrated increases in recognition accuracy of facial expressions of disgust, happiness and surprise occurred during the treatment with citalopram and reboxetine. The study lacked a control group, however, and therefore it is impossible to determine whether the improvement in facial expression recognition reflected better-than normal performance in the depressed group or a normalization of expression recognition accuracy. We were able to examine participants’ performance in both on-line (gender decision) and off-line (emotion recognition) tasks. There were no between-group differences in on-line gender labelling performance. With regard to the recognition accuracy of disgust and fear, our off-line experiments again showed that the patients performed at levels comparable to those of controls. In other words, our participant groups were matched in terms of behavioural performance in all behavioural tasks. Thus, even if there were any putative effect of antidepressants it did not affect the recognition of emotional expressions. On the other hand, we did detect differential patterns of activation in the neuroimaging experiments that involved implicit emotion processing. It is therefore unlikely that task performance confounded our results. Moreover, both groups were matched for age, sex ratio, and years of education, and differed only in the severity of depression symptoms.
4.1. Limitations
The generalizability of our findings may be limited due to the relatively small number of study participants. We employed a nonparametric statistical approach – the preferred method for analysis of smaller datasets – in the analysis of our neuroimaging data, and we also used stringent statistical thresholds for all of our analyses to minimize any type I errors; the significance threshold was set to avoid any false-positive clusters over the whole brain. This would suggest that our findings are robust.
Secondly, medication in depressed patients may have also influenced the between-group variability. The evidence indicates that the effect of medication (if there is one) usually decreases rather than increases differences between groups (Fu et al., 2004; Lawrence et al., 2004). Our analyses of potential effects of medication dose on patterns of abnormal neural activity in depressed patients revealed no significant difference in activity between low-dose vs. high-dose antidepressant medication subgroups in neural regions differentially activated in either face emotion task. We acknowledge, however, that our study may have been underpowered to directly test a medication effect. We emphasize however that our results are in line with those of the study of unmedicated patients (McCabe et al., 2009) who also showed an increase in neural response (in caudate) to the visual signals of disgusting nature.
Thirdly, we did not assess trait anxiety and disgust sensitivity in our participants. This should be examined in future studies to determine the effects of these variables upon neural activity to fear and disgust faces.
In summary, our findings indicate that depressed patients demonstrated significantly greater than normal activity within bilateral temporal-limbic regions in response to prototypical expressions of disgust. This adds to the data from cognitive studies suggesting that the emotion of disgust is highly relevant to depression.
Acknowledgments
We thank Dr. D. Stahl for his help with the statistical analysis of the data.
Role of funding source
WEH was supported by Servier, the French Association of Biological Psychiatry (AFPB) and Janssen-Cilag. He received a research grant from Lundbeck that is unrelated to the content of this manuscript. MLP is supported by NIMH, R01(MH076971-01).
The funding sources had no involvement in influencing the study design; in the collection, analysis and interpretation of data; in the writing of the report; and in the decision to submit the paper for publication.
Footnotes
Contributors
Author MLP designed the study and together with SAS wrote the protocol.
Author WEL wrote the first draft and managed the analyses.
Author TD contributed to the analysis of data and discussion.
Author JR undertook the statistical analysis.
Author BG did the literature search.
Author SAS was responsible for recruitment, scanning and wrote the final draft of the manuscript. All authors contributed to and have approved the final manuscript.
Conflict of interest
None.
References
- Adolphs R, Damasio H, Tranel D, Damasio AR. Cortical systems for the recognition of emotion in facial expressions. Journal of Neuroscience. 1996;16:7678–87. doi: 10.1523/JNEUROSCI.16-23-07678.1996. [DOI] [PMC free article] [PubMed] [Google Scholar]
- Adolphs R, Tranel D, Damasio AR. Dissociable neural systems for recognizing emotions. Brain and Cognition. 2003;52:61–9. doi: 10.1016/s0278-2626(03)00009-5. [DOI] [PubMed] [Google Scholar]
- Almeida JRC, Versace A, Hassel S, Kupfer DJ, Phillips ML. Elevated amygdala activity to sad facial expressions: a state marker of bipolar but not unipolar depression. Biological Psychiatry. 2010;67:414–21. doi: 10.1016/j.biopsych.2009.09.027. [DOI] [PMC free article] [PubMed] [Google Scholar]
- Amaral DG. The primate amygdala and the neurobiology of social behavior: implications for understanding social anxiety. Biological Psychiatry. 2002;51:11–7. doi: 10.1016/s0006-3223(01)01307-5. [DOI] [PubMed] [Google Scholar]
- Beck AT, Steer RA, Brown GK. Beck Depression Inventory – Second Edition Manual. San Antonio, TX: Psychological Corporation, Harcourt, Brace; 1986. [Google Scholar]
- Bediou B, Krolak-Salmon P, Saoud M, Henaff MA, Burt M, Dalery J, et al. Facial expression and sex recognition in schizophrenia and depression. Canadian Journal of Psychiatry. 2005;50:525–33. doi: 10.1177/070674370505000905. [DOI] [PubMed] [Google Scholar]
- Bos EH, Geerts E, Bouhuys AL. Non-verbal interaction involvement as an indicator of prognosis in remitted depressed subjects. Psychiatry Research. 2002;113:269–77. doi: 10.1016/s0165-1781(02)00268-8. [DOI] [PubMed] [Google Scholar]
- Bouhuys AL, Geerts E, Gordijn MCM. Depressed patients’ perceptions of facial emotions in depressed and remitted states are associated with relapse: a longitudinal study. Journal of Nervous and Mental Disease. 1999;187:595–602. doi: 10.1097/00005053-199910000-00002. [DOI] [PubMed] [Google Scholar]
- Brammer MJ, Bullmore ET, Simmons A, Williams SCR, Grasby PM, Howard RJ, et al. Generic brain activation mapping in functional magnetic resonance imaging: a nonparametric approach. Magnetic Resonance Imaging. 1997;15:763–70. doi: 10.1016/s0730-725x(97)00135-5. [DOI] [PubMed] [Google Scholar]
- Bullmore ET, Brammer MJ, Rabe-Hesketh S, Curtis VA, Morris RG, Williams SC, et al. Methods for diagnosis and treatment of stimulus-correlated motion in generic brain activation studies using fMRI. Human Brain Mapping. 1999a;7:38–48. doi: 10.1002/(SICI)1097-0193(1999)7:1<38::AID-HBM4>3.0.CO;2-Q. [DOI] [PMC free article] [PubMed] [Google Scholar]
- Bullmore ET, Suckling J, Overmeyer S, Rabe-Hesketh S, Taylor E, Brammer MJ. Global, voxel and cluster tests, by theory and permutation for a difference between two groups of structural MR images of the brain. IEEE Transactions on Medical Imaging. 1999b;18:32–42. doi: 10.1109/42.750253. [DOI] [PubMed] [Google Scholar]
- Calder AJ, Keane J, Manes F, Antoun N, Young AW. Impaired recognition and experience of disgust following brain injury. Nature Neuroscience. 2000;3:1077–8. doi: 10.1038/80586. [DOI] [PubMed] [Google Scholar]
- Critchley HD, Daly E, Phillips ML, Brammer MJ, Bullmore ET, Williams S, et al. Explicit and implicit neural mechanisms for processing of social information from facial expressions: a functional magnetic resonance imaging study. Human Brain Mapping. 2000;9:93–105. doi: 10.1002/(SICI)1097-0193(200002)9:2<93::AID-HBM4>3.0.CO;2-Z. [DOI] [PMC free article] [PubMed] [Google Scholar]
- Dannlowski U, Ohrmann P, Bauer J, Kugel H, Arolt V, Heindel W, et al. Amygdala reactivity predicts automatic negative evaluations for facial emotions. Psychiatry Research: Neuroimaging. 2007;154:13–20. doi: 10.1016/j.pscychresns.2006.05.005. [DOI] [PubMed] [Google Scholar]
- Ekman P. An argument for basic emotions. Cognition & Emotion. 1992;6:169–200. [Google Scholar]
- Feinstein JS, Goldin PR, Stein MB, Brown GG, Paulus MP. Habituation of attentional networks during emotion processing. NeuroReport. 2002;13:1255–8. doi: 10.1097/00001756-200207190-00007. [DOI] [PubMed] [Google Scholar]
- Fiebach CJ, Friederici AD, Smith EE, Swinney D. Lateral inferotemporal cortex maintains conceptual-semantic representations in verbal working memory. Journal of Cognitive Neuroscience. 2007;19:2035–49. doi: 10.1162/jocn.2007.19.12.2035. [DOI] [PubMed] [Google Scholar]
- Fisher-Beckfield D, McFall RM. Development of a competence inventory for college men and evaluation of relationships between competence and depression. Journal of Consulting and Clinical Psychology. 1982;50:697–705. doi: 10.1037//0022-006x.50.5.697. [DOI] [PubMed] [Google Scholar]
- Folstein MF, Folstein SE, McHugh PR. “Mini-Mental State”: a practical method for grading the cognitive state of patients for the clinician. Journal of Psychiatric Research. 1975;12:189–98. doi: 10.1016/0022-3956(75)90026-6. [DOI] [PubMed] [Google Scholar]
- Fu CHY, Williams SCR, Cleare AJ, Brammer MJ, Walsh ND, Kim J, et al. Attenuation of the neural response to sad faces in major depression by antidepressant treatment: a prospective, event-related functional magnetic resonance imaging study. Archives of General Psychiatry. 2004;61:877–89. doi: 10.1001/archpsyc.61.9.877. [DOI] [PubMed] [Google Scholar]
- Fu CHY, Williams SCR, Brammer MJ, Suckling J, Kim J, Cleare AJ, et al. Neural responses to happy facial expressions in major depression following antide-pressant treatment. American Journal of Psychiatry. 2007;164:599–607. doi: 10.1176/ajp.2007.164.4.599. [DOI] [PubMed] [Google Scholar]
- Gotlib IH, Asarnow RF. Interpersonal and impersonal problem-solving skills in mildly and clinically depressed university students. Journal of Consulting and Clinical Psychology. 1979;47:86–95. doi: 10.1037//0022-006x.47.1.86. [DOI] [PubMed] [Google Scholar]
- Gotlib IH, Krasnoperova E, Yue DN, Joormann J. Attentional biases for negative interpersonal stimuli in clinical depression. Journal of Abnormal Psychology. 2004;113:121–35. doi: 10.1037/0021-843X.113.1.121. [DOI] [PubMed] [Google Scholar]
- Gotlib IH, Whiffen VE. Depression and marital functioning: an examination of specificity of gender differences. Journal of Abnormal Psychology. 1989;98:23–30. [PubMed] [Google Scholar]
- Gur RC, Erwin RJ, Gur RE, Zwil AS, Heimberg C, Kraemer HC. Facial emotion discrimination: II. Behavioral findings in depression. Psychiatry Research. 1992;42:241–51. doi: 10.1016/0165-1781(92)90116-k. [DOI] [PubMed] [Google Scholar]
- Hamilton M. A rating scale for depression. Journal of Neurology, Neurosurgery and Psychiatry. 1960;23:56–62. doi: 10.1136/jnnp.23.1.56. [DOI] [PMC free article] [PubMed] [Google Scholar]
- Harmer CJ, Shelley NC, Cowen PJ, Goodwin GM. Increased positive versus negative affective perception and memory in healthy volunteers following selective serotonin and norepinephrine reuptake inhibition. American Journal of Psychiatry. 2004;161:1256–63. doi: 10.1176/appi.ajp.161.7.1256. [DOI] [PubMed] [Google Scholar]
- Hayward G, Goodwin GM, Cowen PJ, Harmer CJ. Low-dose tryptophan depletion in recovered depressed patients induces changes in cognitive processing without depressive symptoms. Biological Psychiatry. 2005;57:517–24. doi: 10.1016/j.biopsych.2004.11.016. [DOI] [PubMed] [Google Scholar]
- Iidaka T, Omori M, Murata T, Kosaka H, Yonekura Y, Okada T, et al. Neural interaction of the amygdala with the prefrontal and temporal cortices in the processing of facial expressions as revealed by fMRI. Journal of Cognitive Neuroscience. 2001;13:1035–47. doi: 10.1162/089892901753294338. [DOI] [PubMed] [Google Scholar]
- Kircher TT, Senior C, Phillips ML, Benson PJ, Bullmore ET, Brammer MJ, et al. Towards a functional neuroanatomy of self-processing: effects of faces and words. Cognitive Brain Research. 2000;10:133–44. doi: 10.1016/s0926-6410(00)00036-7. [DOI] [PubMed] [Google Scholar]
- Lawrence NS, Williams AM, Surguladze S, Giampietro V, Brammer MJ, Andrew C, et al. Subcortical and ventral prefrontal cortical neural responses to facial expressions distinguish patients with bipolar disorder and major depression. Biological Psychiatry. 2004;55:578–87. doi: 10.1016/j.biopsych.2003.11.017. [DOI] [PubMed] [Google Scholar]
- Marzillier SL, Davey GCL. The emotional profiling of disgust-eliciting stimuli: evidence for primary and complex disgusts. Cognition & Emotion. 2004;18:313–36. [Google Scholar]
- McCabe C, Cowen PJ, Harmer CJ. Neural representation of reward in recovered depressed patients. Psychopharmacology (Berl) 2009;205:667–77. doi: 10.1007/s00213-009-1573-9. [DOI] [PMC free article] [PubMed] [Google Scholar]
- Merens W, Booij L, Haffmans PM, van der Does AJ. The effects of experimentally lowered serotonin function on emotional information processing and memory in remitted depressed patients. Journal of Psychopharmacology. 2008 doi: 10.1177/0269881107081531. [DOI] [PubMed] [Google Scholar]
- Ogawa S, Lee TM, Kay AR, Tank DW. Brain magnetic resonance imaging with contrast dependent on blood oxygenation. Proceedings of the National Academy of Sciences of the United States of America. 1990;87:9868–72. doi: 10.1073/pnas.87.24.9868. [DOI] [PMC free article] [PubMed] [Google Scholar]
- Olatunji BO, McKay D. Disgust and psychiatric illness: have we remembered? British Journal of Psychiatry. 2007;190:457–9. doi: 10.1192/bjp.bp.106.032631. [DOI] [PubMed] [Google Scholar]
- Oldfield RC. The assessment and analysis of handedness: the Edinburgh inventory. Neuropsychologia. 1971;9:97–113. doi: 10.1016/0028-3932(71)90067-4. [DOI] [PubMed] [Google Scholar]
- Overton PG, Markland FE, Taggart HS, Bagshaw GL, Simpson J. Self-disgust mediates the relationship between dysfunctional cognitions and depressive symptomatology. Emotion. 2008;8:379–85. doi: 10.1037/1528-3542.8.3.379. [DOI] [PubMed] [Google Scholar]
- Phillips ML, Senior C, Fahy T, David AS. Disgust–the forgotten emotion of psychiatry. British Journal of Psychiatry. 1998;172:373–5. doi: 10.1192/bjp.172.5.373. [DOI] [PubMed] [Google Scholar]
- Phillips ML, Young AW, Senior C, Brammer MJ, Andrew C, Calder AJ, et al. A specific neural substrate for perceiving facial expressions of disgust. Nature. 1997;389:495–8. doi: 10.1038/39051. [DOI] [PubMed] [Google Scholar]
- Power MJ, Dalgleish T. Cognition and Emotion From Order to Disorder. Hove: Psychology Press; 1997. [Google Scholar]
- Power MJ, Tarsia M. Basic and complex emotions in depression and anxiety. Clinical Psychology and Psychotherapy. 2007;14:19–31. [Google Scholar]
- Rozin P, Lowery L, Ebert R. Varieties of disgust faces and the structure of disgust. Journal of Personality and Social Psychology. 1994;66:870–81. doi: 10.1037//0022-3514.66.5.870. [DOI] [PubMed] [Google Scholar]
- Schienle A, Schafer A, Stark R, Walter B, Franz M, Vaitl D. Disgust sensitivity in psychiatric disorders: a questionnaire study. Journal of Nervous and Mental Disease. 2003;191:831–4. doi: 10.1097/01.nmd.0000100928.99910.2d. [DOI] [PubMed] [Google Scholar]
- Sheline YI, Barch DM, Donnelly JM, Ollinger JM, Snyder AZ, Mintun MA. Increased amygdala response to masked emotional faces in depressed subjects resolves with antidepressant treatment: an fMRI study. Biological Psychiatry. 2001;50:651–8. doi: 10.1016/s0006-3223(01)01263-x. [DOI] [PubMed] [Google Scholar]
- Sprengelmeyer R, Rausch M, Eysel UT, Przuntek H. Neural structures associated with recognition of facial expressions of basic emotions. Proceedings of the Royal Society of London: Series B. 1998;265:1927–31. doi: 10.1098/rspb.1998.0522. [DOI] [PMC free article] [PubMed] [Google Scholar]
- Surguladze SA, Brammer MJ, Keedwell P, Giampietro V, Young AW, Travis MJ, et al. A differential pattern of neural response toward sad versus happy facial expressions in major depressive disorder. Biological Psychiatry. 2005;57:201–9. doi: 10.1016/j.biopsych.2004.10.028. [DOI] [PubMed] [Google Scholar]
- Surguladze SA, Brammer MJ, Young AW, Andrew C, Travis MJ, Williams SC, et al. A preferential increase in the extrastriate response to signals of danger. NeuroImage. 2003;19:1317–28. doi: 10.1016/s1053-8119(03)00085-5. [DOI] [PubMed] [Google Scholar]
- Surguladze SA, Young AW, Senior C, Brebion G, Travis MJ, Phillips ML. Recognition accuracy and response bias to happy and sad facial expressions in patients with major depression. Neuropsychology. 2004;18:212–8. doi: 10.1037/0894-4105.18.2.212. [DOI] [PubMed] [Google Scholar]
- Suslow T, Junghanns K, Arolt V. Detection of facial expressions of emotions in depression. Perceptual and Motor Skills. 2001;92:857–68. doi: 10.2466/pms.2001.92.3.857. [DOI] [PubMed] [Google Scholar]
- Talairach J, Tournoux P. Co-Planar Stereotaxic Atlas of the Human Brain Stuttgart. New York: Thieme; 1988. [Google Scholar]
- Thirion B, Pinel P, Meriaux S, Roche A, Dehaene S, Poline JB. Analysis of a large fMRI cohort: statistical and methodological issues for group analyses. NeuroImage. 2007;35:105–20. doi: 10.1016/j.neuroimage.2006.11.054. [DOI] [PubMed] [Google Scholar]
- Tranter R, Bell D, Gutting P, Harmer C, Healy D, Anderson IM. The effect of serotonergic and noradrenergic antidepressants on face emotion processing in depressed patients. Journal of Affective Disorders. 2009;118:87–93. doi: 10.1016/j.jad.2009.01.028. [DOI] [PubMed] [Google Scholar]
- Tyler LK, Bright P, Dick E, Tavares P, Pilgrim L, Fletcher P, et al. Do semantic categories activate distinct cortical regions? Evidence for a distributed neural semantic system. Cognitive Neuropsychology. 2003;20:541–59. doi: 10.1080/02643290244000211. [DOI] [PubMed] [Google Scholar]
- Ungerleider LG, Haxby JV. ‘What’ and ‘where’ in the human brain. Current Opinion in Neurobiology. 1994;4:157–65. doi: 10.1016/0959-4388(94)90066-3. [DOI] [PubMed] [Google Scholar]
- Young AW, Perret DI, Calder AJ, Sprengelmeyer R, Ekman P. Facial Expressions of Emotion: Stimuli and Tests (FEEST) Bury St. Edmunds: Thames Valley Test Company; 2002. [Google Scholar]
- Zhou HZ, Li YJ, Zhou S, Lu XS, Luo YF, Zheng NT, et al. Event-related potential of facial expression processing (summary in English) Academic Journal of the First Medical College of PLA. 2005;25:921–41. [PubMed] [Google Scholar]