

Abstract
Background
The pro-inflammatory cytokines, tumor necrosis factor (TNF)-α, and interleukin (IL)-17, have been implicated in the pathogenesis of liver fibrosis. In this study, we investigated the role of TNFα and IL-17 towards induction of profibrotic factor, periostin.
Methods
HepG2 cells were cultured and treated with inflammatory cytokines, TNFα and IL-17. Computational promoter sequence analysis of the periostin promoter was performed to define the putative binding sites for transcription factors. Transcription factors were analyzed by Western blot and Chromatin Immunoprecipitation. Periostin and transcription factor expression analysis was performed by RT-PCR, Western blot, and fluorescence microscopy. Type I collagen expression from fibroblast cultures was analyzed by Western blot and Sircol soluble collagen assay.
Results
Activation of HepG2 Cells with TNFα and IL-17 enhanced the expression of periostin (3.5 and 4.4 fold, respectively p<0.05) compared to untreated cells. However, combined treatment with both TNFα and IL-17 at similar concentration demonstrated a 13.3 fold increase in periostin (p<0.01), thus suggesting a synergistic role of these cytokines. Periostin promoter analysis and specific siRNA knock-down revealed that TNFα induces periostin through cJun, while IL-17 induced periostin via STAT-3 signaling mechanisms. Treatment of the supernatant from the cytokine activated HepG2 cells on fibroblast cultures induced enhanced expression of type I collagen (>9.1 fold, p<0.01), indicative of a direct fibrogenic effect of TNFα and IL-17.
Conclusion
TNFα and IL-17 induced fibrogenesis through cJun and STAT-3 mediated expression of profibrotic biomarker, periostin. Therefore, periostin might serve as a novel biomarker in early diagnosis of liver fibrosis.
Keywords: Fibrosis, Periostin, Inflammation, Tumor Necrosis Factor, Interleukin, transcription factors
Introduction
Chronic liver disease is one of the top fifteen leading causes of death in the United States (Murphy et al., 2010). Most common causes of chronic liver disease include: viral hepatitis, alcoholism, metabolic and autoimmune diseases (Schuppan and Afdhal, 2008). The progression from healthy liver tissue to cirrhosis is mediated by a chronic inflammatory reaction eventually leading to the excess deposition of extracellular matrix proteins (Friedman, 2008). The inflammatory reaction is considered to be the key predictor of disease progression (Argo et al., 2009; Asselah et al., 2005). The accumulation of ECM proteins distorts the hepatic architecture by forming a fibrous scar, and the subsequent development of nodules of regenerating hepatocytes leading to cirrhosis. Hepatic fibrosis is generally considered to be an irreversible process manifested by a collapse in the hepatic parenchyma and its substitution with a collagen-rich tissue (Bataller and Brenner, 2005). Animal models and cell culture studies on liver fibrogenesis led to the identification of key fibrotic biomarkers (Hayashi and Sakai, 2011). Research and understanding in the pathogenesis of liver fibrosis could aid the development of novel therapeutic strategies to prevent and possibly reverse the disease progression.
Inflammation is an important starting event of liver fibrosis (Czaja, 2014). Inflammatory cytokine levels are elevated independently of the etiology of the underlying liver disease (Tilg et al., 2006). Among the pro-inflammatory cytokines, tumor necrosis factor-alpha (TNFα) is a potent cytokine that exerts pleiotropic inflammatory and immunological functions by triggering downstream signaling events leading to hepatic fibrosis (Osawa et al., 2013). Levels of circulating TNFα are increased in patients with liver fibrosis and are associated with poor prognosis (Odeh et al., 2005). Further in an experimental cholestasis induced by bile duct ligation TNFα and IL-6 were elevated indicating the pathogenic nature of these cytokines (Gabele et al., 2009; Odeh, 2007). Hepatic macrophages in chronic liver inflammation exhibit high levels of TNFα expression (Zimmermann et al., 2012). TNFα has also been demonstrated to induce fibrosis in other models. In a model of pulmonary fibrosis, TNFα receptor knockout mice were protected from the development of fibroproliferative lesions (MacEwan, 2002). Also, hepatic injury following administration of the hepatotoxin carbon tetrachloride was inhibited in TNFα knockout mice (Sudo et al., 2005). Along with TNFα alpha another inflammatory cytokine IL-17 has been implicated in the liver fibrosis (Tang et al., 2011). IL-17A plays a critical role in neutrophil recruitment, angiogenesis, inflammation, and autoimmune disease that has been previously described extensively (Miyamoto et al., 2003), including in pulmonary and cardiac fibrosis via IL-17 receptor mediated signaling (Gasse et al., 2011; Zhu et al., 2011). Although these cytokines induce fibrotic events, to date, very limited data is available on fibrotic biomarkers with therapeutic value.
Periostin is a 90-kD secretory protein, playing an important role in the development of bones, teeth and tumor progression (Hamilton, 2008; Ruan et al., 2009). Recent evidence suggests that expression of periostin is involved in various pathophysiological statuses of fibrosis, including the healing process in myocardial infarction, pulmonary fibrosis and bone marrow fibrosis (Oka et al., 2007; Oku et al., 2008). Studies from lung models indicate that periostin contributes to the formation of fibrosis in response to inflammatory cytokines (Sidhu et al., 2010). In this report, we demonstrate that TNF and IL-17 exert a synergistic effect on HepG2 cells through two different signaling pathways leading to enhanced periostin expression and eventual induction of Type I collagen expression, a potential pathogenic mechanism in liver fibrosis.
Materials and Methods
Cell culture
HepG2 cells were obtained from the American Type Culture Collection (HB-8065, ATCC, Manassas, VA) and cultured in cell basal essential media (30–2003, ATCC, Manassas, VA) along with the media supplements as recommended by the manufacturers (Sarma et al., 2014). Normal neonatal human fibroblasts (PCS-201-010™, ATCC, Manassas, VA) and normal adult human dermal fibroblasts (PCS-201-012, ATCC, Manassas, VA) were also obtained from the same vendor and cultured as per the manufacture’s protocol. Cell lines were frozen in liquid vapor nitrogen at −130°C until use. Upon thawing, cells were maintained in 5% CO2 incubator in sterile essential media at 37°C. Cells were then stimulated with varying concentration (0–1000 ng/mL) of TNF or IL-17 or both (Life Technologies, Grand Island, NY) for 48–72 hours. Specific siRNA (Santa Cruz Biotech, Dallas, TX) mediated gene knock-down of STAT-3 (sc-29493) and cJun (sc-29223). The knockdown efficiency was measured by qPCR. All experiments were performed in triplicates.
Total protein extraction and Western blot analysis
Total proteins were extracted from cells with lysis buffer (50mM HEPES [pH 7.6], 150mM NaCl, 1% Triton X-100, 30mM Na4P2O7, 10% glycerol, 1mM benzamidine, 1mM DTT, 10µg of leupeptin/ml, 1mM phenylmethylsulfonyl fluoride 50mM NaF, 1mM sodium orthovandate, 10mM sodium pyrophosphate decahydrate, 10mM β-glycerophosphate (Sigma Aldrich, MO) (Tiriveedhi et al., 2012a). After cell lysis, the supernatant was collected and run at 15,000 × g for 15min at 4°C.
Nuclear Protein extraction
Nuclear proteins were extracted from HepG2 cells with initial resuspension in Buffer 1 with protease and phosphatase inhibitors (100mM HEPES, 5mM KCl, 0.5mM MgCl2, 0.1mM EDTA, 1mM DTT, 10µg/mL of aprotinin A, 10µg/mL of leupeptin, 1 mM PMSF, 50mM NaF, 1mM sodium orthovandate, 10mM sodium pyrophosphate decahydrate, 10mM β-glycerophosphate) and later resuspended in equivolume mix of Buffer 1 and Buffer 2 (12.25mL of Buffer 1 + 250µL NP-40) to extract the cytosolic proteins from the supernatant. The resultant pellet of cell lysates were centrifuged at 12,000 × g for 1min at 4°C, and the remaining nuclear material were solubilized in Buffer 3 (250mM HEPES, 350mM NaCl, 10% sucrose, 1mM EDTA, 1mM DTT, 10µg/mL of aprotinin A, 10µg mL of leupeptin, 1mM PMSF) (Tiriveedhi et al., 2012a).
Protein concentration was determined with a Bradford assay kit from Bio-Rad (Philadelphia.PA). Total proteins were separated on a 4–12% sodium dodecyl sulfate-polyacrylamide gradient gel and electrophoretically transferred onto a nitrocellulose membrane. The membranes were blocked overnight at 4°C in Tris-buffered saline with 0.05% Tween 20 (5% nonfat milk in 10mM Tris-HCl-100mM NaCl-0. 1% Tween 20, pH 7.4). The membranes were incubated first with Abs specific for total and phosphorylated forms at room temperature with primary Abs diluted 1 in 1,000 in blocking buffer for 2hrs, and then with a horseradish peroxide-conjugated secondary IgG mAb diluted 1 in 5,000 for 1hr. All primary and secondary Abs were obtained from Santa Cruz Biotech (Dallas, TX). The following specific primary antibodies to periostin (sc-67233), STAT-3 (sc-482), c-Jun (sc-1694), and Actin (sc-10731) were utilized. Phosphorylated forms were probed with phospho-specific primary antibodies: Ser-727-p-STAT-3 (sc-21876) Thr-183/Tyr185/c-Jun (sc-293136), respectively. The membrane was developed using the chemiluminescence kit (Millipore) and analyzed on using Bio-Rad Universal Hood II (Hercules, CA). Morphometric analysis was done using the software provided by the company.
mRNA expression analysis
Expression profiles of intracellular signalling genes in the HepG2 cells were analyzed using the FAM-labeled RT-PCR primers for Periostin (Hs01566748_m1), c-Jun (Hs99999141_s1), Stat-3 (Hs01051722_s1), GADPH (Hs402869), Actin (Hs4333762T), and Type I collagen (Hs01103892_g1) obtained from Applied Biosystems/Life Technologies (Grand Island, NY) as per the manufacturer’s recommendation. Briefly, total RNA was extracted from 106 cells using TRIzol reagent (Sigma–Aldrich, St Louis, MO) (Tiriveedhi et al., 2012b). RNA samples were quantified by absorbance at 260nm. The RNA was reverse-transcribed and RT-PCR (real time PCR) was performed in a final reaction volume of 50µL using iCycler 480 Probes Master (Roche Diagnostics, Indianapolis, IN). Each sample was analyzed in triplicate. Cycling conditions consisted of an initial denaturation of 95°C for 15min, followed by 40 cycles of 95°C for 30s, followed by 61°C for 1min.
Immunofluorescence microscopy
For staining of periostin, 50,000 HEPG2 cells were grown on coverslips in 24-well plates (Sarma et al., 2014). Cells were fixed with 4% paraformaldehyde and permeabilized with 0.1% Triton X-100. 2% normal goat serum in DPBS (Dulbecco’s phosphate-buffered saline, Life Technologies, Grand Island, NY) with 1% BSA, 0.1% Tween 20 was used for blocking and washing. The specific primary antibodies and corresponding PE-conjugated immunofluorescence antibodies (eBioscience, SanDiego, CA) were used. The images were captured using an Eclipse 80i fluorescence microscope (Nikon, NY) and processed using Metamorph version 6.3r2 software (Molecular Devices, CA).
Plasmids and siRNA constructs
For the reporter constructs, the periostin promoter regions (−4000 to +50 bp) were amplified from human genomic DNA (Zyagen, CA) by PCR using iProof High-Fidelity DNA Polymerase (Bio-Rad, CA). The PCR products were subcloned into the pGL4.11 vector (Promega, WI) upstream of a luciferase gene using the KpnI/EcoRV restriction sites. Computational analysis to identify promoter-bound transcription factors was done using the Transcription Element Search System (TESS) (http://www.cbil.upenn.edu/cgi-bin/tess/tess).
Luciferase reporter assay
HepG2 cells (1 × 10⁵) were transfected in 24-well plates with 1 µg pGL4.11 luciferase reporter vector driven by the periostin promoters, or with 2 µg control vector (Sarma et al., 2014). For transfection of HEPG2 cells (ATCC), 0.2×10⁵ cells were seeded into each well of a 24 well plate and grown for 24–48 hours. On the day of transfection, medium was changed and 500 ng of DNA was transfected using Lipofectamine™ LTX and Plus Reagent (Invitrogen, NY). For siRNA delivery 0.1×10⁵ cells were grown in each well of a 24 well plate for 24–48 hours in antibiotic free medium and 80 pico moles of siRNA were transfected using Lipofectamine™ RNAiMAX (Invitrogen, NY). Cells were harvested 48 hours post transfection and efficiency was measured by qPCR, immunostaining and western blot.
Chromatin Immunoprecipitation
Chromatin immunoprecipitation (ChIP) was carried out with ChIP-IT Express (Active Motif, CA) according to the manufacturer's instructions (Sarma et al., 2014). One microgram of Abs for control IgG, c-Jun, or STAT3, was used to immunoprecipitate DNA-protein complexes. CCL2 promoter regions were amplified using PCR and resolved on 2% agarose gels. The images were acquired with the Chemidoc XRS System (Bio-Rad).
Co-immunoprecipitation
For cJun and STAT-3 immunoprecipitation HepG2 cells were washed with cold DPBS, and lysed for 30 min on ice with 0.5 mL of lysis buffer (10 mM Tris-HCl pH 7.5, 0.4 M NaCl, 1% NP-40, 0.4% Triton X-100, 0.2% sodium deoxycholate, 1 mM EDTA, protease inhibitors (Roche), 1 mM PMSF). To the lysis buffer 0.5 mL of dilution buffer (10 mM Tris-HCl pH 7.5, 1 mM EDTA, protease inhibitors, 1 mM PMSF) was added, followed by centrifugation at 17,000 × g for 30 min. The supernatant was transferred and 1 µg normal mouse IgG or mouse anti-cJun or mouse anti-STAT-3 were added. After overnight incubation at 4°C, 30 µL Protein G beads were added to lysates and incubated for 2 hours. Beads were washed with 700 µL of wash buffer (10 mM Tris-HCl pH 7.5, 0.2 M NaCl, 0.5% NP-40, 0.2% Triton X-100, 0.1% sodium deoxycholate, 1 mM EDTA, 1× protease inhibitors, 1 mM PMSF) five times, 3 min each time followed by centrifugation at 1,800 × g for 3 min at 4°C. Beads were then washed with cold DPBS and bound proteins were eluted by boiling with 30 µL of 2× SDS buffer (0.1 M Tris-HCl pH 6.8, 3.5% SDS, 10% Glycerol, 2 mM DTT, 0.004% bromophenol blue) for 10 min. Proteins were subjected to SDS-PAGE (4–12% gel) and immunoblotting. cJun or STAT-3 were detected with a rabbit anti-cJun or a rabbit anti-STAT-3 respectively.
Enzyme-linked immunoassay (ELISA)
The secretory extracellular periostin in the cell supernatant was quantitatied by ELISA. Periostin ELISA was performed as per the manufacturer’s protocol (BioVision Inc, Milpitas, CA). Given the limitation of the detection, the supernatant was diluted 1:1000 and quantified with a standard curve using the manufacturer provided standards. Detection at 450 nm was performed using EMax Plus spectrophotometer and data analysis was carried out using software provided by the manufacturer (Molecular Devices, Sunyvale, CA).
Collagen Assay
Total soluble collagen content in cell lysates was measured using Sircol soluble collagen assays (CRLS1000) as described in the manufacturer’s protocol (Accurate Chemical ad Scientific Corp, Westbury, NY) (Sidhu et al., 2010). Cells were prepared by washing with cold PBS solution, treated with 0.5 M acetic acid, freeze/thawed, and digested with pepsin overnight at 4 °C. Samples were centrifuged to remove insoluble debris then incubated with Sircol dye reagent for 30 min at room temperature on a shaker. Samples then spun to pack the insoluble collagen–dye complex and excess liquid decanted off. One milliliter of alkali reagent was then added and mixed to dissolve bound dye and samples were assayed at 540 nm on a EMax Plus spectrophotometer and data analysis was carried out using software provided by the manufacturer (Molecular Devices, Sunyvale, CA). Collagen standards were used as controls.
Statistical analysis
Data are expressed as mean ± SEM from four independent studies. Statistical differences between means were analyzed using a paired or unpaired Student’s t test. A p-value of less than 0.05 was considered significant. All data analysis was obtained using Origin 7 software (Origin Labs, Northampton, MA) or GraphPad5 (Graph Pad Software, LaJolla, CA).
RESULTS
Increased expression of periostin upon activation of Hep-G2 cells with TNFα and IL-17
Studies in the literature have reported the role of TNFα and IL-17 in hepatic fibrosis. As periostin is a key pro-fibrotic signal molecule and biomarker, we performed experiments to determine the role of these pro-inflammatory cytokines in the expression of the periostin protein. We have treated the HepG2 cells, a perpetual hepato carcinoma cell line, with 50 ng/mL of either TNFα, or IL-17, or a combination of both cytokines. As shown in figure 1A, intracellular immunohistochemical staining of HepG2 cells for periostin demonstrated an increased expression of the protein following co-treatment with both TNFα and IL-17. This is further verified by western blot analysis (figure 1B). Quantitative mRNA analysis of the periostin (figure 1C) demonstrated that under basal conditions there was minimal to no expression of periostin (1.0 ± 0.2 fold), but following treatment with either TNFα or IL-17 alone there was a significant elevation of periostin mRNA expression (3.5 ± 1.1 fold and 4.4 ± 0.9 fold, respectively p<0.05). However, a co-treatment of both TNFα and IL-17 demonstrated a 13.3±3.8 fold increased expression (p<0.05) over the basal conditions. Importantly, treatment with anti-inflammatory cytokine IL-10 demonstrated no enhanced expression of periostin (0.5 ± 0.3 fold, p=0.83) over basal conditions. Further dose-dependent studies were performed using various concentrations (1 to 1000 ng/mL) of TNFα and Il-17. As shown in figure 1D and E, individual treatment with these pro-inflammatory cytokines only induced a maximum of 3.5 fold enhanced expression even at 1000 ng/mL concentration, as against 13.3 fold expression with co-treatment (50 ng/mL of TNFα+50 ng/mL of IL-17). Thus we demonstrate that co-treatment with TNFα and IL-17 caused approximately a 4 fold increase above the individual cytokine treatment with either TNFα or IL-17. It is important to note in dose response curves (figure 1D ad E) that individual treatment with 50 ng/mL TNFα or IL-17 lead to almost (>90%) saturation kinetics for that specific cytokine. These data indicate that TNFα and IL-17 exert a synergistic effect. Furthermore, as the synergistic effect was shown to be higher than the individual saturation effect, this strongly suggests a possibility of two different pro-fibrotic signaling mechanisms induced by these two cytokines.
Figure 1.
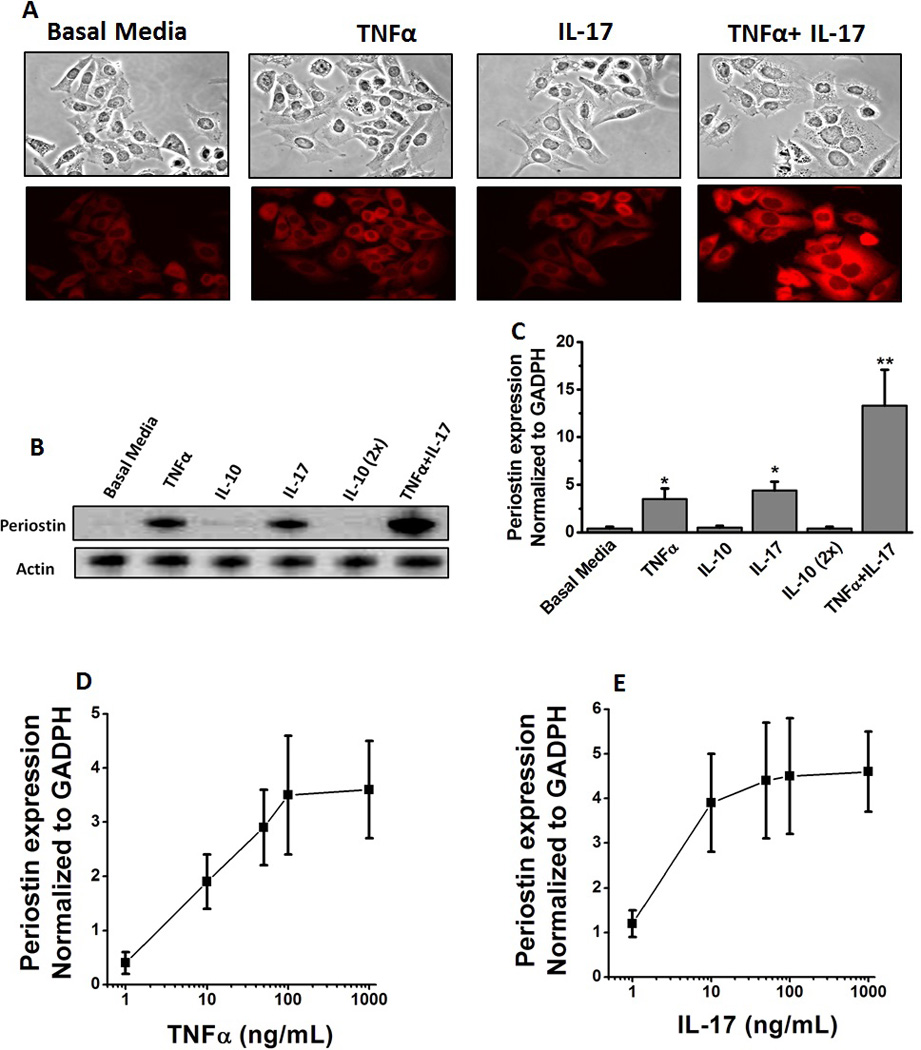
Increased periostin expression in HepG2 cells following stimulation with TNFα and IL-17. (A) Immunostaining of HepG2 cells with periostin following treatment with with TNFα (50 ng/mL), or IL-17 (50 ng/mL) or both (TNFα-50 ng/mL and IL-17–50 ng/mL). Periostin probed with rabbit anti-human primary antibody at 1: 100 and later probed by PE-conjugated oat anti-rabbit secondary antibody at 1:200. (B) Western blot analysis of perisotin expression in the hepG2 cells. The cell lystate probed by appropriate primary and secondary antibody. The representative periostin protein band at 93 kDa is shown. Anti-inflammatory cytokine IL-10 was utilized as negative control at two concentrations 50 and 100 (2×) ng/mL. (C) Periostin mRNA expression analyzed by quantitative RT-PCR. Quantitation done by ΔΔcT method normalized for GADPH expression. (D and E) Dose dependent changes in the mRNA expression of periostin in the HepG2 cells following stimulation by TNFα (0–1000 ng/mL) (D) and IL-17 TNFα (0–1000 ng/mL) (E). All data represented as mean values ± SEM from four independent experiments.
Specific Modulation of periostin expression by cJun and STAT3
Based on our previous studies (figure 1) we performed experiments to determine the transcription factors to specifically delineate the pro-fibrotic signaling events mediated by TNFα and IL-17. Towards this, we have initially analyzed various transcription factors by quantitative RT-PCR and found that cJun and STAT-3 demonstrated significantly enhanced expression. The other transcription factors which we tested and did not induce a significant change under our current experimental conditions were AP-1, p38, STAT-1, STAT-2, STAT-5, Akt, mTOR. Western blot (and phosphoblot) studies (figure 2A) following treatment with 50 ng/mL of TNFα on Hep G2 cells for 30 minutes demonstrated is an enhanced expression and phosphorylation of cJun while similar dose and conditions with IL-17 induced an enhanced expression and phosphorylation of STAT-3. However, co-treatment with TNF and IL-17 demonstrated expression and phosphorylation of both cJun and STAT-3. Quantitative analysis by qRT-PCR demonstrated that there was a 4.4 fold upregulation of total cJun (figure 2B) following treatment with TNFα, which did not increase further upon co-treatment with both TNFα and IL-17. Similarly, there was a 3.7 fold upregulation in total STAT-3 (figure 2C) following treatment with IL-17, which did not increase further change upon co-treatment with both TNFα and IL-17. These data support our previous assertion that TNFα and IL-17 potentially induce periostin expression through two different signaling factors.
Figure 2.

Induction of transcription factors cJun and STAT-3 in HepG2 cells following stimulation with TNFα and IL-17, respectively. (A) Western blot analysis was performed to determine the protein level expression of cJun (43 kDa), p-cJun (43 kDa), STAT-3 (86 kDa), p-STAT-3 (86 kDa), STAT-6 (116 kDa), and Actin (43 kDa) for both total and active phosphorylated forms analyzed after 30 min stimulation with TNFα, or IL-17 or both; (B and C) quantitative mRNA expression of cJun (B), and STAT-3 (C) by qRT-PCR analyzed after 30 min stimulation with TNFα, or IL-17 or both. Quantitation done by ΔΔcT method normalized for GADPH expression. (D) Immunostaining of HepG2 cells with periostin following treatment with with both TNFα and IL-17, and specific siRNA knock down of cJun and STAT-3. (E) Western blot analysis of perisotin expression in the hepG2 cells following stimulation with TNFα and IL-17 along with cJun and STAT-3 knock-down by specific siRNA. Scramble siRNA usd as negative control. (F) Periostin mRNA expression analyzed by quantitative RT-PCR in the hepG2 cells following stimulation with TNFα and IL-17 along with cJun and STAT-3 knock-down by specific siRNA. Quantitation done by ΔΔcT method normalized for GADPH expression. All data represented as mean values ± SEM from four independent experiments.
Figure 3.
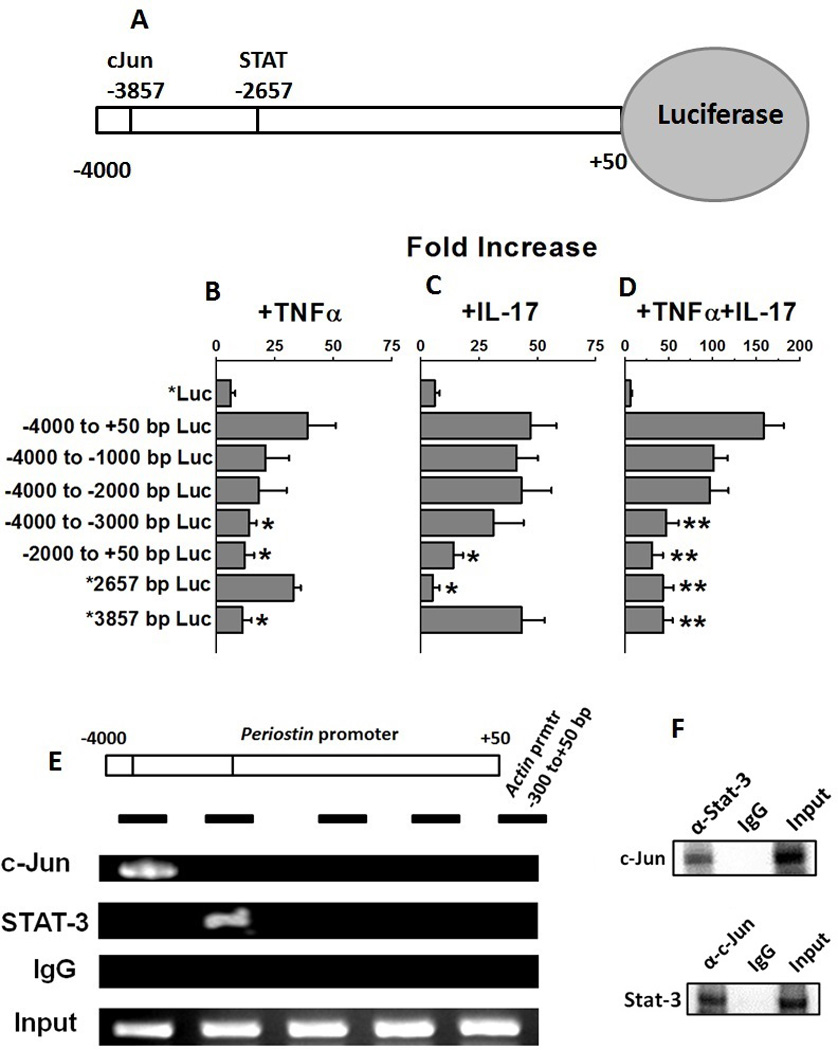
cJun and STAT-3 bind to periostin promoter and activate transcription. (A) Schematic of the periostin gene promoter cloned in the luciferase reporter. Computational analysis of −4000 bp upstream of the open reading frame using the Transcription Element Search System (TESS). The lines in the schematic at −3857 and −2657 represent the predicted consensus binding sites in the DNA for transcription factors cJun and STAT-3, respectively. (B–D) HepG2 were transfected with luciferase reporters driven by deletion constructs of periostin promoter (−4000 to+50 bp; −4000 to −1000 bp; −4000 to −2000 bp; −4000 to −3000 bp; −2000 to +50 bp; mutation *Δ2657 bp/−4000 to +50 bp; and mutation *Δ3857 bp/−4000 to +50 bp) construct and stimulated with TNFα (B), or, IL-17 (C), or both (D). Firefly luciferase activity was measured 48 hours after transfection and normalized to a Renilla luciferase internal control. The numbers represent fold-change over the control vector (average of three independent experiments); error bars represent S.D. (E) Periostin promoter showing binding sites for cJun and STAT-3. The black horizontal bars represent regions amplified by the PCR primers. Chromatin was immunoprecipitated with anti-cJun or anti-STAT-3 or isotype control IgG from HepG2 cells following stimulation with both TNFα and IL-17. Segments of the periostin promoter were amplified by PCR. The first three lanes show immunoprecipitated with chromatin (ChIP) and the fourth lane show input chromatin (Input). ACTIN promoter amplification is shown as the negative control (F) Co-Immunoprecitation of protein-complex extracted by anti-STAT-3 and anti-cJun and Western blot analysis to probe with the opposite antibody (upper panel: probe with c-Jun antibody and protein complex pulled down with Stat-3 antibody; lower panel probe with Stat-3 antibody and protein complex pulled down with c-Jun antibody).
To confirm that TNFα and IL-17 induce separate pro-fibrotic signaling we performed siRNA knockdown experiments specific for cJun and STAT-3. As shown in figure 2D, siRNA knockdown of cJun and STAT-3, individually, following co-treatment with TNFα and IL-17 demonstrated reduced intracellular staining for periostin. As expected, combined knock-down of both cJun and STAT-3 completely abolished the periostin expression. This is further verified by western blot analysis (figure 2E). Quantitative mRNA analysis of the periostin (figure 2F) demonstrated that cJun knock-down reduced the periostin expression to 5.1± 1.8 fold, while STAT-3 knock-down reduced the periostin expression to 4.6± 1.5 fold in previously TNFα and IL-17 co-treated HepG2 cells. As noted earlier in figure 2F, TNFα and IL-17 co-treatment induced periostin expression (13.3±2.8 fold over basal untreated levels). Taken together these data confirm that TNFα and IL-17 induce pro-fibrotic signaling molecule, periostin, in two apparently different signaling mechanisms.
Identification of putative DNA binding transcription factors in the periostin promoter regions
To determine the role of TNFα and IL-17 in periostin expression, the luciferase reporter construct (figure 3A) containing the −4,000-bp region of the human periostin gene promoter was transfected into HepG2 cells and treated with TNFα or IL-17 or both, and luciferase activity was measured. An increase in the periostin reporter activity was observed in TNFα (6.5 fold, figure 3B) and IL-17 (7.8 fold, figure 3C) treated cells compared to the untreated cells. Further co-treatment with both TNF and IL-17 demonstrated a 26.3 fold increase (figure 3D) in Luciferase activity compared to the untreated cells. These data were in line with our earlier data (figure 1–3) supporting our contention that TNF and IL-17 work synergistically to ehance periostin expression. Also, this strongly suggests that TNF and IL-17 activates periostin through modulation of upstream transcription factors cJun and STAT-3.
To further specifically identify the putative DNA binding sequences for the transcription factors in the periostin promoter regions, a computational analysis of −4,000 bp of the promoter region was performed using TESS. This bioinformatics analysis identified 12 putative DNA binding sites for for c-Jun (TGAGTCA; TGAC/GTCA), and one site for STAT3 (TTCTTTTGAA) at the bp −2657 position (figure 3A) with putative cJun and STAT-3 binding sequences close proximity to each other, suggesting that these two transcription factors may be part of a transcriptional-regulatory complex that mediates periostin expression. To demonstrate that these transcription factors regulate periostin expression, HepG2 cells were transfected with the truncated periostin reporter construct and treated with TNFα, or IL-17 or both (figure 3B–D). As shown in figure 3B, following treatment with TNFα various truncated regions showed significant decrease (>40% loss of activity) in reporter activity compared to the non-truncated periostin reporter activity. Of note, the mutation at −3857 (*TGAGTCA) resulted in highest (>80%) loss of activity. Thus strongly suggesting that this putative sequence region interacts with the cJun following TNFα treatment to enhance periostin expression. Similarly, following treatment with IL-17 among various truncated regions the mutation at −2657 (*TTCTTTTGAA) resulted in highest (>80%) loss of activity compared to the non-truncated periostin reporter activity. As expected, these two mutants demonstrated highest loss of activity following co-treatment with TNFα and IL-17 (figure 3D), this strongly suggesting a cooperation between the factors in regulating periostin expression.
To determine whether cJun and STAT3 bind to adjacent DNA binding sites on the periostin promoter to form a transcriptional-activation DNA-protein complexes, TNFα, IL-17 or both, treated HepG2 cells were immunoprecipitated with anti-cJun, or anti-STAT3, or control IgGs. The chromatin immunoprecipitation (ChIP) and PCR using primers specific for periostin promoter regions (figure 3E, black bars) demonstrated that cJun, and STAT3 bind to the periostin promoter (figure 3E). cJun binds strongly to the −4000 to −3000 bp region and STAT-3 binds to −3000 to −2000 bp region of the PCR amplicon. The DNA binding pattern of cJun and STAT-3 strongly correlates with the locations of the consensus binding sites on the periostin promoter determined by Luciferase reporter activity (figure 3B–D). ChIP with the control IgGs did not enrich periostin promoter regions, demonstrating the specificity for these transcription factors. No binding was observed in PCRs carried out with primers specific for the 300 to+50 bp region of the ACTIN (ACT1) promoter that lacks these binding sites (figure 3E). The protein-protein complexes were immunoprecipitated with anti-cJun or anti-STAT-3 or isotype control IgGs and western blot analysis was performed to probe for the other protein (figure 3F, upper panel: probe with c-Jun antibody and protein complex pulled down with Stat-3 antibody; lower panel probe with Stat-3 antibody and protein complex pulled down with c-Jun antibody) supported our contention from the chromatin immunoprecipitation findings that cJun and STAT-3 were complexed together on the periostin promoter. Taken together, these data clearly demonstrate that the transcription factors cJun and STAT-3 synergistically interact and are part of a larger transcription-regulatory complex enhancing the periostin gene expression.
Type I Collagen-I expression following activation of fibroblasts with periostin supernatant
Both TNFα and IL-17 have been implicated in collagen deposition in liver fibrosis. Periostin being a secretory protein should be secreted into the supernatant by the HepG2 cells following cytokine stimulation. We therefore determined the direct periostin mediated fibrotic effect of TNF and IL-17 by treating the fibroblasts with supernatants taken from the HepG2 cells treated with TNFα, or IL-17, or both. The HepG2 cells were first stimulated by either TNFα, or IL-17, or both for 48 hours, following which the cells were washed and the fresh media with not stimulating cytokines was added. The supernatant from this replaced media was obtained after 24 hours and utilized for periostin quantization and fibroblast stimulation. As shown figure 4A, following treatment of HepG2 cells with TNFα and IL-17 there was increased in the secretion of the periostin into the supernatant (4.3 ± 0.52 µg/mL), as compared with individual TNFα (1.2 ± 0.26 µg/mL) or IL-17 (1.3 ± 0.31 µg/mL) stimulation. Normal neonatal human fibroblasts (figure 4B) and normal adult human dermal fibroblasts (figure 4C) were treated with supernatant for untreated HepG2 cells showed basal level of type I collagen expression (1.0±0.3 fold). The normal neonatal human fibroblasts (figure 4D) treated with supernatant from HepG2 cells treated with TNFα (2.4±0.5 fold, p<0.05) and IL-17 (3.3±0.4 fold, p<0.05) increase in collagen type I expression. As expected, the fibroblasts treated with supernatant from HepG2 cells co-treated with TNFα and IL-17 (9.1±1.8 fold, p<0.01) increase in collagen type I expression. Sircol color assay for the soluble collagen expression from normal neonatal human fibroblasts (figure 4E) demonstrated that treatment of these cells with supernatant from HepG2 cells induced basal levels of collagen expression (2.7±0.6 µg/mL) while supernatant from HepG2 cells treated with TNFα (5.2±0.9 µg/mL, p<0.05), IL-17 (5.9±1.1 µg/mL, p<0.05), and TNFα and IL-17 (10.1±2.3 µg/mL, p<0.01) induced enhanced collagen expression. Similarly normal human adult dermal fibroblasts (figure 4F) treated with supernatant from HepG2 cells treated with TNFα (1.7±0.4 fold, p<0.05) and IL-17 (2.1±0.5 fold, p<0.05) increase in collagen type I expression. As expected, the normal human adult dermal fibroblasts treated with supernatant from HepG2 cells co-treated with TNFα and IL-17 (6.1±1.1 fold, p<0.01) increase in collagen type I expression. Sircol color assay for the soluble collagen expression from normal human adult dermal fibroblasts (figure 4G) demonstrated that treatment of these cells with supernatant from HepG2 cells induced basal levels of collagen expression (0.6±0.2 µg/mL) while supernatant from HepG2 cells treated with TNFα (2.8±0.6 µg/mL, p<0.05), IL-17 (3.9±0.7 µg/mL, p<0.05), and TNFα and IL-17 (7.8±1.9 µg/mL, p<0.01) induced enhanced collagen expression. These findings from two different fibroblast cell lines confirm that TNFα and IL-17 induce periostin mediated fibrosis which might potentially explain for the inflammatory cytokine mediated liver fibrosis in cirrhotic patients.
Figure 4.
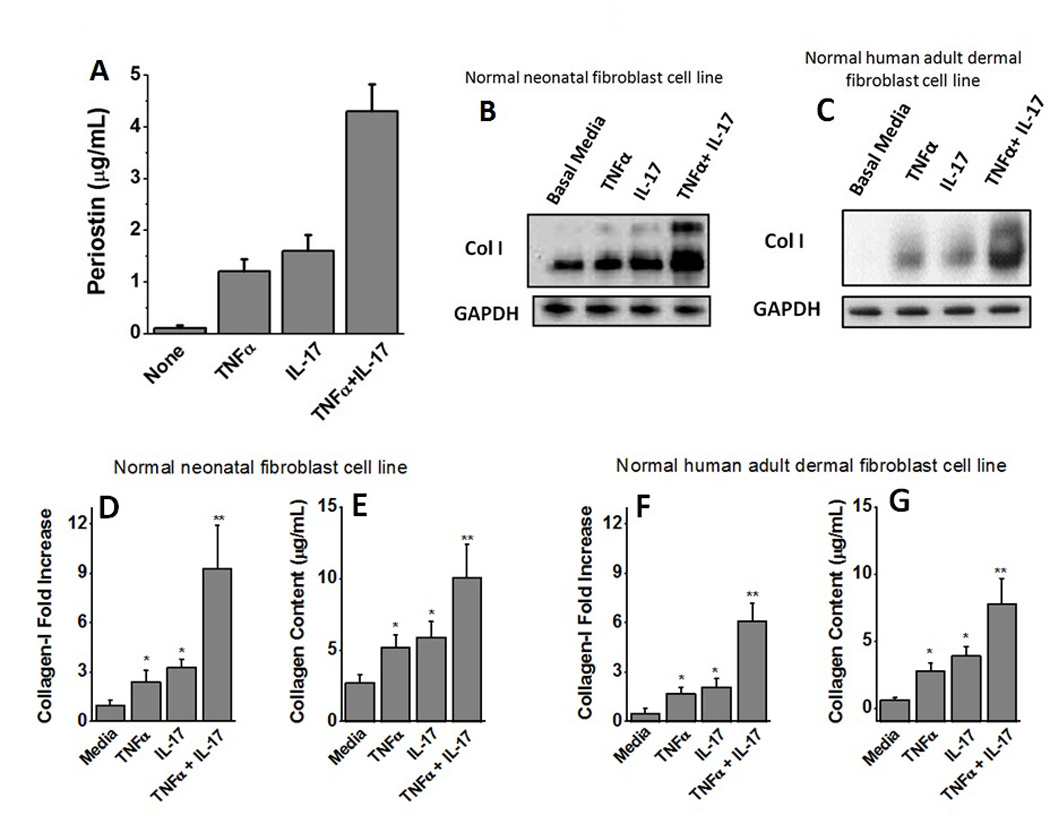
Induction of Collagen expression following activation of fibroblasts with periostin rich supernatant. (A) Quantitative ELISA analysis of the periostin secreted into the supernatant by HepG2 cells following stimulation with TNFα, or IL-17, or both. (B) Western blot analysis of the Type-I Collagen expressed by the normal neonatal human fibroblasts following treatment with supernatant from HepG2 cells stimulated with TNFα, or IL-17 or both. (C) Western blot analysis of the Type-I Collagen expressed by the normal adult human dermal fibroblasts following treatment with supernatant from HepG2 cells stimulated with TNFα, or IL-17 or both. (D) Densitometric analysis to determine quantitative expression of Collagen-I in normal neonatal human fibroblasts (under various conditions mentioned in B). (E) Sircol assay to demonstrate the expression of soluble collagen by fibroblasts in normal neonatal human fibroblasts (under various conditions mentioned in B). (F) Densitometric analysis to determine quantitative expression of Collagen-I in normal adult human dermal fibroblasts (under various conditions mentioned in C). (G) Sircol assay to demonstrate the expression of soluble collagen by fibroblasts in normal adult human dermal fibroblasts (under various conditions mentioned in C). All data represented as mean values ± SEM from four independent experiments.
Discussion
Liver fibrosis and cirrhosis represent the final common pathway of all chronic liver diseases (Xu et al., 2012). It results in liver failure and portal hypertension and is associated with an increased risk of liver cancer (Gines et al., 2004). Advanced hepatic fibrosis is characterized by an accumulation of type I and III collagens (Iredale, 2007). Further, models of liver fibrosis, which include cell culture, animal and explanted human tissue, have demonstrated that live fibrosis is a highly dynamic example of solid organ wound healing (Bataller and Brenner, 2005). Currently the only effective available treatment for cirrhosis is liver transplantation (Murray and Carithers, 2005). However, shortages of organs and the presence of concurrent diseases in the donors limit the availability of this treatment to all patients (Murray and Carithers, 2005). Clearly, development of novel anti-fibrotic therapies are needed to improve the morbidity and mortality of these patients (Cohen-Naftaly and Friedman, 2011). Increased understanding of the pathogenesis of liver fibrosis in past two decades lead to the identification of the main cellular effectors of liver fibrosis, the key cytokines regulating the fibrotic process, and the determinants of ECM turnover, highlighting an array of potential therapeutic approaches that could be developed in the near future (Cohen-Naftaly and Friedman, 2011).
Evidence on the role of periostin in liver diseases is limited. To date, the majority of reports on periostin in liver have ben predominantly from liver tumors and bile duct carcinomas (Riener et al., 2010). However, periostin has been extensively studied in various inflammatory lung diseases. Takayama et al (Takayama et al., 2006) using a murine model for bronchial asthma have demonstrated that periostin plays a key role in alveolar sup-epithelial fibrosis under stimulation of pro-inflammatory cytokines IL-4 and IL-13. Later studies by Fahy and colleagues (Woodruff et al., 2007; Woodruff et al., 2009) have confirmed the upregulation of periostin in asthma patients. The pathological role of periostin and the precise molecular mechanisms leading to inflammation induced upregulation of periostin still remain unknown. In line with these published data, our current studies demonstrate that pro-inflammatory cytokines TNFα and IL-17 work synergistically towards enhanced expression of periostin (figure 1) in HepG2 cells, thus suggesting a potential role of periostin in liver inflammatory injury. Furthermore, it of interest to note that, not just limited to liver, the synergistic effect of TNFα and IL-17 have also been noted in other inflammatory diseases such as psoriasis leading to altered keratinocyte differentiation (Chiricozzi et al., 2011).
Inflammatory cytokines, TNFα and IL-17, have been implicated in several fibrotic and liver diseases (Osawa et al., 2013; Tang et al., 2011). Therefore, in our current report we studied the molecular events leading to the upregulation of periostin in liver cells following stimulation with pro-inflammatory cytokines TNF and IL-17. Murine TNFα receptor knock out models have demonstrated that TNFα stimulated collagen synthesis, increased expression of TIMP-1, and decreased activity of MMP-2 (Theiss et al., 2005; Verrecchia et al., 2002). Similar to TNFα, Meng et al. (Meng et al., 2012), using a murine liver fibrosis model have demonstrated that hepatic stellate cells activation by IL-17 induces collagen deposition and fibrosis using a STAT-3 signaling mechanism. In our current studies we demonstrated that TNFα and IL-17 exert synergistic effect towards enhanced expression of periostin. TNFα induced expression of periostin through the transcription factor c-Jun, while IL-17 induced expression through STAT-3 (figure 3). Both these transcription factors act on the periostin promoter forming a transcription regulator complex, and there by inducing periostin expression (Figure 4). We have previously demonstrated that STAT-3 plays a criticial role in IL-6 induced CCL2 expression in hepatitis patients developing cirrhosis and acute liver failure (Sarma et al., 2014). In line with our current studies, Kluwe et al (Kluwe et al., 2010) have previously demonstrated that in carbon tetrachloride induced murine liver fibrosis model, inhibition of c-Jun inhibits the development and progression of hepatic fibrosis. Further, it is of interest to note that patients with chronic hepatitis C who displayed decreased fibrosis in response to the angiotensin receptor type 1 blocker losartan showed decreased cJun expression and phosphorylation (Kluwe et al., 2010). The role of IL-17 mediated collagen deposition in a matrix metaloproteinase (MMP) mediated manner was also established in other chronic inflammatory diseases such as rheumatoid arthritis (Koshy et al., 2002). The c-Jun/JNK pathway is known to induce fibrosis in kidney (Ma et al., 2007) and lung diseases (Tiriveedhi et al., 2012a). Previous studies in our lung transplant models demonstrated that cJun activation by hypoxia inducble factor (HIF1α) potentially induced VEGF upegulation with potential fibrotic effect (Tiriveedhi et al., 2012a). Prele et al have demonstrated that STAT-3 is the key central factor in inducing idiopathic pulmonary disease, a fibrotic lung disease (Prele et al., 2012). Transcription factor STAT-3 is involved in JAK/STAT signaling pathway. Mice with STAT-3-deficient hepatocytes exhibit defects in their ability to induce acute phase response genes such as, serum amyloid protein, fibrinogen, haptoglobin, serum amyloid A protein, and hemopexin in response to inflammatory cytokine activation (Alonzi et al., 2001). This body of evidence along with our current studies strongly suggest the potential application of periostin, c-Jun, and STAT-3 as potential fibrotic biomarkers with potential anti-fibrotic drug target application. Our current study was limited with the high concentration of cytokines needed for cell culture studies. Therefore further studies in animal models and human diseases studies are warranted.
Conclusion
Currently, liver biopsy is the only clinical diagnostic method for diagnosis of liver fibrosis (Bataller and Brenner, 2005). Although this technique has the advantage of staging the liver fibrosis, characterizing the parenchymal architecture, a number of inherent problems also limit the accuracy of liver biopsy in determining fibrosis stage (Adams, 2011). It has been estimated a standard liver biopsy represents 1/50 000th of the liver, and thus sampling error is a significant problem (Adams, 2011). The mere invasive nature of this procedure, limits the use only on patients with high degree of suspicion. A development of less-invasive fibrotic biomarker detection strategy would be a futuristic diagnostic strategy. Using indirect liver enzyme markers such as aminotransferases would not be a good marker for fibrotic activity (Rosenberg et al., 2004). Currently, inflammatory cytokine levels (TNFα, TGFβ etc) are the employed as anecdotal markers of fibrotic activity (Rosenberg et al., 2004). Periostin being a secretory protein could be a potential biomarker for liver fibrosis. Further clinical research to ascertain the sensitivity and specificity of periostin as a novel fibrotic biomarker could be immensely beneficial in the early diagnosis of patients potentially developing liver fibrosis.
Research Highlights.
TNFα, and IL-17 have been implicated in the pathogenesis of liver fibrosis.
TNFα through induction of cJun and IL-17 through induction of STAT-3 exert a synergistic effect on the expression of periostin.
Periostin induces collagen deposition.
Therefore, periostin could be used a novel biomarker for early liver fibrosis.
Acknowledgement
Financial Support: This work was supported by NIH 5U54CA163066-03 Cancer partnership (Vanderbilt University and Tennessee State University); NIH MARC grant 2T24GM007663-33 (Tennessee State University); TLSAMP NSF HRD-1305062 (Tennessee State University); and NIH/R15 DK091009 (MTI). The authors thank Department of Biological Sciences, Tennessee State University for the kind support on this project.
Abbreviations
- TNF
Tumor Necrosis Factor
- IL
Interleukin
- HepG2
Liver hepatocellular carcinoma cell line
- EDTA
ethylenediaminetetraacetic acid
- DTT
Dithiothreitol
- NaCl
Sodium Chloride
- NaF
Sodium Fluoride
- ChIP
Chromatin Immunoprecipitation
- qRT-PCR
quantitative real time polymerase chain reaction
- cJun
c-Jun N-terminal kinases
- MMP
matrix metaloproteinase
Footnotes
Publisher's Disclaimer: This is a PDF file of an unedited manuscript that has been accepted for publication. As a service to our customers we are providing this early version of the manuscript. The manuscript will undergo copyediting, typesetting, and review of the resulting proof before it is published in its final citable form. Please note that during the production process errors may be discovered which could affect the content, and all legal disclaimers that apply to the journal pertain.
Conflict of Interest: The authors have no conflict of interest.
Bibliography
- Adams LA. Biomarkers of liver fibrosis. J Gastroenterol Hepatol. 2011;26:802–809. doi: 10.1111/j.1440-1746.2010.06612.x. [DOI] [PubMed] [Google Scholar]
- Alonzi T, Maritano D, Gorgoni B, Rizzuto G, Libert C, Poli V. Essential role of STAT3 in the control of the acute-phase response as revealed by inducible gene inactivation [correction of activation] in the liver. Mol Cell Biol. 2001;21:1621–1632. doi: 10.1128/MCB.21.5.1621-1632.2001. [DOI] [PMC free article] [PubMed] [Google Scholar]
- Argo CK, Northup PG, Al-Osaimi AM, Caldwell SH. Systematic review of risk factors for fibrosis progression in non-alcoholic steatohepatitis. J Hepatol. 2009;51:371–379. doi: 10.1016/j.jhep.2009.03.019. [DOI] [PubMed] [Google Scholar]
- Asselah T, Bieche I, Laurendeau I, Paradis V, Vidaud D, Degott C, Martinot M, Bedossa P, Valla D, Vidaud M, Marcellin P. Liver gene expression signature of mild fibrosis in patients with chronic hepatitis C. Gastroenterology. 2005;129:2064–2075. doi: 10.1053/j.gastro.2005.09.010. [DOI] [PubMed] [Google Scholar]
- Bataller R, Brenner DA. Liver fibrosis. J Clin Invest. 2005;115:209–218. doi: 10.1172/JCI24282. [DOI] [PMC free article] [PubMed] [Google Scholar]
- Chiricozzi A, Guttman-Yassky E, Suarez-Farinas M, Nograles KE, Tian S, Cardinale I, Chimenti S, Krueger JG. Integrative responses to IL-17 and TNF-alpha in human keratinocytes account for key inflammatory pathogenic circuits in psoriasis. J Invest Dermatol. 2011;131:677–687. doi: 10.1038/jid.2010.340. [DOI] [PubMed] [Google Scholar]
- Cohen-Naftaly M, Friedman SL. Current status of novel antifibrotic therapies in patients with chronic liver disease. Therap Adv Gastroenterol. 2011;4:391–417. doi: 10.1177/1756283X11413002. [DOI] [PMC free article] [PubMed] [Google Scholar]
- Czaja AJ. Hepatic inflammation and progressive liver fibrosis in chronic liver disease. World J Gastroenterol. 2014;20:2515–2532. doi: 10.3748/wjg.v20.i10.2515. [DOI] [PMC free article] [PubMed] [Google Scholar]
- Friedman SL. Mechanisms of hepatic fibrogenesis. Gastroenterology. 2008;134:1655–1669. doi: 10.1053/j.gastro.2008.03.003. [DOI] [PMC free article] [PubMed] [Google Scholar]
- Gabele E, Froh M, Arteel GE, Uesugi T, Hellerbrand C, Scholmerich J, Brenner DA, Thurman RG, Rippe RA. TNFalpha is required for cholestasis-induced liver fibrosis in the mouse. Biochem Biophys Res Commun. 2009;378:348–353. doi: 10.1016/j.bbrc.2008.10.155. [DOI] [PMC free article] [PubMed] [Google Scholar]
- Gasse P, Riteau N, Vacher R, Michel ML, Fautrel A, di Padova F, Fick L, Charron S, Lagente V, Eberl G, Le Bert M, Quesniaux VF, Huaux F, Leite-de-Moraes M, Ryffel B, Couillin I. IL-1 and IL-23 mediate early IL-17A production in pulmonary inflammation leading to late fibrosis. PLoS One. 2011;6:e23185. doi: 10.1371/journal.pone.0023185. [DOI] [PMC free article] [PubMed] [Google Scholar]
- Gines P, Cardenas A, Arroyo V, Rodes J. Management of cirrhosis and ascites. N Engl J Med. 2004;350:1646–1654. doi: 10.1056/NEJMra035021. [DOI] [PubMed] [Google Scholar]
- Hamilton DW. Functional role of periostin in development and wound repair: implications for connective tissue disease. J Cell Commun Signal. 2008;2:9–17. doi: 10.1007/s12079-008-0023-5. [DOI] [PMC free article] [PubMed] [Google Scholar]
- Hayashi H, Sakai T. Animal models for the study of liver fibrosis: new insights from knockout mouse models. Am J Physiol Gastrointest Liver Physiol. 2011;300:G729–G738. doi: 10.1152/ajpgi.00013.2011. [DOI] [PMC free article] [PubMed] [Google Scholar]
- Iredale JP. Models of liver fibrosis: exploring the dynamic nature of inflammation and repair in a solid organ. J Clin Invest. 2007;117:539–548. doi: 10.1172/JCI30542. [DOI] [PMC free article] [PubMed] [Google Scholar]
- Kluwe J, Pradere JP, Gwak GY, Mencin A, De Minicis S, Osterreicher CH, Colmenero J, Bataller R, Schwabe RF. Modulation of hepatic fibrosis by c-Jun-N-terminal kinase inhibition. Gastroenterology. 2010;138:347–359. doi: 10.1053/j.gastro.2009.09.015. [DOI] [PMC free article] [PubMed] [Google Scholar]
- Koshy PJ, Henderson N, Logan C, Life PF, Cawston TE, Rowan AD. Interleukin 17 induces cartilage collagen breakdown: novel synergistic effects in combination with proinflammatory cytokines. Ann Rheum Dis. 2002;61:704–713. doi: 10.1136/ard.61.8.704. [DOI] [PMC free article] [PubMed] [Google Scholar]
- Ma FY, Flanc RS, Tesch GH, Han Y, Atkins RC, Bennett BL, Friedman GC, Fan JH, Nikolic-Paterson DJ. A pathogenic role for c-Jun amino-terminal kinase signaling in renal fibrosis and tubular cell apoptosis. J Am Soc Nephrol. 2007;18:472–484. doi: 10.1681/ASN.2006060604. [DOI] [PubMed] [Google Scholar]
- MacEwan DJ. TNF receptor subtype signalling: differences and cellular consequences. Cell Signal. 2002;14:477–492. doi: 10.1016/s0898-6568(01)00262-5. [DOI] [PubMed] [Google Scholar]
- Meng F, Wang K, Aoyama T, Grivennikov SI, Paik Y, Scholten D, Cong M, Iwaisako K, Liu X, Zhang M, Osterreicher CH, Stickel F, Ley K, Brenner DA, Kisseleva T. Interleukin-17 signaling in inflammatory, Kupffer cells, and hepatic stellate cells exacerbates liver fibrosis in mice. Gastroenterology. 2012;143:765–776. e761–e763. doi: 10.1053/j.gastro.2012.05.049. [DOI] [PMC free article] [PubMed] [Google Scholar]
- Miyamoto M, Prause O, Sjostrand M, Laan M, Lotvall J, Linden A. Endogenous IL-17 as a mediator of neutrophil recruitment caused by endotoxin exposure in mouse airways. J Immunol. 2003;170:4665–4672. doi: 10.4049/jimmunol.170.9.4665. [DOI] [PubMed] [Google Scholar]
- Murphy SL, Xu J, Kochanek KD. Deaths: final data for 2010. Natl Vital Stat Rep. 2010;61:1–117. [PubMed] [Google Scholar]
- Murray KF, Carithers RL., Jr AASLD practice guidelines: Evaluation of the patient for liver transplantation. Hepatology. 2005;41:1407–1432. doi: 10.1002/hep.20704. [DOI] [PubMed] [Google Scholar]
- Odeh M. Pathogenesis of hepatic encephalopathy: the tumour necrosis factor-alpha theory. Eur J Clin Invest. 2007;37:291–304. doi: 10.1111/j.1365-2362.2007.01778.x. [DOI] [PubMed] [Google Scholar]
- Odeh M, Sabo E, Srugo I, Oliven A. Relationship between tumor necrosis factor-alpha and ammonia in patients with hepatic encephalopathy due to chronic liver failure. Ann Med. 2005;37:603–612. doi: 10.1080/07853890500317414. [DOI] [PubMed] [Google Scholar]
- Oka T, Xu J, Kaiser RA, Melendez J, Hambleton M, Sargent MA, Lorts A, Brunskill EW, Dorn GW, 2nd, Conway SJ, Aronow BJ, Robbins J, Molkentin JD. Genetic manipulation of periostin expression reveals a role in cardiac hypertrophy and ventricular remodeling. Circ Res. 2007;101:313–321. doi: 10.1161/CIRCRESAHA.107.149047. [DOI] [PMC free article] [PubMed] [Google Scholar]
- Oku E, Kanaji T, Takata Y, Oshima K, Seki R, Morishige S, Imamura R, Ohtsubo K, Hashiguchi M, Osaki K, Yakushiji K, Yoshimoto K, Ogata H, Hamada H, Izuhara K, Sata M, Okamura T. Periostin and bone marrow fibrosis. Int J Hematol. 2008;88:57–63. doi: 10.1007/s12185-008-0095-2. [DOI] [PubMed] [Google Scholar]
- Osawa Y, Hoshi M, Yasuda I, Saibara T, Moriwaki H, Kozawa O. Tumor necrosis factor-alpha promotes cholestasis-induced liver fibrosis in the mouse through tissue inhibitor of metalloproteinase-1 production in hepatic stellate cells. PLoS One. 2013;8:e65251. doi: 10.1371/journal.pone.0065251. [DOI] [PMC free article] [PubMed] [Google Scholar]
- Prele CM, Yao E, O'Donoghue RJ, Mutsaers SE, Knight DA. STAT3: a central mediator of pulmonary fibrosis? Proc Am Thorac Soc. 2012;9:177–182. doi: 10.1513/pats.201201-007AW. [DOI] [PubMed] [Google Scholar]
- Riener MO, Fritzsche FR, Soll C, Pestalozzi BC, Probst-Hensch N, Clavien PA, Jochum W, Soltermann A, Moch H, Kristiansen G. Expression of the extracellular matrix protein periostin in liver tumours and bile duct carcinomas. Histopathology. 2010;56:600–606. doi: 10.1111/j.1365-2559.2010.03527.x. [DOI] [PubMed] [Google Scholar]
- Rosenberg WM, Voelker M, Thiel R, Becka M, Burt A, Schuppan D, Hubscher S, Roskams T, Pinzani M, Arthur MJ. Serum markers detect the presence of liver fibrosis: a cohort study. Gastroenterology. 2004;127:1704–1713. doi: 10.1053/j.gastro.2004.08.052. [DOI] [PubMed] [Google Scholar]
- Ruan K, Bao S, Ouyang G. The multifaceted role of periostin in tumorigenesis. Cell Mol Life Sci. 2009;66:2219–2230. doi: 10.1007/s00018-009-0013-7. [DOI] [PMC free article] [PubMed] [Google Scholar]
- Sarma NJ, Tiriveedhi V, Crippin JS, Chapman WC, Mohanakumar T. Hepatitis C virus-induced changes in microRNA 107 (miRNA-107) and miRNA-449a modulate CCL2 by targeting the interleukin-6 receptor complex in hepatitis. J Virol. 2014;88:3733–3743. doi: 10.1128/JVI.03060-13. [DOI] [PMC free article] [PubMed] [Google Scholar]
- Schuppan D, Afdhal NH. Liver cirrhosis. Lancet. 2008;371:838–851. doi: 10.1016/S0140-6736(08)60383-9. [DOI] [PMC free article] [PubMed] [Google Scholar]
- Sidhu SS, Yuan S, Innes AL, Kerr S, Woodruff PG, Hou L, Muller SJ, Fahy JV. Roles of epithelial cell-derived periostin in TGF-beta activation, collagen production, and collagen gel elasticity in asthma. Proc Natl Acad Sci U S A. 2010;107:14170–14175. doi: 10.1073/pnas.1009426107. [DOI] [PMC free article] [PubMed] [Google Scholar]
- Sudo K, Yamada Y, Moriwaki H, Saito K, Seishima M. Lack of tumor necrosis factor receptor type 1 inhibits liver fibrosis induced by carbon tetrachloride in mice. Cytokine. 2005;29:236–244. doi: 10.1016/j.cyto.2004.11.001. [DOI] [PubMed] [Google Scholar]
- Takayama G, Arima K, Kanaji T, Toda S, Tanaka H, Shoji S, McKenzie AN, Nagai H, Hotokebuchi T, Izuhara K. Periostin: a novel component of subepithelial fibrosis of bronchial asthma downstream of IL-4 and IL-13 signals. J Allergy Clin Immunol. 2006;118:98–104. doi: 10.1016/j.jaci.2006.02.046. [DOI] [PubMed] [Google Scholar]
- Tang Y, Bian Z, Zhao L, Liu Y, Liang S, Wang Q, Han X, Peng Y, Chen X, Shen L, Qiu D, Li Z, Ma X. Interleukin-17 exacerbates hepatic steatosis and inflammation in non-alcoholic fatty liver disease. Clin Exp Immunol. 2011;166:281–290. doi: 10.1111/j.1365-2249.2011.04471.x. [DOI] [PMC free article] [PubMed] [Google Scholar]
- Theiss AL, Simmons JG, Jobin C, Lund PK. Tumor necrosis factor (TNF) alpha increases collagen accumulation and proliferation in intestinal myofibroblasts via TNF receptor 2. J Biol Chem. 2005;280:36099–36109. doi: 10.1074/jbc.M505291200. [DOI] [PubMed] [Google Scholar]
- Tilg H, Kaser A, Moschen AR. How to modulate inflammatory cytokines in liver diseases. Liver Int. 2006;26:1029–1039. doi: 10.1111/j.1478-3231.2006.01339.x. [DOI] [PubMed] [Google Scholar]
- Tiriveedhi V, Gelman AE, Mohanakumar T. HIF-1 alpha signaling by airway epithelial cell K-alpha1-tubulin: Role in fibrosis and chronic rejection of human lung allografts. Cell Immunol. 2012a;273:59–66. doi: 10.1016/j.cellimm.2011.11.006. [DOI] [PMC free article] [PubMed] [Google Scholar]
- Tiriveedhi V, Takenaka M, Ramachandran S, Gelman AE, Subramanian V, Patterson GA, Mohanakumar T. T regulatory cells play a significant role in modulating MHC class I antibody-induced obliterative airway disease. Am J Transplant. 2012b;12:2663–2674. doi: 10.1111/j.1600-6143.2012.04191.x. [DOI] [PMC free article] [PubMed] [Google Scholar]
- Verrecchia F, Wagner EF, Mauviel A. Distinct involvement of the Jun-N-terminal kinase and NF-kappaB pathways in the repression of the human COL1A2 gene by TNF-alpha. EMBO Rep. 2002;3:1069–1074. doi: 10.1093/embo-reports/kvf219. [DOI] [PMC free article] [PubMed] [Google Scholar]
- Woodruff PG, Boushey HA, Dolganov GM, Barker CS, Yang YH, Donnelly S, Ellwanger A, Sidhu SS, Dao-Pick TP, Pantoja C, Erle DJ, Yamamoto KR, Fahy JV. Genome-wide profiling identifies epithelial cell genes associated with asthma and with treatment response to corticosteroids. Proc Natl Acad Sci U S A. 2007;104:15858–15863. doi: 10.1073/pnas.0707413104. [DOI] [PMC free article] [PubMed] [Google Scholar]
- Woodruff PG, Modrek B, Choy DF, Jia G, Abbas AR, Ellwanger A, Koth LL, Arron JR, Fahy JV. T-helper type 2-driven inflammation defines major subphenotypes of asthma. Am J Respir Crit Care Med. 2009;180:388–395. doi: 10.1164/rccm.200903-0392OC. [DOI] [PMC free article] [PubMed] [Google Scholar]
- Xu R, Zhang Z, Wang FS. Liver fibrosis: mechanisms of immune-mediated liver injury. Cell Mol Immunol. 2012;9:296–301. doi: 10.1038/cmi.2011.53. [DOI] [PMC free article] [PubMed] [Google Scholar]
- Zhu F, Wang Q, Guo C, Wang X, Cao X, Shi Y, Gao F, Ma C, Zhang L. IL-17 induces apoptosis of vascular endothelial cells: a potential mechanism for human acute coronary syndrome. Clin Immunol. 2011;141:152–160. doi: 10.1016/j.clim.2011.07.003. [DOI] [PubMed] [Google Scholar]
- Zimmermann HW, Trautwein C, Tacke F. Functional role of monocytes and macrophages for the inflammatory response in acute liver injury. Front Physiol. 2012;3:56. doi: 10.3389/fphys.2012.00056. [DOI] [PMC free article] [PubMed] [Google Scholar]