

Abstract
Wild-type transthyretin amyloidosis (ATTRwt), typically diagnosed as congestive heart failure in elderly Caucasian men, features myocardial amyloid deposits of wild-type plasma protein transthyretin (TTR). ATTRwt is sporadic, its pathogenesis is poorly understood, and currently there are no biomarkers for diagnosis or prognosis. Genetic studies of variant-associated transthyretin amyloidosis (ATTRm) have suggested that non-coding TTR gene variants modulate disease. We hypothesized that cis-acting regulatory elements in the TTR gene non-coding regions may modify expression, affecting ATTRwt onset and progression. We studied an ATTRwt cohort consisting of 108 Caucasian males ranging in age from 59–87 years with cardiomyopathy due to wild-type TTR deposition; results were compared to 118 anonymous controls matched by age, sex, and race. Four predicted non-coding regulatory regions and all exons in the TTR gene were sequenced using the Sanger method. Eleven common variants were identified; 3 variants were significantly associated with ATTRwt (p < 0.05), though only one, rs72922940, remained near significance (pcorrected = 0.083) after multiple testing correction. Exon analyses demonstrated the occurrence of the p.G26S (G6S) polymorphism in 7% of ATTRwt subjects and 12% of controls; this variant was predicted to be a protective factor (p = 0.051). Four variants were significantly associated with age at onset and survival. In this first genetic study of a large, well-characterized cohort of ATTRwt, non-coding and coding variants associated with disease, age at onset, and survival were identified. Further investigation is warranted to determine the prevalence of these variants in ATTRwt, their regulatory function, and potential role in assessing disease risk.
Keywords: amyloid, genetic variation, risk factor, transthyretin, aging, cardiac failure
Introduction
The systemic amyloidoses are a group of fatal protein misfolding diseases characterized by the extracellular deposition of ordered fibrils in the heart and other visceral organs (Kisilevsky 1991; Falk and Skinner 2000; Merlini and Westermark 2004). At least 28 separate proteins have been described as amyloidogenic (Sipe et al. 2010), each with the intrinsic ability to misfold, aggregate, and form the characteristic congophillic non-branching, beta-pleated sheet, amyloid fibrils. One group of systemic amyloidoses, abbreviated ATTR, is caused by fibrillar deposits of the liver-secreted plasma protein transthyretin (TTR), a carrier of thyroxine and binding partner of retinol binding protein (Rostom et al. 1998). The inherited forms of ATTR (ATTRm) are caused by pathologic coding variants in the TTR gene (Saraiva 2001; Connors et al. 2003) (http://amyloidosismutations.com/mut-attr.php). ATTRm generally presents as “familial amyloidotic cardiomyopathy” (FAC) or “familial amyloidotic polyneuropathy” (FAP), though many patients have deposits in both heart and nerve tissues. ATTR can also be caused by deposition of fibrils derived from wild-type TTR (ATTRwt, formerly known as senile systemic amyloidosis or SSA). ATTRwt most often presents as cardiomyopathy in elderly Caucasian men (Ng et al. 2005) and leads to progressive heart failure with a typical survival from onset of heart failure symptoms of less than 5 years (Connors et al. 2011). Once thought to be a rare disease, ATTRwt is increasingly recognized as a cause of heart failure in older men with diastolic dysfunction. Autopsy studies have demonstrated that TTR amyloid fibrils can be found in the hearts of 25% of elderly individuals over 80 years of age (Cornwell 3rd et al. 1983; Westermark et al. 2003; Tanskanen et al. 2008), suggesting that 2.5 million Americans (US Census 2012) could be at risk for this disease. Cardiomyopathy due to ATTRwt is likely under-recognized, as the clinical diagnosis depends upon appropriate interpretation of echocardiography or cardiac magnetic imaging while definitive pathologic diagnosis often requires an endomyocardial biopsy, which can pose significant risk in elderly patients.
In ATTRm, more than 100 pathologic amino acid substitutions have been reported (Connors et al. 2003). Some of the clinical features of disease such as preferential organ involvement and age at onset are dependent upon the variant. However, it has been observed that single variants can display different disease phenotypes. For example, ATTRm due to the p.V50M (V30M) substitution has a much earlier onset in patients from endemic areas of Portugal and Japan, compared to Sweden where onset generally occurs later in life (Zaros et al. 2008). It has recently been suggested that non-coding variants in cis-regulatory regions may impact expression of the TTR gene in ATTRm (Soares et al. 2004; Olsson et al. 2010; Polimanti et al. 2013); this cis-regulatory hypothesis is offered as an explanation for varying levels of penetrance, age at onset, disease severity, and sex differences, possibly correlating with serum TTR levels (Buxbaum et al. 2008; Buxbaum et al. 2010). One recent study investigating genetic variation in non-coding regions of the TTR gene implicated a haplotype containing upstream and downstream single nucleotide polymorphisms (SNPs) as a potential modulator of early disease onset in the Portuguese V30M ATTRm amyloidosis population (Soares et al. 2004), where disease development occurs in the 3rd and 4th decades of life. A later study found the T allele of SNP rs62093482 to be associated with Swedish V30M ATTRm amyloidosis (Olsson et al. 2010), where disease onset is usually reported after age 60; this SNP was located in a predicted miRNA binding site. The authors proposed that the presence of the T allele in this location acted as a protective factor, potentially explaining the observed late-onset penetrance of disease in the Swedish population. However, this suggested mechanism has not been confirmed by functional studies (Norgren et al. 2012). Another recent study determined significant ethnic differences in non-coding SNPs surrounding the TTR gene, particularly between haplotypes present in Africans and non-Africans. The authors proposed that some of these SNPs may be located in cis-regulatory regions and, therefore, may affect TTR gene function. Interestingly, a predicted TEAD1 binding site was identified which may be disrupted by the presence of SNP rs1791228 in cardiac muscle (Polimanti et al. 2013). Thus far, there have been no such genetic studies in ATTRwt.
Enhancer and promoter regions have been well characterized upstream of the TTR transcription initiation site in mice, and key transcription factor binding sites have been identified (Costa et al. 1986; Costa et al. 1988a; Courtois et al. 1988; Grayson et al. 1988; Costa et al. 1988b; Costa et al. 1989; Costa et al. 1990; Costa and Grayson 1991; Qian et al. 1995; Samadani et al. 1996); however, there is limited information for the human gene. It is known that the human TTR gene, located on chromosome 18, is approximately 10 Kb in length and contains a proximal promoter, 4 exons, and 3 introns (Sasaki et al. 1985; Tsuzuki et al. 1985). Some elements of the proximal promoter have been described, including both TATA and CAAT boxes (Sasaki et al. 1985; Tsuzuki et al. 1985; Sakaki et al. 1989), but enhancer regions have been incompletely characterized (Costa et al. 1989; Sakaki et al. 1989; Martinho et al. 2013). Sakaki et al. identified a possible homolog to the mouse enhancer approximately 3.5 Kb upstream of the transcription start site, where an intact HNF-4 binding site was located (Sakaki et al. 1989). Additionally, the region spanning approximately −50 to −190 Kb was found by the same group to be highly conserved between human and mouse (Sakaki et al. 1989). Several transcription factor binding sites crucial for hepatocyte-specific expression were identified within this region, including HNF-1, C/EBP, HNF-3, and HNF-4 (Costa et al. 1989; Sakaki et al. 1989). Moreover, many transcription factor binding sites upstream of the human TTR gene have been reported on ENCODE (Meyer et al. 2013) (http://genome.ucsc.edu/), though most have not been confirmed experimentally.
The presence of ethnic and gender differences in ATTR amyloidosis, along with the identification of potential regulatory SNPs in ATTRm, makes it plausible that TTR gene regulation plays an important role in ATTRwt pathogenesis. This study was aimed at identifying candidates for non-coding variants that might impact the development of ATTRwt through cis-regulatory mechanisms, and represents the first report of TTR gene non-coding regions in ATTRwt.
Materials and Methods
Study subjects
The ATTRwt cohort consisted of 108 self-identified Caucasian males with biopsy proof of ATTRwt, referred to the Boston University Amyloidosis Center Clinic for evaluation between 1994 and 2014. Informed consent for data and sample collection was obtained from patients with the approval of the Boston University Medical Campus Institutional Review Board (IRB). Clinical, laboratory, and echocardiography data were obtained from an IRB-approved database of amyloidosis patients. An initial diagnosis of amyloidosis was made by Congo red staining of a tissue biopsy from the affected organ(s) that demonstrated fibrils with apple-green birefringence by polarized light microscopy. ATTR amyloidosis was established with biochemical or immunochemical proof of TTR as the major component of the amyloid deposit; all ATTRwt subjects in this study had TTR-positive amyloid fibrils. ATTRm amyloidosis was excluded in both the ATTRwt and control groups by complete exonic sequencing of the TTR gene which verified the absence of pathologic variants. Except for the presence of the non-pathologic p.G26S (G6S) polymorphism (Fitch et al. 1991) in several ATTRwt and control cases, subjects contained only wild-type TTR. Cardiac involvement, identified in the majority of ATTRwt subjects, was defined by an interventricular septal wall thickness (IVST) > 12 mm on echocardiogram and serum B-type natriuretic peptide (BNP) > 100 pg/mL. Extracardiac involvement was determined by biopsy of the affected tissue, i.e. bladder, stomach, or antrum, and the presence of associated bladder or gastrointestinal symptoms.
The control group consisted of 118 healthy individuals who were matched by ethnicity, sex, and age to ATTRwt subjects. Clinical data for control subjects were not available; however, to limit the possibility of confounders, we requested the provider to select only blood samples from individuals over age 60, with no history of heart disease, no family history of Alzheimer’s Disease, and a general assessment of “healthy.” Using the genetic power calculator (http://pngu.mgh.harvard.edu/~purcell/gpc/), we determined that this sample size is sufficient to detect a single SNP association with a large effect (90% power for a SNP with a relative risk of 2 and a minor allele frequency of 0.10).
Target region selection
Four target non-coding regions were selected to cover approximately 7 Kb in cumulative length encompassing predicted regulatory regions up- and down-stream of the TTR gene and spanning a total length of 20 Kb (Figure 1). Target regions were selected based on strong evidence of potential cis-regulatory capabilities either by prediction programs or literature reports.
Figure 1.
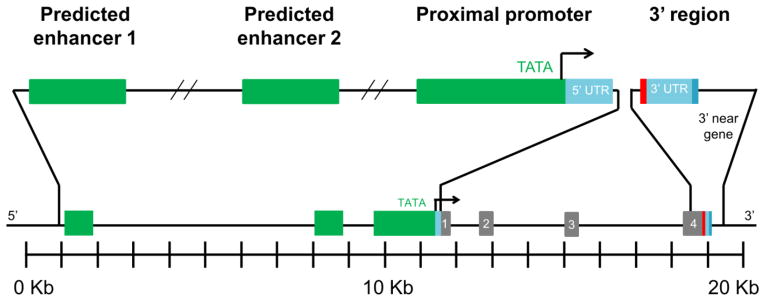
Target non-coding regions selected for analysis. Segments spanned a 20 Kb region and totaled 7 Kb in sequencing length; depiction is to scale. The upstream regions encompassed two distal predicted enhancers, in green, located 10.6 Kb to −9.9 Kb and −3.8 Kb to −2.6 Kb upstream of the transcription start site; as well as the proximal promoter which incorporated approximately 2 Kb immediately upstream of the gene along with the 5′ untranslated region (UTR), in light blue, the promoter, in green, and some of the 5′ near gene non-coding region. The downstream segment included approximately 1 Kb immediately downstream of the gene which encompassed the 3′ UTR, in light blue, and the proximal near gene region. These four target non-coding regions were sequenced, as well as all four exons, shown in gray. Red indicates the location of the stop cordon; darker blue is the location of the poly-A signal at the end of the 3′ UTR. The transcription start site is indicated with an arrow.
Two predicted enhancer target regions were chosen, located approximately −10.6 Kb to −9.9 Kb and −3.8 Kb to −2.6 Kb upstream of the gene; these were designated predicted enhancer 1 and 2, respectively. Predicted enhancer 1 was selected for its homology to the mouse enhancer (Costa et al. 1989) as determined by a CLUSTALW (https://www.ebi.ac.uk/Tools/msa/clustalw2/) nucleotide sequence alignment. The selection of predicted enhancer 2 was based on the identification of a sequence homologous to the mouse enhancer (Costa et al. 1989) with an intact HNF-4 binding site (Sakaki et al. 1989) in the region, as well as a high density of predicted transcription factor binding sites by ENCODE (Meyer et al. 2013), Matinspector (Cartharius et al. 2005) (http://www.genomatix.de/online_help/help_matinspector/matinspector_help.html), and MATCH (Wingender 2008) (http://www.gene-regulation.com/pub/programs.html#match) programs.
The proximal promoter target encompassed approximately 2 Kb immediately upstream of the gene, consisting of the 5′ untranslated region (UTR), the promoter, and some of the 5′ near gene non-coding region; this region is highly homologous to the mouse promoter (Costa et al. 1989), and several transcription factor binding sites in this region have been confirmed including HNF and C/EBP (Sakaki et al. 1989). In addition, several transcription factor binding sites in this region have been predicted by ENCODE (Meyer et al. 2013), Matinspector (Cartharius et al. 2005), and MATCH (Wingender 2008).
The downstream target, termed 3′ region, spanned approximately 1 Kb immediately downstream of the TTR gene; this stretch encompassed the 3′ UTR and the proximal near gene region. Selection of this area was based on a report implicating the 3′ UTR as a modulator of V30M ATTR (Olsson et al. 2010).
Genomic DNA isolation and sequencing
Blood was obtained from patients at initial visit to the Amyloidosis Center Clinic, separated from plasma, and stored at −80 °C in RNAlater (Life Technologies, Grand Island, NY). Control blood, purchased from StemExpress (Placerville, CA) and Bioreclamation (Westbury, NY), was also stored at −80 °C. Genomic DNA was extracted using a Qiagen (Venlo, Netherlands) Blood and Body Fluids DNA Extraction kit, and subsequently stored at −20 °C.
Primers designed to encompass exons and target regions (Online Resource 2, Supplementary Table S1) were used for amplification by polymerase chain reaction (PCR), as well as sequencing by Sanger method in both forward and reverse directions (Genewiz, South Plainfield, NJ). A more detailed description of the PCR protocol can be found in Online Resource 1, Supplementary Methods.
Single nucleotide polymorphism genotyping
Nucleotide sequence chromatograms were analyzed for genotypes using Mutation Surveyor (State College, PA). Nucleotide variations in ATTRwt and control subjects were identified by comparison to published data on dbSNP (http://www.ncbi.nlm.nih.gov/SNP/). All SNPs were tested for Hardy-Weinberg equilibrium (HWE) in the control group.
Statistical genetic analysis
Only SNPs with 5% minor allele frequency (MAF) or higher were analyzed. Single-marker associations with ATTRwt were determined using the allele test, with significance determined by the chi-square test for independence, computed in PLINK (Purcell et al. 2007) (version 1.07, http://pngu.mgh.harvard.edu/purcell/plink/). Multiple testing adjusted significance (pcorrected) incorporating the number of variants and the linkage disequilibrium (LD; i.e. non-independence) between them were computed using PLINK’s max(T) permutation procedure. Regression analysis in PLINK was used to condition on specific alleles (by including them as covariates) to explore whether or not significant SNP effects were independent or a result of LD. Haplotypes were computed between the common SNPs using Haploview (Barrett et al. 2005) and PLINK; the latter was calculated using groups of two, three, and four. An association graph was computed using LocusZoom (Pruim et al. 2010) (http://csg.sph.umich.edu/locuszoom/); LD information presented in the plot was based on 1000 genomes reference data.
Clinical features
Correlations between SNPs and clinical features were examined within the ATTRwt group using a regression analysis computed with PLINK. Clinical features included ages at disease onset and diagnosis, survival measured from date at onset or diagnosis; moreover, several baseline markers of cardiac involvement were examined. These markers included serum levels of BNP and cardiac troponin (cTn-I); and echocardiaographic measures of IVST, left ventricular (LV) end-diastolic (LVEDD) and end-systolic diameters (LVESD), LV ejection fraction (LVEF), and LV mass index.
Functional predictions
Potential functionality of SNPs associated with ATTRwt was assessed using the is-rSNP database (Macintyre et al. 2010) (http://bioinformatics.research.nicta.com.au/software/is-rsnp/) which predicts transcription factor binding sites that are disrupted by one allele of a SNP. Reported hits were known liver transcription factors (with the exception of TEAD1, a disrupted cardiac transcription factor binding site previously reported in ATTR (Polimanti et al. 2013)) with an adjusted significance of p < 0.05. Despite the identification of specific factors by the is-rSNP (Macintyre et al. 2010) program, the authors of the program suggest there is more confidence that a member of the identified family binds to the location, due to similarities in binding recognition sites within families. Transcription factor binding profiles from the JASPAR database (Mathelier et al. 2014) (http://jaspar.genereg.net/) were utilized in comparison to the SNP and surrounding sequence for each allele as a tool to further support is-rSNP results.
Results
ATTRwt and control group characteristics
The ATTRwt group consisted of 108 self-identified Caucasian males with biopsy proof of wild-type TTR amyloidosis (Table 1). The median age at onset of symptoms, as reported by the patient upon initial visit to the Amyloidosis Clinic, was 73.1 years with a range of 58.8–86.6 years (Table 1a). The median (range) age at diagnosis was 75.1 years (59.0–87.5). The TTR gene in all subjects was entirely wild-type, except for the non-pathologic (Fitch et al. 1991) G6S substitution which was present on one allele in 8 ATTRwt subjects; 15 controls were found to carry the same substitution of which 11 were heterozygotes, and 4 were homozygotes (Table 1b).
Table 1.
Subject Characteristics
| a. Demographics | ATTRwt (n = 108) | Control (n = 118) | |
|---|---|---|---|
| Age at onset, y | Median (range) | 73.1 (58.8–86.6) | above 60 |
| Age at diagnosis, y | Median (range) | 75.1 (59.0–87.5) | |
| Sex, n | Male | 108 | 118 |
| Ethnicity, n | Caucasian | 108 | 118 |
|
| |||
|
b. Clinical and Laboratory Features
| |||
| Congo red positive biopsy, n | 108 | ||
| TTR biochemical proof in biopsy, n | 108 | ||
| TTR gene variant, n (%) | G6S heterozygotes | 8 (7.4) | 11 (9.3) |
| G6S homozygotes | 4 (3.4) | ||
| Organ involvement, n (%) | Cardiac | 105 (97.2) | |
| Extracardiac | 3 (2.8) | ||
| Deceased, n (%) | 66 (61.1) | ||
| Survival (onset to death), y | Median (range) | 4.8 (1.5–12.7) | |
| Survival (diagnosis to death), y | Median (range) | 3.1 (0.3–8.9) | |
|
| |||
|
c. Markers of Cardiac Involvement, Median (Range)
| |||
| B-type meteoritic peptide, pg/mL | 411 (52–1756) | ||
| Cardiac troponin, nag/mL | 0.127 (0.020–1.198) | ||
| Interventricular septal thickness, mm | 16 (9–25) | ||
| Left ventricular mass index, gm/m2 | 150.4 (57.9–308.5) | ||
| Left ventricular ejection fraction, % | 49 (10–70) | ||
| Left ventricular end diastolic diameter, mm | 45 (28–57) | ||
| Left ventricular end systolic diameter, mm | 34 (21–50) | ||
The majority (105 of 108) of the cohort presented with dominant cardiac involvement; three subjects had no evidence of cardiac amyloid. These patients exhibited symptoms of extracardiac amyloid; biopsies of the bladder, stomach, or antrum demonstrated congophillic deposits composed of TTR fibrils. Data on these patients were representative of the entire group, including age at onset and survival; one patient was found to be heterozygous for the G6S mutation. Results of single-marker analysis excluding these three subjects were similar to those reported for the entire cohort of 108 subjects.
Median (range) survival of the ATTRwt group measured from onset of heart failure symptoms was 4.8 years (1.5–12.7); median survival measured from diagnosis was 3.1 years, ranging from 0.3 to 8.9 years. Median (range) values for measures of cardiac involvement BNP and IVST were 411 pg/mL (52–1756) and 16 mm (9–25), respectively (Table 1c). Additional measures of cardiac structure and function listed in the table include cTn-I, LV mass index, LVEF, LVEDD, and LVESD.
Single-marker results
Thirty-eight previously reported variants were identified within the non-coding target regions, of which 10 were common (MAF > 5%); in addition, one common coding variant was identified, rs1800458. All variants were within HWE in the control group except for rs1800458 (p < 0.0001), a G to A nucleotide change in exon 2 corresponding to the non-pathologic G6S protein variant (Fitch et al. 1991). Of the 11 common variants identified (Supplementary Table 2), 9 were single nucleotide variations, one was a single nucleotide duplication (rs34047090), and one was a CA repeat (rs71383038). Three SNPs had significant p-values and odds ratios (OR) greater than 1, indicating the minor alleles were risk factors (Table 2); these were rs4799581 (p = 0.019, OR = 1.56 (1.07–2.27)), a T to C substitution located in predicted enhancer 1; rs72922940 (p = 0.013, OR = 2.05 (1.15–3.63)), an A to G substitution located in the proximal promoter; and rs3794885 (p = 0.044, OR = 1.47 (1.01–2.15)), an A to T substitution located in the proximal promoter. The non-pathologic SNP corresponding to the G6S protein variant, rs1800458, was predicted to be a protective factor with near-significance (p = 0.051, OR = 0.44 (0.19–1.03)). No single-marker associations survived a p-value cutoff of pcorrected < 0.05 after correction for multiple testing, however one SNP, rs72922940, remained significant with a cutoff of pcorrected < 0.10 (pcorrected = 0.083).
Table 2.
Summary of common SNPs having nominally significant (p < 0.05) associations with disease and clinical variables
| SNP | Location, Char 18a | Minor (Common) Alleles | ATTRwt, MAF | Control, MAF | Odds Ratio (95% CI) | P | Pcorrected | Clinical features
|
|||
|---|---|---|---|---|---|---|---|---|---|---|---|
| Age at onset | Survival from onset | ||||||||||
| Effect estimate | P | Effect estimate | P | ||||||||
| rs4799581 | 29161511 | C (T) | 0.49 | 0.38 | 1.56 (1.07–2.27) | 0.019 | 0.12 | 1.57 | 0.047 | −0.77 | 0.033 |
| rs3764479 | 29169825 | G (A) | 0.43 | 0.34 | 1.45 (0.99–2.12) | 0.057 | 0.32 | 1.66 | 0.035 | −0.79 | 0.031 |
| rs3764478 | 29170483 | T (G) | 0.12 | 0.13 | 1.11 (0.63–1.93) | 0.72 | 1 | 2.36 | 0.036 | −1.14 | 0.026 |
| rs72922940 | 29170698 | G (A) | 0.17 | 0.09 | 2.05 (1.15–3.63) | 0.013 | 0.083 | 0.19 | 0.87 | −0.93 | 0.064 |
| rs3794885 | 29171123 | T (A) | 0.44 | 0.35 | 1.47 (1.01–2.15) | 0.044 | 0.24 | 1.69 | 0.031 | −0.79 | 0.031 |
ssembly GRCh37.p13
The identified ATTRwt-associated variants that were nominally significant, (p < 0.05) including rs4799581, rs72922940, and rs3794885, were in varying levels of LD (Figure 2). Rs72922940 was in in moderate LD with rs4799581 (r2 = 0.192) and rs3794885 (r2 = 0.224), while the latter two were in higher LD with one another (r2 = 0.786). A conditional analysis supported the LD analysis: when conditioned on rs72922940, significance only slightly diminished for both rs4799581 and rs3794885 (p = 0.16, p = 0.35); and, when rs4799581 and rs3794885 were conditioned on one another (p = 0.22, p = 0.82), significance diminished more than for rs72922940 conditioned on either (p = 0.10, p = 0.081).
Figure 2.

Linkage disequilibrium plot of common single nucleotide polymorphisms (SNPs) associated with ATTRwt. A plot comparing associations from this study with 1000 genomes data was created using LocusZoom. SNPs are plotted along the horizontal axis by location on the chromosome (a map of the gene is shown at the bottom). The entire length of the horizontal axis spans 20 Kb both up- and down-stream of the TTR gene. The vertical axis reflects the significance and shows the recombination rate along the blue line. Shading for each SNP reflects r2 as indicated by the key.
No haplotypes identified by PLINK or Haploview were more significantly associated with ATTRwt than the single-marker analysis of rs72922940.
Association with clinical features
The 9 common SNPs were tested for association with clinical and laboratory features, and measures of cardiac involvement (Table 1b, 1c). The clinical features tested were ages at onset and diagnosis, survival, BNP, cTn-I, IVST, LV mass index, LVEF, LVEDD, and LVESD. Age at disease onset and survival measured from onset were found to be significantly associated with SNPs rs4799581 (p = 0.047, p = 0.033), rs3764479 (p = 0.035, p = 0.030), rs3764478 (p = 0.037, p = 0.026), and rs3794885 (p = 0.031, p = 0.030) (Table 2). For these SNPs, a positive trend was observed with age at onset, and a negative trend was observed with survival measured from onset. Results for rs3794885 are shown in Figure 3. (The remaining plots can be found in Online Resource 3, Supplementary Figure S1.) A conditional analysis of survival on age at onset decreased the significance to a small degree (p = 0.083, p = 0.076, p = 0.059, p = 0.076) suggesting that the associations with age at onset and survival from onset might be partially, but not entirely, due to the correlation between these two. Further, the effect estimates were comparable in the conditional and unconditional analyses (−0.77 and −0.63, −0.79 and −0.65, −1.14 and −0.97, −0.79 and −0.65). A graph comparing average survival from onset within each genotype for rs3794885 to age at onset by tertile (Figure 3c) demonstrates the negative relationship between the two variables. Having a T allele resulted in decreased survival within each age at onset tertile, with the greatest effect in the two higher textiles. It can be observed that as age at onset increases, the average survival for each genotype decreases, as well as the overall average survival. Further, the number of individuals having the TT genotype increases with age at onset, while the number of individuals having the AA genotype decreases. No other significant associations were observed between SNPs and any of the clinical features that were tested. Interestingly, the peak SNP for ATTRwt, rs72922940, was not associated with any clinical features.
Figure 3.

Representative clinical association plots for rs3794885. Box plots showing rs3794885 association with age at onset (a) and survival from onset (b) by genotype show a general positive and negative trend, respectively. Each plot shows the common genotype first, with the addition of minor alleles following from left to right. The relationship between age at onset and survival from onset by genotype is depicted (c) to illustrate the relationship between the two associations. Genotype is represented by color as shown in the key. The average was calculated by genotype per tertile as defined on the horizontal axis. The number of subjects having each genotype within the tertile which contributed to the calculated average is shown at the top of each bar.
Functional predictions
Several SNPs identified in this study may potentially disrupt predicted transcription factor binding sites, most of which are highly expressed in the liver (Table 3, Figure 4). A C/EBP binding site was predicted to be strongly disrupted by rs2420813 using both is-rSNP (p < 0.02) and JASPAR prediction strategies. The binding affinities of HNF3A, HNF3B, and AP-1 (either Foes or June subunits) were potentially disrupted by rs3764479; the HNF (FOX) family binding site disruption (p < 0.03) was confirmed by both prediction techniques, though the AP-1 disruption was only predicted by a comparison of the DNA sequence to the transcription factor binding profile from JASPAR. The is-rSNP program predicted a disruption of an HNF family site by rs3764478 (p < 0.03) which could not be confirmed by JASPAR comparison. Another HNF family binding site was predicted to be disrupted by rs72922940 (p < 0.05) using both methods. An HNF family binding site may also be disrupted by rs3794885 as predicted by is-rSNP (p < 0.04). The previously reported disruption of a TEAD1 binding site by rs1791228 (Polimanti et al. 2013) (p < 0.02) was also confirmed by both methods used in this study.
Table 3.
SNPs disrupting predicted transcription factor binding sites
| SNP | Transcription Factor | Adjusted P-value |
|---|---|---|
| rs2420813 | C/EBP-beta | 0.00741 |
| C/EBP | 0.0165 | |
| rs3764479 | FOXP1 | 0.0214 |
| rs3764478 | HNF1 | 0.00552 |
| HNF1 | 0.0164 | |
| HNF1 | 0.0234 | |
| rs72922940 | HNF6 | 0.00915 |
| HNF-4alpha | 0.0231 | |
| HNF4 | 0.0415 | |
| C/EBP | 0.0393 | |
| rs3794885 | HNF6 | 0.0336 |
| HNF4alpha1 | 0.0364 | |
| rs1791228 | TEAD1 | 0.0120 |
djusted p-values were determined by is-rSNP.
Figure 4.

Transcription factor binding sites potentially disrupted by TTR non-coding SNPs. Binding profile diagrams from JASPAR were matched manually to the gene sequence surrounding the indicated SNP, shown below the transcription factor binding profile. The SNP alleles are shown in red with the common allele listed first. SNP alleles that differ from taller letters in the binding profile have the largest potential impact.
Discussion
In this first genetic study of a large well-characterized ATTRwt cohort, 11 common SNPs in four non-coding target regions and one exon of the TTR gene were identified. The single-marker association tests identified three SNPs (rs4799581, rs72922940, rs3794885) that were associated with ATTRwt, although only rs72922940 remained near significance after a multiple-testing adjustment. Although no haplotypes had greater significance than the individual SNPs, rs72922940 and rs3794885 appeared to be driving any observed haplotype association. These two SNPs had the strongest evidence for being functional variants.
Multiple analyses strongly indicated that rs72922940 may be a functional variant; rs72922940 was the most significantly associated with disease by the allele test, it was the only SNP to remain close to significance after multiple testing correction, and it appeared to drive the haplotype and single-marker analyses. The functionality of this SNP was further implicated by the disruption of an HNF-family binding site in is-rSNP and JASPAR analyses, where the minor allele (G) was predicted to preferentially bind the transcription factor, resulting in increased TTR expression. Interestingly, rs72922940 was only nearly associated (p = 0.064) with survival measured from onset of symptoms, and not associated with any other clinical measures that were tested (p > 0.1).
Additionally, rs3794885 was significantly associated with disease by the allele test and present in many associated haplotypes, providing evidence that this is a potentially functional variant. This SNP was also found to be associated with age at onset of symptoms and survival measured from onset; functional analysis by is-rSNP predicted that rs3794885 disrupts an HNF family transcription factor binding site. Furthermore, rs4799581 and rs3794885 appeared to be in moderate LD with rs72922940, but in higher LD with one another. These results along with the conditional analyses indicate that there may be two loci of interest: one driven by rs72922940 which is a risk variant associated with disease and the strongest hit, and another driven by rs3794885 which is a clinical variant associated with measures of involvement, age at onset, and survival from onset. However, the LD in the region, along with the strength of the association data, made it difficult to determine which (if any) of these SNPs were causal, since none seemed to have an effect independent of the others.
Four SNPs (rs2420813, rs3764479, rs3764478, rs1791228) were predicted to disrupt transcription factor binding sites even though they failed to associate with ATTRwt by the allele test. C/EBP is predicted to preferentially bind the minor allele (C) of rs2420813, which would increase TTR expression; the major allele (A) of rs3764479 is preferred by both HNF and AP-1 with an unclear impact on expression; an HNF site is predicted to be disrupted by rs3764478; and, TEAD1 is predicted to preferentially bind to the minor allele (C) of rs1791228.
One variant, rs3764479, was associated with age at onset and survival, but only nearly associated with disease. It is likely that this variant acts as a genetic modifier to affect individuals once they develop disease although it seems to have little effect on disease development. This further supports our hypothesis that there are separate loci which may affect disease onset and progression independently. As mentioned previously, this variant was predicted to disrupt both HNF and AP-1 transcription factor binding sites. The minor allele (G) was predicted to have less affinity for both transcription factors; since this is a competing site and the binding affinities of both transcription factors are altered possibly to differing extents, functional studies are required to determine the impact of this SNP, if any, on TTR expression.
Although survival from onset seemed to be a function of age at onset due to the diminished significance upon conditioning analysis, the effect was not entirely dependent since the effect estimates changed only slightly. It is possible that the minor allele of the SNPs associated with these clinical features (rs4799581, rs3764479, rs3764478, and rs3794885) may postpone onset of symptoms; and, once presentation occurs, disease progression may be more rapid compared to individuals with the common allele for these variants.
Interestingly, a nearly significant association was found between ATTRwt and rs1800458, predicting the A allele of the non-pathologic (Fitch et al. 1991) coding polymorphism leading to the TTR-G6S protein variant to be protective (OR < 1). While these results provide support that the variant is not pathologic, they are insufficient to prove that G6S is protective. However, we feel that our study does provide further empirical evidence suggesting that G6S may play a role in mitigating ATTRwt. It has been reported that the A allele leading to G6S occurs in an approximate frequency of 0.06, with 12% heterozygosity in the Caucasian population (Jacobson et al. 1995). In our study, the ATTRwt group had a lower allele frequency of 0.04 compared to 0.08 in the controls; 7% of ATTRwt subjects were heterozygous and there were no homozygotes, while in the control group, 9% were heterozygous and 3% were homozygous. Moreover, rs1800458, the SNP corresponding to G6S, was the only SNP out of HWE (p < 0.0001) for the control group, indicating that the genotypes were skewed in this population. One explanation for a population that does not demonstrate HWE is the presence of an allele linked to disease. Since ATTRwt is a late-onset disease, it appears that there is no reproductive benefit for the protective allele, unless it is manifested in the second generation.
To our knowledge, there have been no previous genetic studies of ATTRwt and thus, no correlation of genetic variants to clinical features; however, two reports have defined non-coding variation in ATTRm due to V30M in Swedish (Olsson et al. 2010) and Portuguese (Soares et al. 2004) groups. The non-coding variants associated with ATTRwt in the present study were not the same as, or in LD with, the ATTR V30M risk variants. These differences seem to indicate that ATTRwt and ATTRm are distinct diseases with unique genetic variation and driven by different loci (Table 4). The most notable difference between the diseases was at rs62093482, located in the 3′ UTR, where the T allele (freq = 0.52) was associated with ATTRm and predicted to preferentially bind to miRNA-643 (Olsson et al. 2010). The C allele (freq = 0.98) was more prevalent in the present study of ATTRwt. Although this SNP was not significantly associated with ATTRwt, our findings are consistent with the Olsson et al. hypothesis that the T allele of rs62093482 may protect against ATTR by miRNA regulation, and that this contributes to the observed late-onset of disease in the Swedish ATTR V30M population. Since ATTRwt subjects in this study lack this allele, they may also lack this miRNA control of TTR expression. While the contribution of rs62093482 to ATTRwt may be small, it may be in LD with other genetic variations that also affect TTR regulation in ATTRwt. Our sample size was not sufficient to establish association between ATTRwt and rs62093482 due to the low frequency of the T allele. Further, as no reports have verified a functional role for this SNP in ATTRm (Norgren et al. 2012), in vitro studies will be important to investigate its impact on ATTRwt.
Table 4.
Comparison of present ATTRwt study to previous ATTRm V30M studies (Soares et al. 2004; Olsson et al. 2010)
| SNP | BU ATTRwt, risk allele, odds ratio (p) | ATTRm V30M, risk allele, odds ratio (p) | ||
|---|---|---|---|---|
| Soares, et al. | Olsson, et al. | |||
|
|
|
|||
| Portuguese Early onset, < 40 y | Swedish Late onset, > 60 y | Swedish Late onset, > 60 y | ||
| rs4799581 | C, 1.56 (p = 0.019)a | |||
| rs3764479 | G, 1.45 (p = 0.057) | A, 2.94 (p < 0.0001) | A, 1.74 (p = 0.287) | |
| rs71383038 | (CA)9, 1.39 (p = 0.084) | (CA)10, 2.19 (p = 0.0034) | ||
| rs72922940 | G, 2.05 (p = 0.013) | A, 1.43 (p = n/s) | ||
| rs3794885 | T, 1.47 (p = 0.044) | T, 2.14 (p = 0.0041) | ||
| rs62093482 | T, 1.09 (p = 0.887) | C, 3.71 (p = n/s) | T, 26 (p < 0.0001) | |
| rs1791228 | T, 1.29 (p = 0.179) | C, 3.65 (p < 0.0001) | C, 1.18 (p = 0.828) | |
fro each study, the associated allele is listed followed by the odds ratio and significance. P-values were determined in the current study by chi-square test for independence, in the ATTRm studies by Fisher’s exact test; non-significant p-values not given in the original reports are represented by “n/s”. Blank spaces indicate the SNP was not tested.
There are several limitations in the present study which restrict interpretation of results. First, our sample size was modest, and the reported associations are only nominally (p < 0.05) significant. Using the genetic power calculator, we estimate that n = 261 cases and controls would yield 80% power to detect an effect similar to that observed for rs72922940 based on a Conferring corrected significance threshold (p < 0.01 correcting for 5 SNPs). Data from larger sample sets are necessary to confirm the disease associations of the SNPs that we have reported. Moreover, due to our limited sample size, we chose to restrict our analysis to common variants; although rare variants may have an impact on disease, large sample sizes are required to establish their effect via genetic association testing. Furthermore, there is moderate LD across the TTR gene region that we have examined, making it possible that the SNPs highlighted in this study may be acting as a proxy for some other functional SNP in high LD. While we perhaps have identified the SNP driving disease effects, it is also possible that the causal SNP is in LD with the variations reported in this study and located in a region that we did not test. However, the possibility that the causal SNP is in LD with, but located outside the regions tested in this study, is less likely since we carefully selected our targets for their functional capacity. There is also the chance that one (or more) underlying loci exist which is directly linked to ATTRwt pathogenesis; there may be more than one causal SNP, and it is also possible that together these functional variants affect disease by interacting with one another. Therefore, the data presented in this study offer insight, but do not unequivocally demonstrate, which genetic variants may be responsible for observed associations. In vitro studies aimed at investigating the functional implications of the identified SNPs are necessary to delineate the role of genetic variation in ATTRwt.
In summary, we have investigated 4 predicted non-coding regulatory regions and all exons of the TTR gene in 108 Caucasian males with cardiomyopathy due to ATTRwt and 118 age-, sex- and ethnically-matched healthy controls. This is the first genetic study of a large, well-characterized group of ATTRwt subjects. Three SNPs were found to be significantly associated with ATTRwt (p < 0.05) and one, rs72922940, remained near significance (pcorrected = 0.083) after multiple testing correction. In addition, our analyses indicated that rs72922940 and another SNP, rs3794885, are strong candidates as potentially functional variants. Exon analyses demonstrated the occurrence of the G6S polymorphism in 7% of the ATTRwt subjects and 12% of controls; this variant is potentially a protective factor. Four variants were significantly associated with age at onset of disease and survival measured from onset of symptoms. Further investigation is warranted to determine the prevalence of the identified variants in ATTRwt, their regulatory function, and potential role in assessing risk of disease.
Supplementary Material
Acknowledgments
This work was supported by the Young Family Amyloid Research Fund and National Institutes of Health grant RO1AG031804 (LHC).
Footnotes
Conflict of Interest
None.
References
- Barrett JC, Fry B, Miller J, Daly MJ. Haploview: analysis and visualization of LD and haplotype maps. Bioinformatics. 2005;21:263–265. doi: 10.1093/bioinformatics/bth457. [DOI] [PubMed] [Google Scholar]
- Buxbaum J, Anan I, Suhr O. Serum transthyretin levels in Swedish TTR V30M carriers. Amyloid. 2010;17:83–85. doi: 10.3109/13506129.2010.483118. [DOI] [PubMed] [Google Scholar]
- Buxbaum J, Koziol J, Connors LH. Serum transthyretin levels in senile systemic amyloidosis: effects of age, gender and ethnicity. Amyloid. 2008;15:255–261. doi: 10.1080/13506120802525285. [DOI] [PMC free article] [PubMed] [Google Scholar]
- Cartharius K, Frech K, Grote K, et al. MatInspector and beyond: promoter analysis based on transcription factor binding sites. Bioinformatics. 2005;21:2933–42. doi: 10.1093/bioinformatics/bti473. [DOI] [PubMed] [Google Scholar]
- Connors LH, Doros G, Sam F, et al. Clinical features and survival in senile systemic amyloidosis: comparison to familial transthyretin cardiomyopathy. Amyloid. 2011;18(Suppl 1):157–9. doi: 10.3109/13506129.2011.574354059. [DOI] [PMC free article] [PubMed] [Google Scholar]
- Connors LH, Lim A, Prokaeva T, et al. Tabulation of human transthyretin (TTR) variants, 2003. Amyloid. 2003;10:160–184. doi: 10.3109/13506120308998998. [DOI] [PubMed] [Google Scholar]
- Cornwell GG, 3rd, Murdoch WL, Kyle RA, et al. Frequency and distribution of senile cardiovascular amyloid. A clinicopathologic correlation. Am J Med. 1983;75:618–623. doi: 10.1016/0002-9343(83)90443-6. [DOI] [PubMed] [Google Scholar]
- Costa RH, Grayson DR. Site-directed mutagenesis of hepatocyte nuclear factor (HNF) binding sites in the mouse transthyretin (TTR) promoter reveal synergistic interactions with its enhancer region. Nucleic Acids Res. 1991;19:4139–4145. doi: 10.1093/nar/19.15.4139. [DOI] [PMC free article] [PubMed] [Google Scholar]
- Costa RH, Grayson DR, Darnell JE., Jr Multiple hepatocyte-enriched nuclear factors function in the regulation of transthyretin and alpha 1-antitrypsin genes. Mol Cell Biol. 1989;9:1415–1425. doi: 10.1128/mcb.9.4.1415. [DOI] [PMC free article] [PubMed] [Google Scholar]
- Costa RH, Grayson DR, Xanthopoulos KG, Darnell JE., Jr A liver-specific DNA-binding protein recognizes multiple nucleotide sites in regulatory regions of transthyretin, alpha 1-antitrypsin, albumin, and simian virus 40 genes. Proc Natl Acad Sci U S A. 1988a;85:3840–3844. doi: 10.1073/pnas.85.11.3840. [DOI] [PMC free article] [PubMed] [Google Scholar]
- Costa RH, Lai E, Darnell JE., Jr Transcriptional control of the mouse prealbumin (transthyretin) gene: both promoter sequences and a distinct enhancer are cell specific. Mol Cell Biol. 1986;6:4697–4708. doi: 10.1128/mcb.6.12.4697. [DOI] [PMC free article] [PubMed] [Google Scholar]
- Costa RH, Lai E, Grayson DR, Darnell JE., Jr The cell-specific enhancer of the mouse transthyretin (prealbumin) gene binds a common factor at one site and a liver-specific factor(s) at two other sites. Mol Cell Biol. 1988b;8:81–90. doi: 10.1128/mcb.8.1.81. [DOI] [PMC free article] [PubMed] [Google Scholar]
- Costa RH, Van Dyke TA, Yan C, et al. Similarities in transthyretin gene expression and differences in transcription factors: liver and yolk sac compared to choroid plexus. Proc Natl Acad Sci U S A. 1990;87:6589–6593. doi: 10.1073/pnas.87.17.6589. [DOI] [PMC free article] [PubMed] [Google Scholar]
- Courtois G, Baumhueter S, Crabtree GR. Purified hepatocyte nuclear factor 1 interacts with a family of hepatocyte-specific promoters. Proc Natl Acad Sci U S A. 1988;85:7937–7941. doi: 10.1073/pnas.85.21.7937. [DOI] [PMC free article] [PubMed] [Google Scholar]
- Falk RH, Skinner M. The systemic amyloidoses: an overview. Adv Intern Med. 2000;45:107–137. [PubMed] [Google Scholar]
- Fitch NJ, Akbari MT, Ramsden DB. An inherited non-amyloidogenic transthyretin variant, [Ser6]-TTR, with increased thyroxine-binding affinity, characterized by DNA sequencing. J Endocrinol. 1991;129:309–13. doi: 10.1677/joe.0.1290309. [DOI] [PubMed] [Google Scholar]
- Grayson DR, Costa RH, Xanthopoulos KG, Darnell JE. One factor recognizes the liver-specific enhancers in alpha 1-antitrypsin and transthyretin genes. Science (80–) 1988;239:786–788. doi: 10.1126/science.3257586. [DOI] [PubMed] [Google Scholar]
- Jacobson DR, Alves IL, Saraiva MJ, et al. Transthyretin Ser 6 gene frequency in individuals without amyloidosis. Hum Genet. 1995;95:308–12. doi: 10.1007/BF00225199. [DOI] [PubMed] [Google Scholar]
- Kisilevsky R. Amyloid and amyloidoses: differences, common themes, and practical considerations. Mod Pathol. 1991;4:514–518. [PubMed] [Google Scholar]
- Macintyre G, Bailey J, Haviv I, Kowalczyk A. is-rSNP: a novel technique for in silico regulatory SNP detection. Bioinformatics. 2010;26:i524–30. doi: 10.1093/bioinformatics/btq378. [DOI] [PMC free article] [PubMed] [Google Scholar]
- Martinho A, Santos CR, Goncalves I. A distal estrogen responsive element upstream the cap site of human transthyretin gene is an enhancer-like element upon ERalpha and/or ERbeta transactivation. Gene. 2013;527:469–476. doi: 10.1016/j.gene.2013.06.078. [DOI] [PubMed] [Google Scholar]
- Mathelier A, Zhao X, Zhang AW, et al. JASPAR 2014: an extensively expanded and updated open-access database of transcription factor binding profiles. Nucleic Acids Res. 2014;42:D142–7. doi: 10.1093/nar/gkt997. [DOI] [PMC free article] [PubMed] [Google Scholar]
- Merlini G, Westermark P. The systemic amyloidoses: clearer understanding of the molecular mechanisms offers hope for more effective therapies. J Intern Med. 2004;255:159–178. doi: 10.1046/j.1365-2796.2003.01262.x. [DOI] [PubMed] [Google Scholar]
- Meyer LR, Zweig AS, Hinrichs AS, et al. The UCSC Genome Browser database: extensions and updates 2013. Nucleic Acids Res. 2013;41:D64–9. doi: 10.1093/nar/gks1048. [DOI] [PMC free article] [PubMed] [Google Scholar]
- Ng B, Connors LH, Davidoff R, Skinner M, Flak RH. Senile systemic amyloidosis presenting with heart failure: a comparison with light chain-associated amyloidosis. Arch Intern Med. 2005;165:1425–1429. doi: 10.1001/archinte.165.12.1425. [DOI] [PubMed] [Google Scholar]
- Norgren N, Hellman U, Ericzon BG, et al. Allele specific expression of the transthyretin gene in swedish patients with hereditary transthyretin amyloidosis (ATTR V30M) is similar between the two alleles. PLoS One. 2012;7:e49981. doi: 10.1371/journal.pone.0049981. [DOI] [PMC free article] [PubMed] [Google Scholar]
- Olsson M, Norgren N, Obayashi K, et al. A possible role for miRNA silencing in disease phenotype variation in Swedish transthyretin V30M carriers. BMC Med Genet. 2010;11:130. doi: 10.1186/1471-2350-11-130. [DOI] [PMC free article] [PubMed] [Google Scholar]
- Polimanti R, Di Girolamo M, Manfellotto D, Fuciarelli M. Functional variation of the transthyretin gene among human populations and its correlation with amyloidosis phenotypes. Amyloid. 2013;20:256–62. doi: 10.3109/13506129.2013.844689. [DOI] [PubMed] [Google Scholar]
- Pruim RJ, Welch RP, Sanna S, et al. LocusZoom: regional visualization of genome-wide association scan results. Bioinformatics. 2010;26:2336–7. doi: 10.1093/bioinformatics/btq419. [DOI] [PMC free article] [PubMed] [Google Scholar]
- Purcell S, Neale B, Todd-Brown K, et al. PLINK: a tool set for whole-genome association and population-based linkage analyses. Am J Hum Genet. 2007;81:559–75. doi: 10.1086/519795. [DOI] [PMC free article] [PubMed] [Google Scholar]
- Qian X, Samadani U, Porcella A, Costa RH. Decreased expression of hepatocyte nuclear factor 3 alpha during the acute-phase response influences transthyretin gene transcription. Mol Cell Biol. 1995;15:1364–1376. doi: 10.1128/mcb.15.3.1364. [DOI] [PMC free article] [PubMed] [Google Scholar]
- Rostom AA, Sunde M, Richardson SJ, et al. Dissection of multi-protein complexes using mass spectrometry: subunit interactions in transthyretin and retinol-binding protein complexes. Proteins Suppl. 1998;2:3–11. doi: 10.1002/(sici)1097-0134(1998)33:2+<3::aid-prot2>3.3.co;2-8. [DOI] [PubMed] [Google Scholar]
- Sakaki Y, Yoshioka K, Tanahashi H, et al. Human transthyretin (prealbumin) gene and molecular genetics of familial amyloidotic polyneuropathy. Mol Biol Med. 1989;6:161–168. [PubMed] [Google Scholar]
- Samadani U, Qian X, Costa RH. Identification of a transthyretin enhancer site that selectively binds the hepatocyte nuclear factor-3 beta isoform. Gene Expr. 1996;6:23–33. [PMC free article] [PubMed] [Google Scholar]
- Saraiva MJ. Transthyretin mutations in hyperthyroxinemia and amyloid diseases. Hum Mutat. 2001;17:493–503. doi: 10.1002/humu.1132. [DOI] [PubMed] [Google Scholar]
- Sasaki H, Yoshioka N, Takagi Y, Sakaki Y. Structure of the chromosomal gene for human serum prealbumin. Gene. 1985;37:191–197. doi: 10.1016/0378-1119(85)90272-0. [DOI] [PubMed] [Google Scholar]
- Sipe JD, Benson MD, Buxbaum JN, et al. Amyloid fibril protein nomenclature: 2010 recommendations from the nomenclature committee of the International Society of Amyloidosis. Amyloid. 2010;17:101–4. doi: 10.3109/13506129.2010.526812. [DOI] [PubMed] [Google Scholar]
- Soares ML, Coelho T, Sousa A, et al. Haplotypes and DNA sequence variation within and surrounding the transthyretin gene: genotype-phenotype correlations in familial amyloid polyneuropathy (V30M) in Portugal and Sweden. Eur J Hum Genet. 2004;12:225–237. doi: 10.1038/sj.ejhg.5201095. [DOI] [PubMed] [Google Scholar]
- Tanskanen M, Peuralinna T, Polvikoski T, et al. Senile systemic amyloidosis affects 25% of the very aged and associates with genetic variation in alpha2-macroglobulin and tau: a population-based autopsy study. Ann Med. 2008;40:232–239. doi: 10.1080/07853890701842988. [DOI] [PubMed] [Google Scholar]
- Tsuzuki T, Mita S, Maeda S, et al. Structure of the human prealbumin gene. J Biol Chem. 1985;260:12224–12227. [PubMed] [Google Scholar]
- US Census Bureau. USC: 2010 Census Special Reports, Centenarians: 2010, C2010SR-03. Washington, DC: 2012. [Google Scholar]
- Westermark P, Bergstrom J, Solomon A, et al. Transthyretin-derived senile systemic amyloidosis: clinicopathologic and structural considerations. Amyloid. 2003;10(Suppl 1):48–54. [PubMed] [Google Scholar]
- Wingender E. The TRANSFAC project as an example of framework technology that supports the analysis of genomic regulation. Brief Bioinform. 2008;9:326–32. doi: 10.1093/bib/bbn016. [DOI] [PubMed] [Google Scholar]
- Zaros C, Genin E, Hellman U, et al. On the origin of the transthyretin Val30Met familial amyloid polyneuropathy. Ann Hum Genet. 2008;72:478–84. doi: 10.1111/j.1469-1809.2008.00439.x. [DOI] [PubMed] [Google Scholar]
Associated Data
This section collects any data citations, data availability statements, or supplementary materials included in this article.