

Abstract
The majority of pediatric low‐grade gliomas (LGGs) are characterized by constitutive activation of the mitogen‐activated protein kinase (MAPK) pathway through various mechanisms including BRAF mutations, inactivation of NF 1, and KIAA 1549‐ BRAF and FAM 131 B ‐ BRAF fusions. The KIAA 1549‐ BRAF fusion typically results from a 2.0 Mb tandem duplication in chromosome band 7q34. In the present study, single nucleotide polymorphism (SNP)‐based array analysis of three LGGs demonstrated deletions in 7q34 that resulted in a BRAF fusion. Case 1 was likely a pilocytic astrocytoma (PA) with three deletions in 7q33q34 and an exon 15‐9 KIAA 1549‐ BRAF fusion. SNP array analysis of case 2, a possible dysembryoplastic neuroepithelial tumor (DNT), revealed a 2.6 Mb deletion, which included the 5′ end of BRAF and extended to the 3′ end of FAM 131 B. In case 3, deletions involving BRAF and FAM 131 B were observed in both a primary and a recurrent PA. RNA‐based sequence analysis of cases 2 and 3 confirmed a fusion between FAM 131 B exon 2 and BRAF exon 9. The presence of fusion transcripts in these three LGGs highlights the utility of SNP array analysis to identify deletions that are suggestive of fusion proteins. BRAF fusions can result from multiple non‐overlapping deletions, suggesting various complex mechanisms of formation.
Keywords: BRAF, FAM131B, KIAA1549, pediatric glioma
Introduction
Central nervous system neoplasms are among the most frequent solid tumors in the pediatric population. The majority of these tumors are classified by the World Health Organization (WHO) as grade I or grade II glial or mixed glial/neuronal tumors 23, 28. Pilocytic astrocytoma (PA) is the most common low‐grade glioma (LGG) in the pediatric population, followed by ganglioglioma (GG), pilomyxoid astrocytoma (PMA) and pleomorphic xanthoastrocytoma (PXA). Overall, pediatric LGGs have a good prognosis with survival rates for children and young adults with PA approaching ∼96% 12, 29. The extent of surgical resection remains one of the most significant predictors of survival 4.
Constitutive activation of the mitogen‐activated protein kinase (MAPK) pathway drives the formation of the majority of LGGs 33. A recent whole genome sequencing (WGS) study of 96 PAs identified molecular alterations leading to MAPK activation in 100% of cases 20. MAPK pathway activation is accomplished through a variety of distinct molecular alterations 19 and was first highlighted by the observation of complete inactivation of NF1 in optic pathway gliomas from patients with the familial tumor syndrome neurofibromatosis (NF1) 7. To date, the most common mechanism of MAPK pathway activation in sporadic LGGs is a 2.0 Mb tandem duplication in 7q34 1, 8, 31 that results in production of a KIAA1549‐BRAF fusion transcript 21, 36. Although multiple breakpoints exist for this fusion 3, 5, 13, 21, 27, all resulting products have loss of the BRAF autoregulatory domain, leading to constitutive MAPK activity 2, 39. The KIAA1549‐BRAF fusion was once thought to be specific for PA 17, 24, 26; however, it has now been identified, albeit less frequently, in other LGGs including GG 9, 16, 32, PXA 16, PMA 9, 13, 14, 16, 34 and diffuse astrocytoma (DA) 31, 36.
Fusion of BRAF to another gene, FAM131B, has also been identified in at least five tumors to date, including four PAs and one DA 3, 20, 40. This fusion results from a deletion in 7q34, fusing the first several exons of FAM131B to the activation domain of BRAF. Similar to the KIAA1549‐BRAF fusion product, multiple genomic breakpoints in FAM131B‐BRAF have been reported 3. In vitro experiments demonstrated that FAM131B‐BRAF is also an activator of the MAPK pathway 3.
In addition to KIAA1549 and FAM131B, rare fusions between BRAF and other genes including RNF130, CLCN6, MKRN1, GNAI1, FXR1 and MACF1 have been identified 20, 40. BRAF mutations have also been implicated in pediatric LGG, specifically p.V600E, and are most frequently found in the PXA, DA and GG subtypes 10, 16. Notably, there are mechanisms in addition to BRAF alterations that lead to MAPK activation in LGG, including RAF1 22, 40 and NTRK2 20, 40 gene fusions, MYB deletions 32, 38, KRAS mutations 3, 13, 18, 20, 35, 38, 40 and FGFR1 alterations, which include both mutations and internal tandem duplications 20, 40. For the most part, these MAPK alterations are mutually exclusive, with only a few reports of multiple hits in this pathway occurring within the same tumor 3, 14, 16, 27.
Depending on the nature of the genetic alterations, a variety of different techniques can be used for detection of these alterations in tumors. In the Clinical Cancer Cytogenetics laboratory at The Children's Hospital of Philadelphia (CHOP), we use single nucleotide polymorphism (SNP)‐based array technology to routinely analyze all subtypes of pediatric brain tumors 11, 34, 36. SNP array analysis of the majority of LGGs is straightforward; the most common 2.0 Mb duplication in 7q34 is easily detected by this technology 11, 34, 36.
We herein describe three LGGs in which SNP array studies showed deletions in 7q34 that were suggestive of the rare FAM131B‐BRAF fusion or of a KIAA1549‐BRAF fusion. A detailed summary of the clinical and molecular findings of these three cases is presented.
Methods
Clinical evaluation
Frozen tumor samples were submitted to the Clinical Cancer Cytogenetics Laboratory for high‐resolution SNP array analysis using a commercially available bead chip from Illumina (San Diego, CA, USA). SNP array analysis was performed as previously described 34. Tumors from cases 2 and 3B were analyzed using the Human610‐Quad array (Illumina). Tumors from cases 1 and 3C were analyzed using the HumanOmni1‐Quad array (Illumina).
BRAF mutation screening
Screening for mutations in BRAF exons 11 and 15 was performed using polymerase chain reaction (PCR) and Sanger sequencing as previously described 6.
RNA extraction and detection of fusion transcripts using reverse transcriptase‐PCR (RT‐PCR)
RNA was extracted from frozen tissue specimens using the RNeasy mini kit (Qiagen, Valencia, CA, USA) following the manufacturer's protocol. cDNA was synthesized using SuperScript II reverse transcriptase (Life Technologies, Carlsbad, CA, USA) beginning with 300 ng of RNA, according to the manufacturer's instructions. All KIAA1549‐BRAF fusions were detected using a nested PCR as described in Forshew et al 13. FAM131B‐BRAF fusions were detected using a FAM131B forward primer as described in Cin et al 3 and a reverse primer located in exons 11/12 of BRAF (5′‐TTTCACTGCCACATCACCAT‐3′). β‐ACTIN levels were detected as a control for RT‐PCR and primer sequences are as follows: β‐ACTIN F 5′‐GCGGGAAATCGTGCGTGACATT‐3′ AND β‐ACTIN R 5′‐GATGGAGTTGAAGGTAGTTTCGTG‐3′. RT‐PCRs were performed using standard protocols, after which products were visualized on a 1.2% agarose gel and purified using Exosapit (Affymetrix, Santa Clara, CA, USA). The PCR primers were also used to sequence the products with a 3730 DNA analyzer (Life Technologies) in the CHOP NAPCore facility. All chromatograms were analyzed visually for the presence of the fusion products and sequences were confirmed using the corresponding reverse primers.
Results
Case 1
Clinical summary
A 17‐year‐old woman presented with intermittent memory loss. Episodes of fear associated with tachycardia occurred a few times per week and these episodes became more frequent, eventually occurring many times per day. The clinical suspicion was that these episodes were seizures, although no documentation was obtained. She denied headaches until one week prior to surgery but did report a feeling of pulsation in her head. In February 2012, non‐contrast and contrast computed tomography (CT) scans demonstrated a peripheral left temporal lobe mass, which was densely calcified medially, lobulated peripherally and avidly enhancing laterally. There was possible scalloping of the inner table, suggesting a long‐standing mass. A 3.0T magnetic resonance imaging (MRI) also performed at this time demonstrated a non‐restricting, avidly enhancing tumor (Figure 1A–D). GG was considered because of dense calcification and the temporal location, although the contrast enhancement and bubbly appearance were more characteristic of a dysembryoplastic neuroepithelial tumor (DNT). PA was also considered as this was a cystic tumor with mural nodule presenting in childhood. The radiologic diagnosis for this case was therefore unclear.
Figure 1.
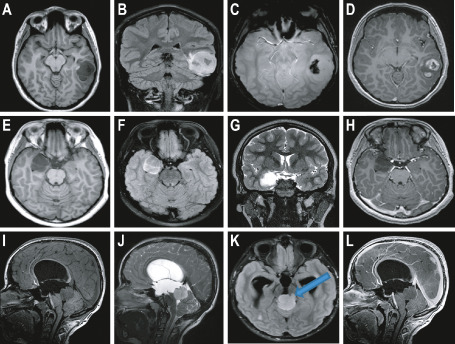
Magnetic resonance imaging (MRI) findings from cases 1, 2 and 3A. A–D. Radiologic findings from case 1. Axial T1 (A), coronal fluid attenuated inversion recovery (FLAIR) (B), axial susceptibility (C) and axial post‐contrast (D) images of the brain. Note the fairly well‐circumscribed lesion in the posterior left temporal lobe which is dark on T1 and bright on FLAIR. Signal drop off on the susceptibility image suggests calcium and/or hemorrhage, with fairly avid contrast enhancement on post‐contrast imaging. E–H. Radiologic findings from case 2. Axial T1 (E), axial FLAIR (F), coronal T2 (G) and axial post‐contrast (H) images of the brain. Note the well‐circumscribed lesion within the medial right temporal lobe, which is dark on T1, moderately bright on FLAIR, bright on T2, and without any appreciable contrast enhancement. I–L. Radiologic findings from case 3A. Sagittal T1 (I), sagittal T2 (J), axial FLAIR (K) and sagittal post‐contrast (L) images of the brain. Note the fairly well‐circumscribed lesion within the pineal/tectal region which is dark on T1, moderately bright on FLAIR and T2, and without any appreciable contrast enhancement. Blue arrow indicates possible brain stem invasion of the tumor (K).
After gross total resection in March 2012, the patient recovered well with minor neurocognitive problems. There were no postoperative seizures and anti‐epileptic medication was not required. Pathologic examination of the tumor revealed a LGG without mitoses or necrosis. It was composed of large areas of round to ovoid astrocytes in a faintly loose, myxoid background with microcystic changes and scattered eosinophilic granular bodies (EGBs) (Figure 2A,B). Arcades of small glomeruloid‐like vessels were present. No collections of dysplastic neurons or ganglion cells were identified in this part of the tumor. In addition, there was an area of compact neuropil with rare Rosenthal fibers (Figure 2C) blending imperceptibly with the brain parenchyma. Depending on the area of the tumor, abundant calcifications were also observed (Figure 2D). Disorganized, loose collections of neurons were present; however, it was difficult to distinguish a neoplastic component from entrapped neurons (Figure 2E).
Figure 2.
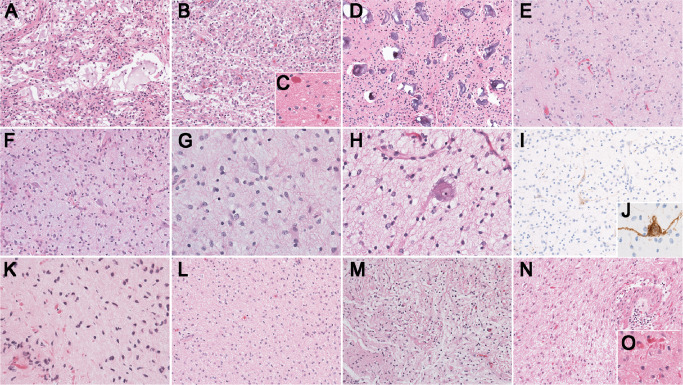
Pathology findings. A–E. Pathology findings from case 1. A. Large areas of tumor demonstrate a loose background with microcystic changes and irregular spaces with faintly bluish/myxoid material [200×; hematoxylin and eosin (H&E)]. B. Some areas of the tumor are more solid with round to ovoid astrocytes (200×; H&E). C. Scattered Rosenthal fibers are visible (400×; H&E). D. Numerous calcifications of different sizes are spread throughout the tumor (200×; H&E). E. Disorganized collections of, most likely entrapped neurons are present (200×; H&E). F–J. Pathology findings from case 2. F and G. The tumor is composed of fibrillary astrocytes in a faintly bluish neuropil without perivascular inflammation or eosinophilic granular bodies (F: 200×, G: 400×; H&E). H. Although classical pools of mucin with floating neurons are not present there are atypical, large neurons (400×; H&E). I and J. The neurons present throughout the tumor are highlighted by neurofilament (NFP) (I: 200×, J: 400X; NFP). K–O. Pathology findings from case 3. K. The first biopsy demonstrates features of a low‐grade astrocytoma with Rosenthal fibers (400×; H&E). L and M. The second resection demonstrates a rather diffuse growth pattern with a hint of focal, biphasic organization (200×; H&E). N. Pathologic findings from the residual/recurrent tumor demonstrate a recurrent low‐grade astrocytoma with radiation induced vascular changes (200×; H&E). O. Numerous Rosenthal fibers are present (400×; H&E).
The differential diagnosis included PA, GG and DNT. Characteristic features of GG and DNT such as perivascular inflammation, dysplastic neurons, free floating neurons or oligodendroglial‐like cells were lacking. A definite biphasic pattern suggestive of PA was not apparent. Indeed, the status of the neuronal collection remained uncertain. Calcifications may be present in all of these tumors. Based on both the radiology and the pathology findings, the final diagnosis was most likely a PA with entrapped neurons. MRI performed in August 2013 revealed stable post‐surgical changes with several stable nodules around the cavity.
Genetic analysis of case 1
As shown in Table 1 and Figure 3A, SNP array analysis demonstrated three non‐overlapping deletions in 7q33 and 7q34. The first deletion, which was 353 kb in size, included exons 17–20 of KIAA1549 (Figure 3A,E, deletion 1). One additional SNP located in intron 15 (rs10229557) may have been included in this deletion as the Log R ratio at this SNP was below zero (Log R = −0.137). The B‐allele frequency (BAF) of rs10229557 was close to 1 (BAF = 0.99), indicating homozygosity at this locus, and was therefore uninformative regarding copy number. Additionally, due to the absence of SNP coverage over portions of KIAA1549, it was not possible to determine if exons 11–16 were included in this deletion (Figure 3E).
Table 1.
Single nucleotide polymorphism (SNP) array results from cases 1, 2 and 3B/C. Abbreviations: DNT = dysembryoplastic neuroepithelial tumor; PA = pilocytic astrocytoma
| Case | Diagnosis | SNP platform | Chromosome | Start | End | Size | Abnormality* |
|---|---|---|---|---|---|---|---|
| 1 | PA | Omni1 (hg19) | 7q11.21 | 61 747 794 | 66 884 495 | 5.1 Mb | Hmz |
| 7q33q34 | 138 188 932 | 138 541 488 | 353 kb | Htz del (#1) | |||
| 7q34 | 140 125 750 | 140 180 271 | 55 kb | Htz del (#2) | |||
| 7q34 | 140 495 573 | 140 547 786 | 52 kb | Htz del (#3) | |||
| 2 | DNT | 610K (hg18) | 7q34 | 140 145 576 | 142 756 304 | 2.6 Mb | Htz del (#1) |
| 3B | PA | 610K (hg18) | 7q34 | 140 145 576 | 140 159 130 | 14 kb | Htz del (#1) |
| 7q34 | 141 125 169 | 141 256 227 | 131 kb | Htz del (#2) | |||
| 7q34 | 142 005 626 | 142 453 376 | 448 kb | Htz del (#3) | |||
| 7q34 | 142 750 483 | 142 764 431 | 10 kb | Htz del (#4) | |||
| 3C | Recurrent/Residual PA | Omni1 (hg19) | 7q34 | 140 499 107 | 140 500 885 | 1.8 kb | Htz del (#1) |
| 7q34 | 141 476 862 | 141 612 717 | 136 kb | Htz del (#2) | |||
| 7q34 | 142 327 114 | 142 732 827 | 406 kb | Htz del (#3) | |||
| 7q34 | 143 036 318 | 143 057 268 | 21 kb | Htz del (#4) |
*Normal population variants (NPVs) are not reported in this table and deletions are numbered for reference to the text and Figure 3.
Figure 3.
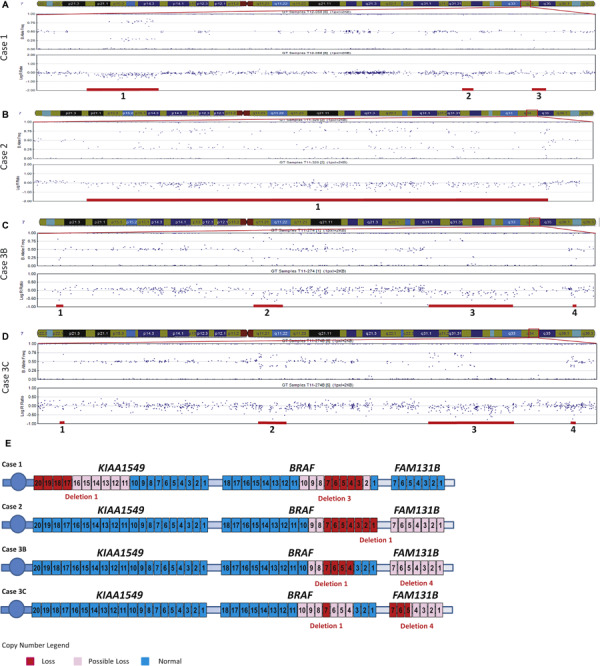
SNP array findings. A–D. GenomeStudio images of 7q33q34 include the B‐allele frequency (BAF) (top plots) and Log R ratio (bottom plots). Deletions, numbered from proximal to distal for each case, are marked with red bars below the deleted SNP probes. A. SNP array results from case 1 demonstrating three deletions in 7q33q34. B. SNP array results from case 2 revealing one deletion in 7q34. C. SNP array analysis from case 3B demonstrating four deletions in 7q34. D. SNP array analysis from the recurrent tumor 3C demonstrating four deletions in 7q34. E. Schematic representation of KIAA 1549, BRAF and FAM 131 B. Exon deletions are colored in red for exons which are definitely deleted, in light pink for those that are possibly deleted, and in blue for exons with normal copy number (exon 5 of FAM 131 B in case 3C is potentially only partially deleted). Genes and exons are not drawn to scale and all genes located in 7q33q34 are not pictured.
The second deletion, beginning in the last exon of RAB19, was 55 kb in size and also encompassed the entire MKRN1 gene (Figure 3A, deletion 2). The most distal deletion was 52 kb in size and included exons 3–7 of BRAF (Figure 3A,E, deletion 3). An additional SNP located in intron 1 (rs1267621) was potentially deleted (Log R = −0.172) and would thus result in inclusion of BRAF exon 2 in the deletion (Figure 3E). The BAF of rs1267621 was close to 1 (BAF = 0.99) and was non‐contributory with respect to the copy number analysis. Similar to the deletion observed in KIAA1549, the absence of SNP coverage in BRAF exons 8–10 does not provide any information about the copy number status of these exons (Figure 3E).
Further SNP array analysis revealed a 5.1 Mb region of homozygosity (ROH) in 7q11.21 (Table 1). Although this region contains several genes, none of them were considered pathogenic given the deletions in 7q33q34. RT‐PCR and sequencing analyses demonstrated the presence of a fusion transcript between exon 15 of KIAA1549 and exon 9 of BRAF (Figure 4A). There was no BRAF mutation detected by Sanger sequence analysis of exon 15.
Figure 4.
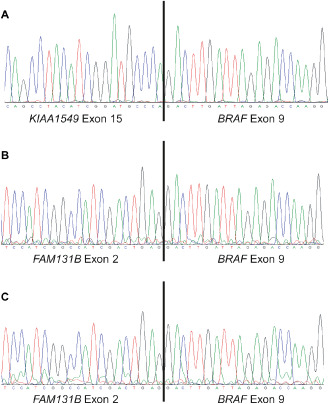
Sanger sequence analysis of fusion products detected by reverse transcriptase‐polymerase chain reaction (RT‐PCR). Twenty nucleotides surrounding the fusion junction are shown in each chromatogram. A. Sequence chromatogram demonstrates a fusion between KIAA 1549 exon 15 and BRAF exon 9 in case 1. B. A fusion between FAM 131 B exon 2 and BRAF exon 9 was detected by sequence analysis of case 2. C. The same fusion product that was present in case 2 (B) was detected in case 3B.
Case 2
Clinical summary
A 9‐year‐old male patient presented with complex partial seizures. A 3.0T MRI demonstrated a right infero‐medial temporal mass, with two toned cysts and without contrast enhancement or diffusion weighted imaging (DWI) restriction (Figure 1E–H). The lesion did not have the classical, bubbly appearance of a DNT.
Surgery performed in August 2011 achieved a gross total resection. Pathologic examination of the fragmented specimen revealed a low‐grade glial tumor without mitoses, microvascular proliferation or necrosis (Figure 2F–J). The pattern was not biphasic but was partly nodular with loose microcystic changes and lacking pools of mucin. Scattered neurons, some sitting in a clear space, were identified (Figure 2G–H). The glial component included astrocytes, some with large cytoplasm and many small oligodendroglia‐like cells, some in close proximity to capillaries. The differential diagnosis included GG and DNT, but dysplastic neurons, perivascular inflammation, Rosenthal fibers and EGBs were absent. The vaguely nodular organization, scattered isolated neurons and oligodendroglia‐like cells (Figure 2G–J) favored a final diagnosis of DNT.
The patient did not receive any additional treatment. In the immediate postoperative period, he was seizure‐free on Keppra, which was later discontinued. At the most recent follow‐up in January 2014, MRI revealed stable post‐surgical changes without tumor recurrence.
Genetic analysis of case 2
SNP array studies revealed a 2.6 Mb deletion located in chromosome band 7q34 (Figure 3B, deletion 1, and Table 1). The proximal deletion breakpoint was in BRAF and included the first 7 exons of the gene (Figure 3E). Given the absence of SNPs located near and within BRAF exons 8 and 9, it was not possible to determine if these exons were deleted (Figure 3E). The distal end of the 2.6 Mb deletion resulted in deletion of exons 1–20 of the CLCN1 gene. If the deletion included the next two SNP probes, rs7802536 and rs4236482, it would result in the deletion of a portion of or the entire FAM131B gene (Figure 3E). Probe rs7802536 is located in an intergenic region between CLCN1 and FAM131B. Although this probe displayed a Log R ratio close to zero (Log R = −0.035), the BAF equal to 0.348 was suggestive of dominance of one allele at this locus. Probe rs4236482 is located in intron 6 of FAM131B. This probe had a Log R ratio value below zero (Log R = −0.104), suggesting a deletion. The BAF of rs4236482 was equal to 0.99, indicating homozygosity at this SNP, which was uninformative in determining copy number. Similar to the proximal end of the deletion, it was not possible to determine the exact distal breakpoint by SNP array analysis.
We next performed RT‐PCR and sequence analyses to determine if this deletion resulted in a fusion product. RT‐PCR yielded an approximately 500 bp product (data not shown) and sequence analysis demonstrated a fusion between exon 2 of FAM131B and exon 9 of BRAF (Figure 4B). There was no additional BRAF exon 11 or 15 mutation.
Case 3 (3A, 3B and 3C)
Clinical summary
A 10‐year‐old male patient presented in March 2011 with an episode of seizure, intermittent headaches and blurry distance vision. A 3.0T MRI demonstrated an exophytic well‐circumscribed, cystic tectal mass. It was non‐infiltrative and non‐restricting with faint right anterolateral enhancement from the 9–12 o'clock position (Figure 1I–L). Although contrast enhancement does not correlate directly with grade, this tumor was minimally enhancing, not uncommon in lower grade tumors. Brainstem invasion was questionable (Figure 1K, blue arrow).
An initial needle biopsy (3A), performed in April 2011, was very small and demonstrated a low‐grade astrocytoma with significant numbers of Rosenthal fibers suggesting PA (Figure 2K). A subsequent larger, subtotal resection (3B) from June 2011 demonstrated a uniform pattern of fibrillary astrocytes without microcystic changes, EGBs or Rosenthal fibers, thus bringing diffuse astrocytoma into the differential diagnosis (Figure 2L–M).
Following the subtotal resection, the patient received proton beam radiation, which concluded in September 2011. An MRI performed at the end of 2011 demonstrated an interval increase in the tectal mass with new diffuse avid enhancement and a slight increase in the surrounding edema. At that time, it was unclear if the increase in tumor size observed was related to post‐treatment changes or tumor progression.
In July 2012, a sudden onset of intratumoral hemorrhage prompted clot evacuation and resection of his residual tumor (3C) involving the pineal region. Pathologic examination of this tissue revealed vascular changes that were in keeping with radiation therapy (Figure 2N). Additionally, a prominent fibrillary astrocytic component with numerous Rosenthal fibers was present (Figure 2O). Considering the radiographic findings together with the pathology of both the initial and the recurrent lesions, the final diagnosis of 3A/B/C was consistent with monophasic PA. The most recent MRI from November 2013 demonstrated stable residual tumor around the surgical cavity.
Genetic analysis of case 3
There was no BRAF exon 11 or 15 mutation in case 3B. RT‐PCR for the KIAA1549‐BRAF fusion, which was performed as part of the diagnostic work‐up at the initial diagnosis (case 3B), was negative. Initial SNP array analysis, however, revealed two deletions in 7q34 (Table 1 and Figure 3C, deletions 1 and 3). The most proximal deletion was 14 kb in size and included exons 4–7 of BRAF (Figure 3E). Due to the absence of SNP coverage in BRAF intron 3 as well as surrounding exons 8 and 9, it was not possible to determine the breakpoints of this deletion (Figure 3E). The second deletion initially identified in this case was 448 kb in size and included the TCRB locus (Figure 3C, deletion 3).
The recurrent tumor occurred approximately 1 year after the initial lesion. The Omni1 SNP array platform introduced during that time period had additional probe coverage for the 7q34 region. SNP array analysis of the recurrent tumor (3C) displayed 4 deletions in chromosome band 7q34 (Table 1 and Figure 3D). The most proximal deletion was 1.8 kb and included BRAF exon 7 (Figure 3E). However, it was still not possible to determine if the distal end of this deletion included BRAF exons 4–6 (Figure 3E). The proximal end of this deletion may also have included BRAF exons 8–10 because two probes within intron 7 (rs1733826 and rs17161714) had Log R values less than zero (−0.17 and −0.06 respectively) (Figure 3E). The BAF values of these probes were non‐contributory to the copy number analysis due to the fact that they were homozygous (rs1733826, BAF = 1; rs17161714, BAF = 0.002).
The second and third deletions were 136 and 406 kb in size, respectively (Figure 3D, deletions 2 and 3). The third deletion included TCRB. The most distal deletion detected in this tumor was 21 kb and included the last 10 exons of CLCN1 as well as the 3′ two and a half exons of FAM131B (Figure 3E). It was difficult to determine if a SNP (rs13244040) located in intron 1 of FAM131B was included in the deletion. The Log R value of rs13244040 was very close to zero (Log R = −0.097) and the BAF was equal to 0.50, indicating two alleles present in fairly equal copy number at this locus. If the SNP was not included within the deletion, the distal end of this deletion was predicted to include at maximum exons 2–5 of FAM131B. If rs13244040 was included, the entire FAM131B gene could have been deleted (Figure 3E).
Upon retrospective analysis, the two additional deletions identified in the recurrent tumor (3C) were present in the first resection from this patient (3B) (Figure 3C, deletions 2 and 4). Deletion 2 encompassed only 19 SNPs. Deletion 4 included at least four SNPs, but due to the paucity of SNPs in this region, the boundaries of this deletion were difficult to determine. The last 10 exons of CLCN1 as well as the entire FAM131B gene could have been deleted (Figure 3E, deletion 4).
Given that the SNP array results for cases 3B and 3C indicated a deletion involving at least part of the FAM131B gene, we performed RT‐PCR and sequence analyses on case 3B (there was not sufficient material to perform these studies in the recurrent tumor). Sequence analyses demonstrated a fusion between exon 2 of FAM131B and exon 9 of BRAF (Figure 4C) in tumor 3B. Finally, the recurrent tumor (3C) did not demonstrate a mutation in BRAF exon 15.
Discussion
General summary
The three patients described in this report presented with symptoms, radiologic findings and histopathology that were within the continuum for LGG. As described, however, there were overlapping pathologic features of the specific tumors that made the differential diagnosis challenging. Case 1 was most likely a PA with entrapped neurons, case 2 a possible DNT and case 3 a monophasic PA. However, given the absence of the classic features for PA and DNT, the definitive pathologic diagnoses for these patients are still subject to debate.
Although some studies have suggested that the KIAA1549‐BRAF fusion is specific for PA 17, 24, 26, we and others have identified this fusion in a variety of LGGs 9, 13, 14, 16, 32, 34. Thus, the presence of the KIAA1549‐BRAF fusion could not be used to confirm the diagnosis of PA in case 1. Similarly, the FAM131B‐BRAF fusion has only been reported in five tumors to date, including four PAs and one DA 3, 20, 40, and thus could not be used to refine the diagnoses for cases 2 and 3. Given that our study raises the number of FAM131B‐BRAF positive tumors in the literature to a total of seven 3, 20, 40, it is premature to establish if this fusion defines a particular subtype of LGG. There were no copy number alterations detected by the SNP array analysis other than those noted in Table 1 that would have helped clarify these diagnoses.
Fusion identification and mechanism of formation
In our recent tumor cohort, the KIAA1549‐BRAF fusion was identified in approximately one‐third of the LGGs and two‐thirds of PAs 34. Case 1 from the present study was the only tumor for which the fusion was due to heterozygous deletions 34. Similarly, cases 2 and 3 represent only 2 of 56 LGGs with deletions detected using SNP arrays that were suggestive of FAM131B‐BRAF fusions. By comparison, Jones et al 20 and Zhang et al 40 reported FAM131B‐BRAF fusion positive tumors in 1 of 96 PAs and 1 of 151 LGGs, respectively.
The KIAA1549‐BRAF fusion protein is typically the result of a 2.0 Mb tandem duplication in 7q34 22, 36. The exact mechanism leading to this fusion remains unclear, although it is likely to be mediated by microhomology‐mediated break‐induced replication (MMBIR) 25. In contrast to the typical 7q34 duplication, case 1 had three non‐overlapping 7q33q34 deletions detected by SNP array analysis that resulted in the formation of a KIAA1549‐BRAF fusion. To our knowledge, this is the first report demonstrating the formation of this fusion as the result of multiple interstitial deletions. Given that KIAA1549 and BRAF are both transcribed from the lagging strand, creation of the fusion product could result from an insertion into one of the adjacent deletions, as shown in model 1 and model 2 in Figure 5. We cannot discount the fact that these deletions may be present on the different chromosome 7 homologs; however, the predicted model of fusion formation would still hold true.
Figure 5.
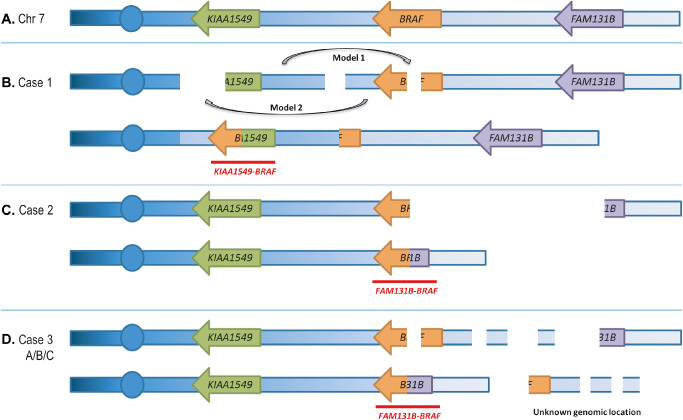
Models of fusion formation. Illustrations represent possible mechanisms of fusion formation for (B) case 1, (C) case 2 and (D) case 3A/B/C. Fusion transcripts that are produced are labeled in red. Chromosomes, genes and deletions are not drawn to scale. For case 1 (B), two possible insertion mechanisms are labeled as model 1 and model 2. Both mechanisms result in the same chromosomal arrangement. The structure of a normal chromosome 7 is shown in (A). In the cases with multiple deletions, we cannot discount the fact that the deletions may be present on different homologs of chromosome 7.
This study also confirmed the presence of a rare BRAF fusion, FAM131B‐BRAF in two LGGs; one of which represents the first report of this fusion in a tumor that is likely a DNT. SNP array analysis of this likely DNT (case 2) revealed a 2.6 Mb deletion spanning from BRAF to just proximal or within FAM131B. RT‐PCR analysis revealed the presence of a FAM131B‐BRAF fusion product. The initial report of the FAM131B‐BRAF fusion described two PAs with similar sized deletions as in our case 2 3. Repair of the single interstitial deletion would result in this fusion given the genomic order and direction of transcription of the BRAF and FAM131B genes, as shown in Figure 5C.
Case 3B and the recurrent tumor from the same patient (3C) both demonstrated multiple non‐overlapping deletions in 7q34 by SNP array analysis. RT‐PCR analyses performed on 3B demonstrated the presence of a FAM131B‐BRAF fusion. These SNP array findings are similar to the pattern of deletions that were observed in case 1, although with a different resulting fusion product. Given the orientation of BRAF and FAM131B, fusion formation in case 3B would result from juxtaposing the two outer segments of chromosome 7 that remained after the deletions (Figure 5D). The segments located between the deletions may have moved to another genomic location, or possibly remained at 7q34 involved in a more complex genomic rearrangement. Without the availability of metaphase cells from this tumor, we were not able to perform FISH to pinpoint the genomic locations of these segments. Similar to case 1, we cannot discount the fact that these deletions may be present on different homologous chromosomes thus leading to a more complex model of fusion formation. Due to the lack of sufficient material, RT‐PCR studies were not performed on the recurrent tumor, although given the pattern of deletions observed by SNP array analysis, we speculate that the FAM131B‐BRAF fusion was present in case 3C as well. Both FAM131B‐BRAF fusions identified in this series resulted from fusion of FAM131B exon 2 to BRAF exon 9 similar to what has been previously reported in PA 3.
The present study supports previous findings that RAF fusions result from a variety of chromosomal rearrangements. The KIAA1549‐BRAF and SRGAP3‐RAF1 fusions typically result from tandem duplications in chromosomes 7 and 3, respectively 13, 22, 36. Interstitial deletions have been shown to be responsible for the FAM131B‐BRAF fusion (3 and present study), and as shown herein, may also lead to a KIAA1549‐BRAF fusion. Translocations between chromosomes 1 and 7 or between chromosomes 5 and 7 lead to CLCN6‐BRAF and RNF130‐BRAF fusions, respectively 20. The BRAF‐AKAP9 fusion in thyroid cancer is the result of a pericentric inversion on chromosome 7 2.
A variety of cytogenetic and molecular techniques are currently employed in diagnostic laboratories to detect these fusions, each of which has its limitations. For example, targeted interphase FISH analysis can be performed on fresh, frozen and formalin‐fixed tissue specimens using commercially available and home‐brew probes. One approach is to use a FISH probe that spans the entire BRAF gene in a single color. Whereas the typical tandem duplication that results in the KIAA1549‐BRAF fusion would demonstrate three BRAF signals, the three cases in the present study would potentially demonstrate one normal and one diminished signal due to the partial BRAF deletion. An alternative strategy is to use a two‐color breakapart (BAP) probe set in which there are separate signals generated for the 5′ and 3′ ends of the gene. Using a BRAF BAP probe, cases 1 and 3 could exhibit either an apparently normal signal with two fusions or a partial deletion depending on the size of the region deleted and the location of the remaining part of the locus. Case 2 had a larger deletion and thus would demonstrate one fusion and one signal for the 3′ end of BRAF.
In our clinical laboratory, SNP array analysis is used as the first‐line test for pediatric brain tumors due to its utility for differential diagnosis 34. The major limitation of this approach is that balanced rearrangements will not be detected. We cannot rule out the presence of additional balanced genomic aberrations that would not have been detected by SNP array analysis. Furthermore, an apparently balanced genomic state could be due to deletion of a region on one chromosome, and gain of that same region on the homologous chromosome, thus obscuring the mechanisms of fusion formation. The BRAF fusions identified in this study were detected due to deletions in 7q33q34. A MKRN1‐BRAF fusion, which is the result of a tandem duplication in 7q34 20, would also be detected with this platform, as would fusions involving RAF1 and MYB, which have also been associated with copy number alterations 22, 34, 40. In contrast, BRAF fusions involving RNF130, CLCN6, GNAI1, FXR1 and MACF1 were not noted to have associated copy number alterations 20, 40 and thus may best be identified by WGS or RNA‐sequencing strategies.
Association of fusions with prognosis, treatment and survival
The correlation of a KIAA1549‐BRAF fusion with survival remains in question due to conflicting reports in the literature. In 2011, Hawkins et al reported on a clinically relevant group of patients with non‐cerebellar LGG that were not completely resected and who had been either treated or monitored for more than 1 year. They demonstrated better progression‐free survival (PFS) in patients whose tumors harbored the KIAA1549‐BRAF fusion 14. Other studies have failed to replicate these findings in a variety of LGG cohorts, demonstrating the lack of association between the KIAA1549‐BRAF fusion and overall survival 16, 21, PFS 16, 27, prognosis 4 and percentage of cases with adverse outcome 15. There are too few cases with the FAM131B‐BRAF fusion to correlate the molecular findings with survival in LGG patients.
Complete surgical resection remains the mainstay of treatment for patients with LGGs when the tumors are located in surgically accessible regions. When complete tumor removal is not an option and/or there is evidence or the potential for tumor progression, chemotherapy and radiation may also be utilized. Additionally, the genetic alterations identified in these tumors are providing the basis for molecularly targeted therapies. Inhibitors of MEK (U0126) or general tyrosine kinases (TKs) (Sorafenib) were shown to block oncogenic phenotypes that are mediated by BRAF or RAF fusions in an in vitro model of prostate cancer cells 30. Clinical trials investigating the use of MEK inhibitors are currently underway for pediatric LGG patients (www.clinicaltrials.gov). Conversely, Sievert et al 37 demonstrated that cells expressing KIAA1549‐BRAF are resistant to the research analog of vemurafenib (PLX4720; Plexxikon/Genentech, Berkeley, CA, USA), an inhibitor of the BRAF V600E mutation. In addition to resistance, PLX4720 treatment induces activation of the wild‐type MAPK pathway. The authors demonstrate efficacy of a second‐generation BRAF inhibitor PLX PB‐3 (Plexxikon) in inhibiting KIAA1549‐BRAF signaling while not promoting wild‐type MAPK activation 37. As the links between molecular abnormalities and prognosis or therapeutic options become evident, it will be necessary to employ the appropriate diagnostic testing methods in the clinical laboratories to ensure that all clinically relevant genetic abnormalities are identified.
Conclusions
We identified a novel alternative mechanism for the formation of the classic KIAA1549‐BRAF fusion and identified two tumors to add to the rising total of LGGs with rare FAM131B‐BRAF fusions. Identification of KIAA1549‐BRAF or FAM131B‐BRAF fusions in LGG tumors as well as PA suggests that molecular classification of pediatric LGGs, perhaps independent of pathologic subtype, will ultimately be useful for selecting therapies based on MAPK activation in these patients.
Acknowledgments
The authors wish to thank the CHOP tumor bank biorepository for additional tumor material and the CHOP Pathology Core for performing tumor staining. J.J.R. was supported by the NIH/NIGMS Medical Genetics Research Training Grant (T32‐GM008638). The study was supported in part by a grant from the NIH (CA133173 to J. A. B.). The authors would also like to thank Tracy Busse for her thoughtful insight and assistance with this manuscript.
The authors declare no conflicts of interest.
Published Online Article Accepted 4 July 2014
References
- 1. Bar EE, Lin A, Tihan T, Burger PC, Eberhart CG (2008) Frequent gains at chromosome 7q34 involving BRAF in pilocytic astrocytoma. J Neuropathol Exp Neurol 67:878–887. [DOI] [PubMed] [Google Scholar]
- 2. Ciampi R, Knauf JA, Kerler R, Gandhi M, Zhu Z, Nikiforova MN et al (2005) Oncogenic AKAP9‐BRAF fusion is a novel mechanism of MAPK pathway activation in thyroid cancer. J Clin Invest 115:94–101. [DOI] [PMC free article] [PubMed] [Google Scholar]
- 3. Cin H, Meyer C, Herr R, Janzarik WG, Lambert S, Jones DT et al (2011) Oncogenic FAM131B‐BRAF fusion resulting from 7q34 deletion comprises an alternative mechanism of MAPK pathway activation in pilocytic astrocytoma. Acta Neuropathol 121:763–774. [DOI] [PubMed] [Google Scholar]
- 4. Colin C, Padovani L, Chappe C, Mercurio S, Scavarda D, Loundou A et al (2013) Outcome analysis of childhood pilocytic astrocytomas: a retrospective study of 148 cases at a single institution. Neuropathol Appl Neurobiol 39:693–705. [DOI] [PubMed] [Google Scholar]
- 5. Dahiya S, Yu J, Kaul A, Leonard JR, Gutmann DH (2012) Novel BRAF alteration in a sporadic pilocytic astrocytoma. Case Rep Med 2012:418672. [DOI] [PMC free article] [PubMed] [Google Scholar]
- 6. Davies H, Bignell GR, Cox C, Stephens P, Edkins S, Clegg S et al (2002) Mutations of the BRAF gene in human cancer. Nature 417:949–954. [DOI] [PubMed] [Google Scholar]
- 7. von Deimling A, Krone W, Menon AG (1995) Neurofibromatosis type 1: pathology, clinical features and molecular genetics. Brain Pathol 5:153–162. [DOI] [PubMed] [Google Scholar]
- 8. Deshmukh H, Yeh TH, Yu J, Sharma MK, Perry A, Leonard JR et al (2008) High‐resolution, dual‐platform aCGH analysis reveals frequent HIPK2 amplification and increased expression in pilocytic astrocytomas. Oncogene 27:4745–4751. [DOI] [PubMed] [Google Scholar]
- 9. Dimitriadis E, Alexiou GA, Tsotsou P, Simeonidi E, Stefanaki K, Patereli A et al (2013) BRAF alterations in pediatric low grade gliomas and mixed neuronal‐glial tumors. J Neurooncol 113:353–358. [DOI] [PubMed] [Google Scholar]
- 10. Dougherty MJ, Santi M, Brose MS, Ma C, Resnick AC, Sievert AJ et al (2010) Activating mutations in BRAF characterize a spectrum of pediatric low‐grade gliomas. Neuro‐Oncol 12:621–630. [DOI] [PMC free article] [PubMed] [Google Scholar]
- 11. Dougherty MJ, Tooke LS, Sullivan LM, Hakonarson H, Wainwright LM, Biegel JA (2012) Clinical utilization of high‐resolution single nucleotide polymorphism based oligonucleotide arrays in diagnostic studies of pediatric patients with solid tumors. Cancer Genet 205:42–54. [DOI] [PubMed] [Google Scholar]
- 12. Fisher PG, Tihan T, Goldthwaite PT, Wharam MD, Carson BS, Weingart JD et al (2008) Outcome analysis of childhood low‐grade astrocytomas. Pediatr Blood Cancer 51:245–250. [DOI] [PubMed] [Google Scholar]
- 13. Forshew T, Tatevossian RG, Lawson AR, Ma J, Neale G, Ogunkolade BW et al (2009) Activation of the ERK/MAPK pathway: a signature genetic defect in posterior fossa pilocytic astrocytomas. J Pathol 218:172–181. [DOI] [PubMed] [Google Scholar]
- 14. Hawkins C, Walker E, Mohamed N, Zhang C, Jacob K, Shirinian M et al (2011) BRAF‐KIAA1549 fusion predicts better clinical outcome in pediatric low‐grade astrocytoma. Clin Cancer Res 17:4790–4798. [DOI] [PubMed] [Google Scholar]
- 15. Horbinski C, Hamilton RL, Nikiforov Y, Pollack IF (2010) Association of molecular alterations, including BRAF, with biology and outcome in pilocytic astrocytomas. Acta Neuropathol 119:641–649. [DOI] [PMC free article] [PubMed] [Google Scholar]
- 16. Horbinski C, Nikiforova MN, Hagenkord JM, Hamilton RL, Pollack IF (2012) Interplay among BRAF, p16, p53, and MIB1 in pediatric low‐grade gliomas. Neuro‐Oncol 14:777–789. [DOI] [PMC free article] [PubMed] [Google Scholar]
- 17. Jacob K, Albrecht S, Sollier C, Faury D, Sader E, Montpetit A et al (2009) Duplication of 7q34 is specific to juvenile pilocytic astrocytomas and a hallmark of cerebellar and optic pathway tumours. Br J Cancer 101:722–733. [DOI] [PMC free article] [PubMed] [Google Scholar]
- 18. Janzarik WG, Kratz CP, Loges NT, Olbrich H, Klein C, Schafer T et al (2007) Further evidence for a somatic KRAS mutation in a pilocytic astrocytoma. Neuropediatrics 38:61–63. [DOI] [PubMed] [Google Scholar]
- 19. Jones DT, Gronych J, Lichter P, Witt O, Pfister SM (2012) MAPK pathway activation in pilocytic astrocytoma. Cell Mol Life Sci 69:1799–1811. [DOI] [PMC free article] [PubMed] [Google Scholar]
- 20. Jones DT, Hutter B, Jager N, Korshunov A, Kool M, Warnatz HJ et al (2013) Recurrent somatic alterations of FGFR1 and NTRK2 in pilocytic astrocytoma. Nat Genet 45:927–932. [DOI] [PMC free article] [PubMed] [Google Scholar]
- 21. Jones DT, Kocialkowski S, Liu L, Pearson DM, Backlund LM, Ichimura K et al (2008) Tandem duplication producing a novel oncogenic BRAF fusion gene defines the majority of pilocytic astrocytomas. Cancer Res 68:8673–8677. [DOI] [PMC free article] [PubMed] [Google Scholar]
- 22. Jones DT, Kocialkowski S, Liu L, Pearson DM, Ichimura K, Collins VP (2009) Oncogenic RAF1 rearrangement and a novel BRAF mutation as alternatives to KIAA1549:BRAF fusion in activating the MAPK pathway in pilocytic astrocytoma. Oncogene 28:2119–2123. [DOI] [PMC free article] [PubMed] [Google Scholar]
- 23. Kieran MW, Walker D, Frappaz D, Prados M (2010) Brain tumors: from childhood through adolescence into adulthood. J Clin Oncol 28:4783–4789. [DOI] [PubMed] [Google Scholar]
- 24. Korshunov A, Meyer J, Capper D, Christians A, Remke M, Witt H et al (2009) Combined molecular analysis of BRAF and IDH1 distinguishes pilocytic astrocytoma from diffuse astrocytoma. Acta Neuropathol 118:401–405. [DOI] [PubMed] [Google Scholar]
- 25. Lawson AR, Hindley GF, Forshew T, Tatevossian RG, Jamie GA, Kelly GP et al (2011) RAF gene fusion breakpoints in pediatric brain tumors are characterized by significant enrichment of sequence microhomology. Genome Res 21:505–514. [DOI] [PMC free article] [PubMed] [Google Scholar]
- 26. Lawson AR, Tatevossian RG, Phipps KP, Picker SR, Michalski A, Sheer D et al (2010) RAF gene fusions are specific to pilocytic astrocytoma in a broad paediatric brain tumour cohort. Acta Neuropathol 120:271–273. [DOI] [PubMed] [Google Scholar]
- 27. Lin A, Rodriguez FJ, Karajannis MA, Williams SC, Legault G, Zagzag D et al (2012) BRAF alterations in primary glial and glioneuronal neoplasms of the central nervous system with identification of 2 novel KIAA1549:BRAF fusion variants. J Neuropathol Exp Neurol 71:66–72. [DOI] [PMC free article] [PubMed] [Google Scholar]
- 28. Louis DN, Ohgaki H, Wiestler OD, Cavenee WK, Burger PC, Jouvet A et al (2007) The 2007 WHO classification of tumours of the central nervous system. Acta Neuropathol 114:97–109. [DOI] [PMC free article] [PubMed] [Google Scholar]
- 29. Ohgaki H, Kleihues P (2005) Population‐based studies on incidence, survival rates, and genetic alterations in astrocytic and oligodendroglial gliomas. J Neuropathol Exp Neurol 64:479–489. [DOI] [PubMed] [Google Scholar]
- 30. Palanisamy N, Ateeq B, Kalyana‐Sundaram S, Pflueger D, Ramnarayanan K, Shankar S et al (2010) Rearrangements of the RAF kinase pathway in prostate cancer, gastric cancer and melanoma. Nat Med 16:793–798. [DOI] [PMC free article] [PubMed] [Google Scholar]
- 31. Pfister S, Janzarik WG, Remke M, Ernst A, Werft W, Becker N et al (2008) BRAF gene duplication constitutes a mechanism of MAPK pathway activation in low‐grade astrocytomas. J Clin Invest 118:1739–1749. [DOI] [PMC free article] [PubMed] [Google Scholar]
- 32. Ramkissoon LA, Horowitz PM, Craig JM, Ramkissoon SH, Rich BE, Schumacher SE et al (2013) Genomic analysis of diffuse pediatric low‐grade gliomas identifies recurrent oncogenic truncating rearrangements in the transcription factor MYBL1. Proc Natl Acad Sci U S A 110:8188–8193. [DOI] [PMC free article] [PubMed] [Google Scholar]
- 33. Rodriguez FJ, Lim KS, Bowers D, Eberhart CG (2013) Pathological and molecular advances in pediatric low‐grade astrocytoma. Annu Rev Pathol 8:361–379. [DOI] [PMC free article] [PubMed] [Google Scholar]
- 34. Roth J, Santi M, Rorke‐Adams L, Harding B, Busse T, Tooke L et al (2014) Diagnostic application of high resolution single nucleotide polymorphism arrays for children with brain tumors. Cancer Genet 207:111–123. [DOI] [PMC free article] [PubMed] [Google Scholar]
- 35. Sharma MK, Zehnbauer BA, Watson MA, Gutmann DH (2005) RAS pathway activation and an oncogenic RAS mutation in sporadic pilocytic astrocytoma. Neurology 65:1335–1336. [DOI] [PubMed] [Google Scholar]
- 36. Sievert AJ, Jackson EM, Gai X, Hakonarson H, Judkins AR, Resnick AC et al (2009) Duplication of 7q34 in pediatric low‐grade astrocytomas detected by high‐density single‐nucleotide polymorphism‐based genotype arrays results in a novel BRAF fusion gene. Brain Pathol 19:449–458. [DOI] [PMC free article] [PubMed] [Google Scholar]
- 37. Sievert AJ, Lang SS, Boucher KL, Madsen PJ, Slaunwhite E, Choudhari N et al (2013) Paradoxical activation and RAF inhibitor resistance of BRAF protein kinase fusions characterizing pediatric astrocytomas. Proc Natl Acad Sci U S A 110:5957–5962. [DOI] [PMC free article] [PubMed] [Google Scholar]
- 38. Tatevossian RG, Tang B, Dalton J, Forshew T, Lawson AR, Ma J et al (2010) MYB upregulation and genetic aberrations in a subset of pediatric low‐grade gliomas. Acta Neuropathol 120:731–743. [DOI] [PMC free article] [PubMed] [Google Scholar]
- 39. Tran NH, Wu X, Frost JA (2005) B‐Raf and Raf‐1 are regulated by distinct autoregulatory mechanisms. J Biol Chem 280:16244–16253. [DOI] [PubMed] [Google Scholar]
- 40. Zhang J, Wu G, Miller CP, Tatevossian RG, Dalton JD, Tang B et al (2013) Whole‐genome sequencing identifies genetic alterations in pediatric low‐grade gliomas. Nat Genet 45:602–612. [DOI] [PMC free article] [PubMed] [Google Scholar]