

Abstract
Context:
By genome-wide association studies, the risk allele [A] of SNP rs965513 predisposes strongly to papillary thyroid carcinoma (PTC). It is located in a gene-poor region of 9q22, some 60 kb from the FOXE1 gene. The underlying mechanisms remain to be discovered.
Objective:
Our objective was to identify novel transcripts in the 9q22 locus and correlate gene expression levels with the genotypes of rs965513.
Design:
We performed 3′ and 5′ rapid amplification of cDNA ends and RT-PCR to detect novel transcripts. One novel transcript was forcibly expressed in a cell line followed by gene expression array analysis. We genotyped rs965513 from PTC patients and measured gene expression levels by real-time RT-PCR in unaffected thyroid tissue and matched tumor.
Setting:
This was a laboratory-based study using cells from clinical tissue samples and a cancer cell line.
Main Outcome Measures:
We detected previously uncharacterized transcripts and evaluated the gene expression levels and the correlation with the risk allele of rs965513, age, gender, chronic lymphocyte thyroiditis (CLT), and TSH levels.
Results:
We found a novel long intergenic noncoding RNA gene and named it papillary thyroid cancer susceptibility candidate 2 (PTCSC2). Transcripts of PTCSC2 are down-regulated in PTC tumors. The risk allele [A] of rs965513 was significantly associated with low expression of unspliced PTCSC2, FOXE1, and TSHR in unaffected thyroid tissue. We also observed a significant association of age and CLT with PTCSC2 unspliced transcript levels. The correlation between the rs965513 genotype and the PTCSC2 unspliced transcript levels remained significant after adjusting for age, gender, and CLT. Forced expression of PTCSC2 in the BCPAP cell line affected the expression of a subset of noncoding and coding transcripts with enrichment of genes functionally involved in cell cycle and cancer.
Conclusions:
Our data suggest a role for PTCSC2, FOXE1, and TSHR in the predisposition to PTC.
Thyroid cancer represents approximately 1% of newly diagnosed cancers and is the most common endocrine malignancy. Almost all thyroid cancers are nonmedullary thyroid carcinoma. Papillary thyroid carcinoma (PTC) is the main form of nonmedullary thyroid carcinoma, accounting for approximately 80% of all thyroid cancers. PTC is mostly sporadic, whereas 5 to 10% are familial. Contrary to many other cancers, the incidence of PTC is increasing in recent decades, but this may be due to improved diagnostics (1). Although the etiology of PTC is not well characterized, it is clearly influenced by both genetic and environmental factors. Radiation exposure of the thyroid during childhood is the most clearly defined environmental factor associated with PTC. On the other hand, PTC shows a high degree of heritability. Genetic predisposition plays a major role, as evidenced by case control studies (2, 3). In the virtual absence of high-penetrance Mendelian-type causative genes, the genetic factors can likely be attributed to many low-penetrance DNA variants in the human genome (4–6).
Recently, significant advances have been made in searching for DNA variants predisposing to PTC through genome-wide association studies (GWAS). Single nucleotide polymorphisms (SNPs) associated with PTC risk have been identified on chromosomes 5q24, 8q24, 9q22, and 14q13 (4, 7–9). The odds ratio for the 9q22 SNP is as high as approximately 1.8 (4). The association of rs965513 in 9q22 and thyroid cancer risk has been independently replicated by subsequent studies in different populations (5, 9–14). The association was also observed in familial PTC and radiation-induced PTC patients (8, 15–17). SNP rs965513 is located in an approximately 160-kb long stretch of sequence that is devoid of well-characterized genes. Interestingly, the closest annotated coding gene in this area is forkhead box E1 (FOXE1) (also known as thyroid transcription factor 2), a gene highly involved in thyroid development and function (18–20). The FOXE1 gene resides approximately 60 kb downstream from rs965513, whereas the xeroderma pigmentosum, complementation group A (XPA) gene resides about 96 kb upstream from this SNP. In an effort to elucidate the functional basis of the underlying disease risk, we searched for the presence of unannotated transcripts (eg, noncoding RNAs or unknown protein-coding genes) and performed gene expression analyses to correlate the genotypes of rs965513 with the gene expression levels. Previously, an association was noted between PTC and low serum levels of TSH (4, 7). This observation prompted us to search for associations between rs965513 and the TSH receptor gene (TSHR). Herein we describe a thyroid tissue-specific long intergenic noncoding (lincRNA) gene, PTC susceptibility candidate 2 (PTCSC2), in the 9q22 locus. We performed initial functional analyses of PTCSC2 and examined the correlation between the genotypes of rs965513 and the expression levels of PTCSC2, FOXE1, XPA, and TSHR in thyroid tissues.
Patients and Methods
The studies were approved by the Institutional Review Board at the Ohio State University (OSU), and all subjects gave written informed consent before participation.
Patients and sample collection
All samples included in this study were collected at OSU as part of ongoing studies, and patients were histologically of the PTC type. Pathology reports of all the cases were re-reviewed for histological subtype and the presence or absence of chronic lymphocytic thyroiditis (CLT). The clinical and demographic information of the patients can be found in Supplemental Table 1. Unaffected thyroid tissue samples were obtained from the same patient either from the contralateral lobe of the thyroid or adjacent to the tumor. Normal thyroid tissue samples were collected from two consenting individuals who had surgery because of laryngeal malignancy but no thyroid disease. Genomic DNA was extracted from blood according to standard phenol-chloroform extraction procedures. Thyroid tissue samples were snap-frozen in liquid nitrogen and stored at −80°C. Total RNA from thyroid tissue was extracted using Trizol solution according to the manufacturer's protocol (Invitrogen).
Rapid amplification of cDNA ends (RACE) and RT-PCR
The RNA Ligase-Mediated-RACE kit (Ambion) was used according to the protocol of the manufacturer. The HotStarTaq Master Mix kit (QIAGEN) and Q-Solution (QIAGEN) were used for nested PCRs. The TOPO TA kit (Invitrogen) was used to clone nested amplicons into the pCR4-TOPO vector. The clones were sequenced using M13 primers. Primers for RT-PCRs were designed using Primer3 software and mapped to the human genome GRCh39/hg19 assembly. The primer sequences are provided in Supplemental Table 2.
Microarray hybridization after transfection with PTCSC2-c
Cells from the BCPAP cell line were transfected in quadruplicate with the PTCSC2-c expression vector and with empty vector (pcDNA3) as control using Lipofectamine2000 reagent (Invitrogen). At 24 hours after transfection, the cells were harvested, and total RNA was extracted (Trizol reagent; Invitrogen) and DNase-1 treated (Ambion). BioAnalyzer 2100 (Agilent) was used to assess RNA integrity and the High Capacity Reverse Transcriptase kit was applied to produce cDNA (Applied Biosystems). To confirm the expression of PTCSC2 in BCPAP cells, semiquantitative RT-PCR was performed. Agarose gel electrophoresis analysis showed no bands for control (empty vector) and bands for the expression vector (see Figure 3A). SurePrint G3 Human Gene Expression 8 × 60k Kit (Agilent) was used to assess gene expression. RNA samples were labeled with cyanine-3 using the Agilent One-Color Labeling kit and hybridized to the array according to the manufacturer's protocol. The signal was detected with an Agilent DNA Microarray Scanner and imported into Excel spreadsheets (Microsoft Corp).
Figure 3.
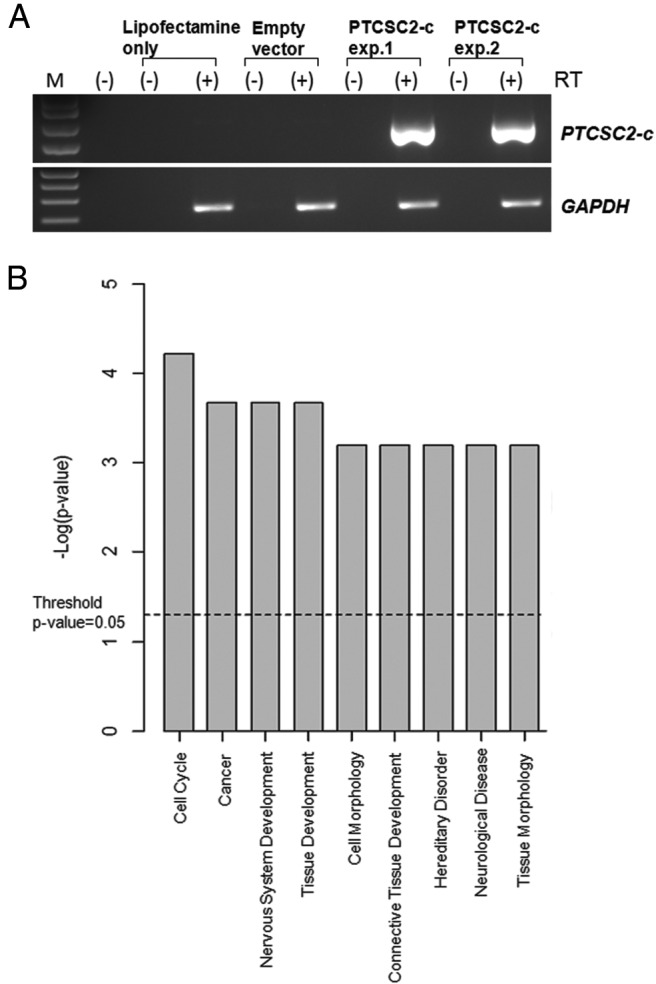
Forced expression of PTCSC2-c in BCPAP cells. A, Expression of PTCSC2-c in BCPCP cell line after 24-hour transfection. GAPDH was used as an internal control. RT, Reverse transcriptase. Exp. 1 and exp. 2 represent two separate experiments. B, Key functional groups based on IPA analysis of differentially expressed coding genes in BCPAP cells with forced expression of PTCSC2-c (differential expression genes with P values < .05 and fold changes ≥ 1.25).
Semiquantitative and quantitative RT-PCR
Total RNA (1 μg) was first treated with DNase-1 (Ambion) and then reverse-transcribed to cDNA with the High Capacity Reverse Transcriptase kit (Applied Biosystems). Selected genes and an endogenous control gene, glyceraldeyde-3-phosphate dehydrogenase (GAPDH), were used for semiquantitative RT-PCR. Quantitative real-time PCR was performed using an ABI PRISM 7700 DNA Sequence Detection System (Applied Biosystems), and TaqMan assay with custom probes (Life Technologies) was applied for measuring PTCSC2 expression (Supplemental Table 2). TaqMan probe kits (Life Technologies) for FOXE1 (Hs00916085_sl), XPA (Hs00166045_ml), and TSHR (Hs01053846_ml) were used. GAPDH TaqMan kit was used as an internal control, and the formula 2−ΔCt, where ΔCt = Ct(GENE) − Ct(GAPDH), was employed to calculate the relative transcript levels for each analyzed gene.
Genotyping SNP rs965513
Blood genomic DNA from PTC patients was used for genotyping SNP rs965513 with a SNaPshot assay as described (21). The PCR primer and extension primer sequences are provided in Supplemental Table 2. The PCR assays were performed according to a standard protocol as follows: 2 minutes at 94°C; followed by 30 cycles of 30 seconds at 94°C, 30 seconds at 58°C, and 30 seconds at 72°C; followed by a final extension of 10 minutes at 72°C. An ABI 3730 DNA Analyzer was used for allele analysis.
Statistical analysis
Raw gene expression data from Agilent microarrays were quantile normalized, and replicated spots were averaged. All the array expression data were log2 transformed before analysis. The impact of PTCSC2 compared to empty vector was evaluated by applying random variance model t test using BRB-Array Tools software (http://linus.nci.nih.gov/BRB-ArrayTools.html) (22). Network and functional analyses of differentially expressed genes were performed using Ingenuity Pathway Analysis (IPA) software (Ingenuity Systems Inc; www.ingenuity.com). Association between quantitative PCR expression estimates and genotypes was analyzed using generalized linear models. PTCSC2 expression between tumor-normal pairs was analyzed using linear mixed models. The expression values were log2 transformed to fulfill normal distribution assumptions. Analysis was performed using the R software version 3.0.2 (http://www.r-project.org/).
Results
Abundant noncoding transcripts in 9q22 detected in normal thyroid tissue
To search for unannotated transcripts in 9q22, we performed long-range RT-PCR and 5′ and 3′ RACE using normal human thyroid tissue samples. We detected abundant unspliced and spliced transcripts and named the corresponding gene PTC susceptibility candidate 2 (PTCSC2). Databases report three spliced expressed sequence tags (ESTs) (BE073442, BE073439, and CN299071) supporting the spliced transcripts (Figure 1A). The unspliced transcript of PTCSC2 (>60 kb) spans the genomic region containing SNP rs965513. With regard to the spliced transcript of PTCSC2, we identified multiple isoforms. A schematic representation of each isoform is shown in Figure 1B. One example is isoform c, with 11 exons and a length of 1947 bp. To date, eight isoform transcripts due to alternative splicing have been detected (PTCSC2, a–h; Figure 1B). The cDNA sequences (partial sequences of a, b, and d–h) of the spliced PTCSC2 isoforms have been submitted to GenBank (http://www.ncbi.nlm.nih.gov/genbank/) with accession numbers from KJ700444 to KJ700451. SNP rs965513 is located in intron 4 of isoform c. Whether these are the complete transcripts in the 9q22 locus remains unclear.
Figure 1.

A lincRNA gene PTCSC2 in 9q22. A, PTCSC2 gene structures: unspliced and spliced transcripts (isoform-c) spanning the genomic region containing SNP rs965513. Vertical lines represent exons. Both transcripts are produced from the reverse strand (opposite FOXE1). B, PTCSC2-spliced molecular structures and eight isoforms. Each box represents an exon. Exon 4a is an alternative exon that contains 126 extra nucleotides at the 3′ end of exon 4. C, Expression of unspliced PTCSC2 in human normal tissues. D, Expression of spliced PTCSC2 isoforms in human normal tissues. GAPDH was used as an internal control in C and D.
To test whether the transcripts of the PTCSC2 gene can be detected in tissues other than thyroid, we performed semiquantitative RT-PCR using RNAs obtained from multiple tissues. The unspliced PTCSC2 is relatively highly expressed in thyroid, brain, and fetal brain (Figure 1C). Importantly, the spliced PTCSC2 isoform transcripts (a–d) are almost uniquely expressed in normal thyroid with only very faint bands in fetal brain (Figure 1D), suggesting high tissue specificity. Strand-specific RT-PCR indicated that PTCSC2 is transcribed in the reverse strand of the genome in the opposite direction of the FOXE1 gene.
To characterize and define the putative function of PTCSC2, we performed computational analysis by integrating with the current genome annotations available at UCSC Genome Browser. Open reading frame analysis of the transcript sequences of PTCSC2 did not reveal any potential coding regions with more than 100 amino acids. No shared homology with any known coding genes or protein domain structures was found. Computational analysis revealed that some exons of PTCSC2 are composed of repetitive DNA sequences, eg, LINEs and SINEs (Family Alu), suggesting that these exons were produced by retrotransposable elements. The genes that emanate from mobile genetic elements such as transposons or retrotransposons are usually noncoding RNA genes, despite sometimes having short open reading frames (23).
Aberrant expression of PTCSC2 in PTC tumors and the correlation between rs965513 and PTCSC2 expression levels
To examine the expression levels of PTCSC2 in thyroid cancer, we performed semiquantitative RT-PCR and real-time RT-PCR in six thyroid cancer cell lines using primers specific for detecting the unspliced form and four spliced isoforms (a, b, c, and d). The expression of PTCSC2 was undetectable in three thyroid cancer cell lines (BCPAP, C646, and FTC133), and markedly down-expressed in KTC1, SW1736, and TPC1 cells when compared with normal thyroid tissue (Figure 2A and Supplemental Figure 1). BCPAP, KTC1, and TPC1 cell lines are derived from PTC, whereas C643 and SW1736 are poorly differentiated anaplastic thyroid carcinoma derived, and FTC133 is a follicular thyroid carcinoma cell line. We did not notice correlation between differential status and cancer types of these cell lines and the expression levels of PTCSC2. We further analyzed PTCSC2 expression in thyroid tissues from PTC patients (n = 65) using probe-specific TaqMan real-time RT-PCR for detecting unspliced and spliced transcripts of PTCSC2. The relative expression levels in PTC tumors were compared with matched normal unaffected thyroid tissue from the same patient. The spliced transcript with primers in exons 10 and 11 of PTCSC2 was significantly down-expressed in PTC tumors (Figure 2B). The set of primers in exons 10 and 11 can identify at least isoforms c, d, and e. We also observed significant down-expression of unspliced PTCSC2 in PTC tumors (Supplemental Figure 2). In an attempt to test whether the DNA variant rs965513 has any association with the expression of PTCSC2, we genotyped rs965513 in these PTC patients and correlated the genotypes with the gene expression levels. We observed significant correlation between the [AA] genotype and down-expression of PTCSC2 unspliced transcript levels in unaffected thyroid tissues. We also observed a significant effect of age and CLT, but not gender and preoperative TSH level, on PTCSC2 unspliced transcript levels (Supplemental Table 3). The correlation between the rs965513 genotypes and the PTCSC2 unspliced transcript levels remained significant after adjusting for age, gender, and CLT (Figure 2C). However, the association was not significant for spliced PTCSC2 levels with unique primer pairs and probes for isoform a (P value, .471), isoform b (P value, .407), isoform c (P value, .840), and isoform d (P value, .577). We did not observe significant association of rs965513 with PTCSC2 expression levels of unspliced and spliced transcripts in PTC tumors (Supplemental Figure 3).
Figure 2.
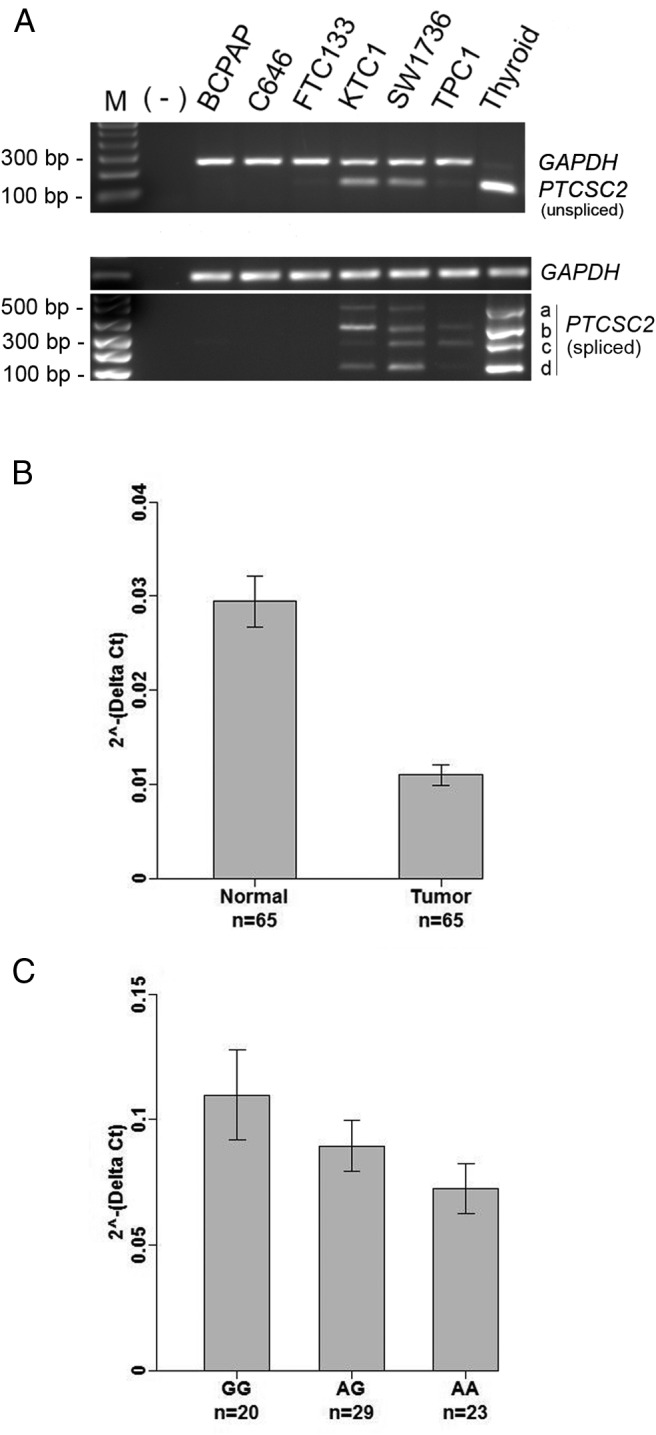
Gene expression analysis of PTCSC2 in PTC tumors. A, Semiquantitative RT-PCR of PTCSC2 in thyroid cancer cell lines. B, Real-time RT-PCR analysis in PTC tumors and matched unaffected thyroid tissue in PTC patients. n, sample numbers. Depicted are the relative expression levels of PTCSC2 in unaffected thyroid tissue and PTC tumors. The relative expression level was normalized using GAPDH as an internal control. The expression levels are lower in the tumors; linear mixed model analysis, P value = 1.870597e-13. C, Correlation between the genotypes of rs965513 and the PTCSC2 unspliced transcript levels in unaffected thyroid tissues. n, sample numbers; GG, AG, AA, genotypes of rs965513. Data were analyzed using generalized linear models, AA vs GG, P value = .036; AG vs GG, P value = .121). The P values were adjusted for age, gender, and CLT in B and C.
PTCSC2 is involved in the regulation and interaction of coding and noncoding genes
In an attempt to define the biological role of PTCSC2, we transiently transfected BCPAP cells (a PTC cell line that completely lacks expression of PTCSC2) with a PTCSC2-c expression construct or an empty vector (pcDNA3) as a control. The cells transfected with the PTCSC2-c construct showed a strong RT-PCR band in the presence of reverse transcriptase, but not in the absence of reverse transcriptase (Figure 3A). To assess the effect of ectopically expressed PTCSC2-c on other genes, we analyzed gene expression 24 hours after transfection using the Agilent SurePrint G3 Human GE8 × 60K array. The data were filtered by using volcano plot (P < .05; fold change > 1.25) to create a list of genes dysregulated by PTCSC2-c (total probes, n = 533; up-regulated, n = 308; down-regulated, n = 225). Notably, about half of the probes (n = 278; 52.2%) were in coding genes, whereas the other probes (n = 255; 47.8%) were in noncoding RNAs, pseudogenes, and uncharacterized transcripts. Biological functional analysis of coding genes using IPA software indicated that the differentially expressed genes belong to over 20 different categories—the top two categories being cell cycle and cancer (Figure 3B). Network analysis revealed several potential networks, with the top network of cell cycle and cell-to-cell signaling and interaction (Supplemental Figure 4).
Correlation between SNP rs965513 genotypes and gene expression levels
We further analyzed gene expression of FOXE1, TSHR, and XPA in thyroid tissues from PTC patients and correlated them with the genotypes of rs965513. Quantitative real-time RT-PCR was performed to measure gene expression in unaffected thyroid tissue and PTC tumor samples. In unaffected thyroid tissue, FOXE1 expression was significantly lower in individuals with the AA genotype when compared with individuals with the GG genotype (Figure 4A), whereas there was no significant correlation with the expression levels in PTC tumors (Supplemental Figure 5). Similarly, the risk allele [A] of rs965513 was correlated with low expression of TSHR in unaffected thyroid tissue (Figure 4B) but not in PTC tumors (Supplemental Figure 5). We did not observe any correlation between genotypes of rs965513 and the expression levels of XPA in unaffected thyroid tissue or in PTC tumors (Figure 4C and Supplemental Figure 5). We did not observe any significant effect of age, gender, CLT, and preoperative TSH levels on transcript levels of FOXE1, TSHR, and XPA (Supplemental Table 3). We were unable to test for differences in expression between histological subtypes (eg, PTC, classic vs PTC, follicular variant) given the small sample sizes.
Figure 4.
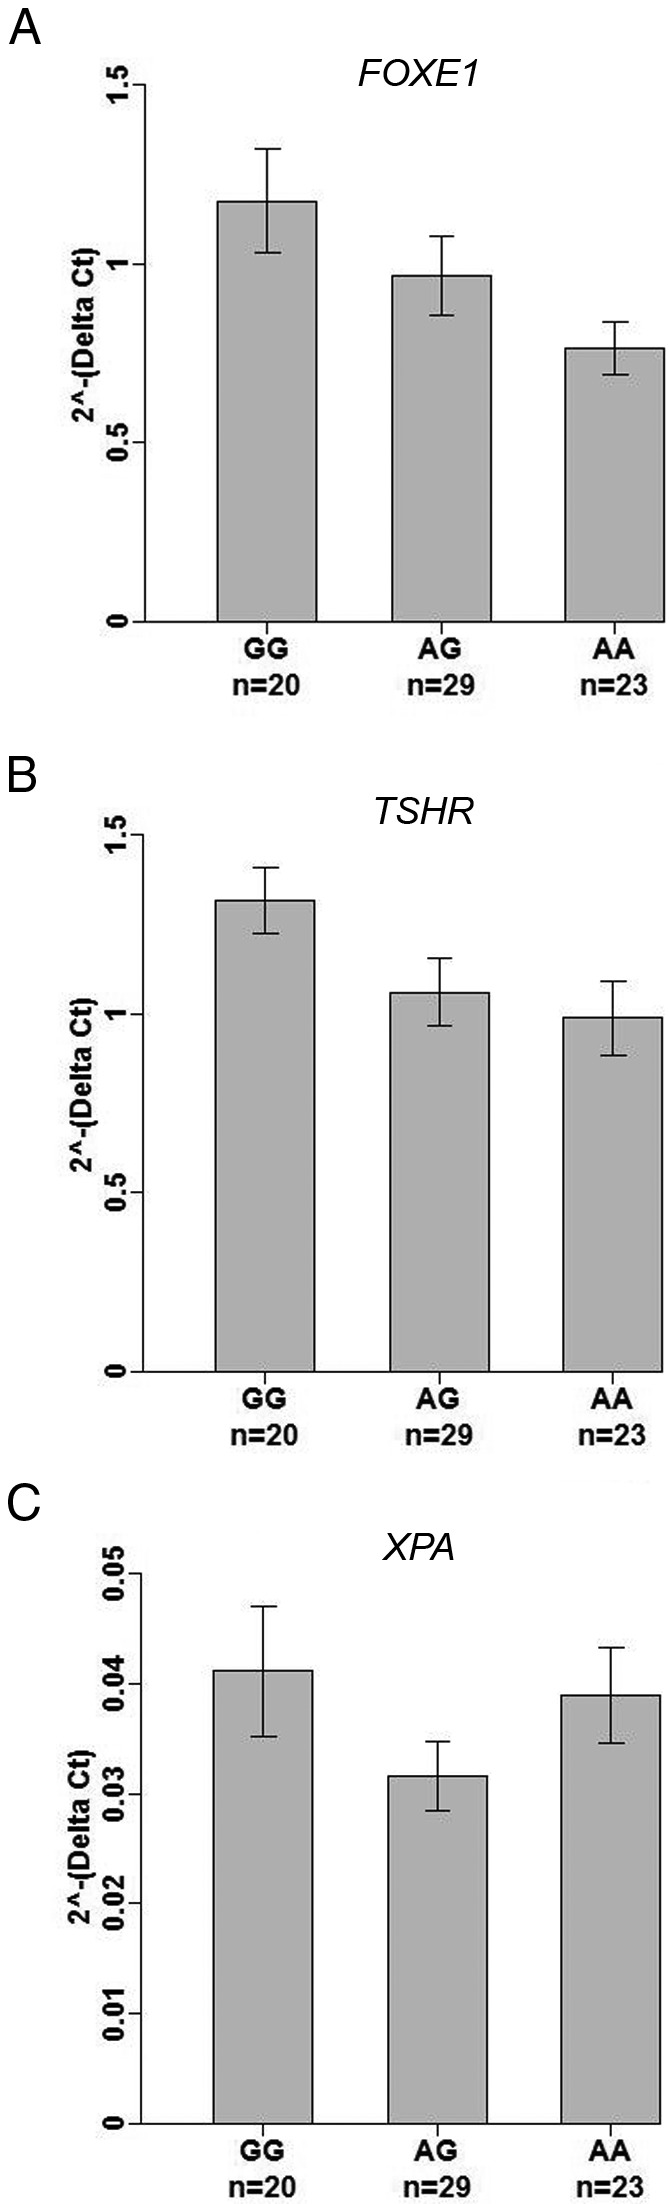
Correlation between genotypes of rs965513 and the gene expression levels in unaffected thyroid tissue. n, sample numbers; GG, AG, AA, genotypes of rs965513. Data were analyzed using generalized linear models. The P values were adjusted for age, gender, and CLT. A, FOXE1, AA vs GG, P value = .012; AG vs GG, P value = .066. B, TSHR, AA vs GG, P value = .024; AG vs GG, P value = .023. C, XPA, AA vs GG, P value = .885; AG vs GG, P value = .120.
Discussion
Although GWAS and other association studies have revealed a strong association between SNP rs965513 in 9q22 and thyroid cancer risk (mainly PTC), the underlying mechanisms remain unknown. In the current study, we identified a lincRNA gene, PTCSC2, which spans the location of rs965513 and the entire “gene-poor” 9q22 intergenic region. Previously, our group reported two long noncoding RNA genes (PTCSC1 in 8q24 and PTCSC3 in 14q13) as PTC susceptibility candidate genes (21, 24). Together with PTCSC2 in 9q22, it seems that a class of prototype noncoding regulatory RNA genes plays important roles in thyroid cancer predisposition. Decreased expression in PTC tumors is a common feature for the three noncoding RNAs (PTCSC1, PTCSC2, and PTCSC3), implying that these transcripts act as tumor suppressors. We noticed that expression of PTCSC2 was absent or remarkably decreased in six thyroid cancer lines we tested, but there was no correlation with the differentiation status and cancer types. It appears that the lowered expression occurs when the normal thyroid tissue dedifferentiates into cancer (24).
The expression of the spliced transcripts of PTCSC2 appeared to be thyroid tissue-specific, which is similar to PTCSC3 in 14q13 and is consistent with reports of other lincRNAs, suggesting a tissue-specific type regulatory molecule (25). It has been reported that > 25% of long non-coding RNA (ncRNA) genes show evidence of alternative splicing with at least two different transcript isoforms per gene locus. The most highly spliced ncRNA gene is PCBP1-AS1 with 40 annotated isoforms (26). The function and significance of different isoform transcripts remain largely unknown. One example is maternally expressed gene 3 (MEG3), which is an imprinted lincRNA gene with 12 isoform transcripts and is highly expressed in human pituitary (27). Zhang et al (27) showed evidence that the secondary RNA structure of different isoform transcripts could be critical for the biological function of the MEG3 gene. The multiple splicing isoforms of PTCSC2 may be involved in different functions as seen in PTEN regulation (28). The PTEN pseudogene (PTENpg1) expresses noncoding RNA with two isoforms, α and β. The α isoform functions in trans, localizes to the PTEN promoter, and epigenetically modulates PTEN transcription by the recruitment of DNA methyltransferase 3a and enhancer of Zeste. In contrast, the β isoform interacts with PTENpg1 through an RNA-RNA pairing interaction. These examples illustrate the complex mechanisms and functions of lincRNA splicing isoforms.
LincRNAs represent a rapidly growing class of RNA genes with functions related primarily to transcriptional and post-transcriptional control of gene expression (25, 29, 30). The mechanisms by which PTCSC2 influences unaffected thyroid and thyroid cancer remain unknown. We speculated that PTCSC2 may have an impact on the expression of other genes. Indeed, forced expression of PTCSC2 in a thyroid cancer cell line (BCPAP) revealed a subset of differentially expressed genes, about half of them belonging to the noncoding RNA gene category. IPA analysis of the differentially expressed coding genes indicated that genes with biological functions in cell cycle and cancer were enriched; they could be involved in cell-cell interactions and signaling networks. Our initial analysis suggests that PTCSC2 may function as a regulatory molecule in a thyroid-specific manner. This concept is also supported by experimental evidence in other lincRNAs (31).
We observed that the risk allele [A] of DNA variant rs965513 in 9q22 is associated with low expression levels of PTCSC2 unspliced transcript, FOXE1, and TSHR in unaffected thyroid tissue. We also noticed that age and CLT are associated with PTCSC2 unspliced transcript levels but not with the other genes tested. Further studies of PTCSC2 and CLT are needed to dissect whether this is potentially useful for CLT diagnosis and implication in PTC tumorigenesis. We did not observe significant correlation of rs965513 with expression levels of spliced PTCSC2. Previous GWAS studies have revealed that rs965513 is associated with low serum TSH and free T4 levels in adults and in newborns and is associated with thyroid functions (7, 32–34). FOXE1 (also known as thyroid transcription factor 2) is essential for thyroid differentiation at the embryonic stage (35) and also plays an important role in regulating thyroid-specific genes including thyroglobulin (TG), thyroperoxidase (TPO), and sodium iodide symporter (NIS) (36). Transcriptional activation of thyroid-specific genes (TG and TPO) is under the regulation by TSHR via cAMP (37). TSHR is another important gene in thyroid development and thyroid function. We observed that the genotype of rs965513 was associated with expression levels of PTCSC2, FOXE1, and TSHR in unaffected thyroid tissues, suggesting perhaps a multilayered regulatory network in the thyroid. It is logical to assume that the lowered expression of FOXE1 and TSHR predisposes thyroid cells to dedifferentiate, an essential step toward malignant transformation. This is consistent with a repeatedly proposed theory that FOXE1 is involved in the pathogenesis of PTC (38, 39). FOXE1 contains a polymorphic polyalanine tract with 12–22 alanines. Bullock et al (38) reported that FOXE1(16Ala) was significantly associated with PTC, and functional studies in vitro showed that FOXE1(16Ala) was transcriptionally impaired compared with FOXE1(14Ala). Landa et al (39) reported that SNP rs1867277 in the 5′ untranslated region of FOXE1 was significantly associated with PTC. Although this association could be an independent association signal (11) or could be explained by linkage disequilibrium with rs965513 (our unpublished data), functional assays of rs1867227 revealed that the risk [A] allele led to a differential recruitment of USF1 and USF2 transcription factors, which was suspected to affect transcriptional regulation of FOXE1 (39). In our study, the 5′ end of PTCSC2 (isoform c) gene appears to overlap with the promoter region of FOXE1, implying they are functionally related. More work is warranted to explore whether PTCSC2 and FOXE1 interact with each other and by what mechanism the genotypes of rs965513 affect the transcriptional regulation of FOXE1 and TSHR. Finally, we noted that the genotypes of rs965513 had no effect on the expression of XPA, emphasizing the thyroid-specific nature of FOXE1 in 9q22 locus.
In conclusion, our study is an initial effort to functionally annotate rs965513 in 9q22 as a factor contributing to PTC risk. A thyroid-specific lincRNA gene, PTCSC2 in the 9q22 locus, is down expressed in PTC tumors. The risk allele [A] correlates with low expression of PTCSC2 unspliced transcript, FOXE1, and TSHR in unaffected thyroid tissue, but not in PTC tumors. It is likely that no single mechanism explains the functioning of the 9q22 locus in thyroid cancer.
Acknowledgments
We thank Drs Matthew Ringel and Paul Wakely for helpful discussions. We thank Ms Jan Lockman, Ms Barbara Fersch, and the OSU Comprehensive Cancer Center Nucleic Acid Shared Resource for SNP genotyping, sequencing, and real-time PCR. We thank Drs Matthew Ringel and Motoyasu Saji for providing thyroid cancer cell lines. Tissue samples were provided by the Cooperative Human Tissue Network, which is funded by the National Cancer Institute.
This work was supported by National Cancer Institute Grants P30CA16058, P01CA124570, and P50CA168505.
Disclosure Summary: The authors have nothing to disclose.
Footnotes
- CLT
- chronic lymphocyte thyroiditis
- GAPDH
- glyceraldeyde-3-phosphate dehydrogenase
- GWAS
- genome-wide association studies
- IPA
- Ingenuity Pathway Analysis
- lincRNA
- novel long intergenic noncoding RNA
- PTC
- papillary thyroid carcinoma
- PTCSC2
- papillary thyroid cancer susceptibility candidate 2
- RACE
- rapid amplification of cDNA ends
- SNP
- single nucleotide polymorphism
- XPA
- xeroderma pigmentosum, complementation group A (gene).
References
- 1. Davies L, Welch HG. Current thyroid cancer trends in the United States. JAMA Otolaryngol Head Neck Surg. 2014;140:317–322. [DOI] [PubMed] [Google Scholar]
- 2. Goldgar DE, Easton DF, Cannon-Albright LA, Skolnick MH. Systematic population-based assessment of cancer risk in first-degree relatives of cancer probands. J Natl Cancer Inst. 1994;86:1600–1608. [DOI] [PubMed] [Google Scholar]
- 3. Dong C, Hemminki K. Modification of cancer risks in offspring by sibling and parental cancers from 2,112,616 nuclear families. Int J Cancer. 2001;92:144–150. [PubMed] [Google Scholar]
- 4. Gudmundsson J, Sulem P, Gudbjartsson DF, et al. Common variants on 9q22.33 and 14q13.3 predispose to thyroid cancer in European populations. Nat Genet. 2009;41:460–464. [DOI] [PMC free article] [PubMed] [Google Scholar]
- 5. Liyanarachchi S, Wojcicka A, Li W, et al. Cumulative risk impact of five genetic variants associated with papillary thyroid carcinoma. Thyroid. 2013;23:1532–1540. [DOI] [PMC free article] [PubMed] [Google Scholar]
- 6. Landa I, Robledo M. Association studies in thyroid cancer susceptibility: are we on the right track? J Mol Endocrinol. 2011;47:R43–R58. [DOI] [PubMed] [Google Scholar]
- 7. Gudmundsson J, Sulem P, Gudbjartsson DF, et al. Discovery of common variants associated with low TSH levels and thyroid cancer risk. Nat Genet. 2012;44:319–322. [DOI] [PMC free article] [PubMed] [Google Scholar]
- 8. Takahashi M, Saenko VA, Rogounovitch TI, et al. The FOXE1 locus is a major genetic determinant for radiation-related thyroid carcinoma in Chernobyl. Hum Mol Genet. 2010;19:2516–2523. [DOI] [PubMed] [Google Scholar]
- 9. Köhler A, Chen B, Gemignani F, et al. Genome-wide association study on differentiated thyroid cancer. J Clin Endocrinol Metab. 2013;98:E1674–E1681. [DOI] [PubMed] [Google Scholar]
- 10. Matsuse M, Takahashi M, Mitsutake N, et al. The FOXE1 and NKX2–1 loci are associated with susceptibility to papillary thyroid carcinoma in the Japanese population. J Med Genet. 2011;48:645–648. [DOI] [PubMed] [Google Scholar]
- 11. Jones AM, Howarth KM, Martin L, et al. Thyroid cancer susceptibility polymorphisms: confirmation of loci on chromosomes 9q22 and 14q13, validation of a recessive 8q24 locus and failure to replicate a locus on 5q24. J Med Genet. 2012;49:158–163. [DOI] [PMC free article] [PubMed] [Google Scholar]
- 12. Wang YL, Feng SH, Guo SC, et al. Confirmation of papillary thyroid cancer susceptibility loci identified by genome-wide association studies of chromosomes 14q13, 9q22, 2q35 and 8p12 in a Chinese population. J Med Genet. 2013;50:689–695. [DOI] [PubMed] [Google Scholar]
- 13. Penna-Martinez M, Epp F, Kahles H, et al. FOXE1 association with differentiated thyroid cancer and its progression. Thyroid. 2014;24:845–851. [DOI] [PMC free article] [PubMed] [Google Scholar]
- 14. Zhu H, Xi Q, Liu L, Wang J, Gu M. Quantitative assessment of common genetic variants on FOXE1 and differentiated thyroid cancer risk. PLoS One. 2014;9:e87332. [DOI] [PMC free article] [PubMed] [Google Scholar]
- 15. Tomaz RA, Sousa I, Silva JG, et al. FOXE1 polymorphisms are associated with familial and sporadic nonmedullary thyroid cancer susceptibility. Clin Endocrinol (Oxf). 2012;77:926–933. [DOI] [PubMed] [Google Scholar]
- 16. Bonora E, Rizzato C, Diquigiovanni C, et al. The FOXE1 locus is a major genetic determinant for familial nonmedullary thyroid carcinoma. Int J Cancer. 2014;134:2098–2107. [DOI] [PubMed] [Google Scholar]
- 17. Damiola F, Byrnes G, Moissonnier M, et al. Contribution of ATM and FOXE1 (TTF2) to risk of papillary thyroid carcinoma in Belarusian children exposed to radiation. Int J Cancer. 2014;134:1659–1668. [DOI] [PubMed] [Google Scholar]
- 18. Damante G, Tell G, Di Lauro R. A unique combination of transcription factors controls differentiation of thyroid cells. Prog Nucleic Acid Res Mol Biol. 2001;66:307–356. [DOI] [PubMed] [Google Scholar]
- 19. Trueba SS, Augé J, Mattei G, et al. PAX8, TITF1, and FOXE1 gene expression patterns during human development: new insights into human thyroid development and thyroid dysgenesis-associated malformations. J Clin Endocrinol Metab. 2005;90:455–462. [DOI] [PubMed] [Google Scholar]
- 20. Cuesta I, Zaret KS, Santisteban P. The forkhead factor FOXE1 binds to the thyroperoxidase promoter during thyroid cell differentiation and modifies compacted chromatin structure. Mol Cell Biol. 2007;27:7302–7314. [DOI] [PMC free article] [PubMed] [Google Scholar]
- 21. He H, Nagy R, Liyanarachchi S, et al. A susceptibility locus for papillary thyroid carcinoma on chromosome 8q24. Cancer Res. 2009;69:625–631. [DOI] [PMC free article] [PubMed] [Google Scholar]
- 22. Wright GW, Simon RM. A random variance model for detection of differential gene expression in small microarray experiments. Bioinformatics. 2003;19:2448–2455. [DOI] [PubMed] [Google Scholar]
- 23. Ponicsan SL, Kugel JF, Goodrich JA. Genomic gems: SINE RNAs regulate mRNA production. Curr Opin Genet Dev. 2010;20:149–155. [DOI] [PMC free article] [PubMed] [Google Scholar]
- 24. Jendrzejewski J, He H, Radomska HS, et al. The polymorphism rs944289 predisposes to papillary thyroid carcinoma through a large intergenic noncoding RNA gene of tumor suppressor type. Proc Natl Acad Sci USA. 2012;109:8646–8651. [DOI] [PMC free article] [PubMed] [Google Scholar]
- 25. Washietl S, Kellis M, Garber M. Evolutionary dynamics and tissue specificity of human long noncoding RNAs in six mammals. Genome Res. 2014;24:616–628. [DOI] [PMC free article] [PubMed] [Google Scholar]
- 26. Derrien T, Johnson R, Bussotti G, et al. The GENCODE v7 catalog of human long noncoding RNAs: analysis of their gene structure, evolution, and expression. Genome Res. 2012;22:1775–1789. [DOI] [PMC free article] [PubMed] [Google Scholar]
- 27. Zhang X, Rice K, Wang Y, et al. Maternally expressed gene 3 (MEG3) noncoding ribonucleic acid: isoform structure, expression, and functions. Endocrinology. 2010;151:939–947. [DOI] [PMC free article] [PubMed] [Google Scholar]
- 28. Johnsson P, Ackley A, Vidarsdottir L, et al. A pseudogene long-noncoding-RNA network regulates PTEN transcription and translation in human cells. Nat Struct Mol Biol. 2013;20:440–446. [DOI] [PMC free article] [PubMed] [Google Scholar]
- 29. Cabili MN, Trapnell C, Goff L, et al. Integrative annotation of human large intergenic noncoding RNAs reveals global properties and specific subclasses. Genes Dev. 2011;25:1915–1927. [DOI] [PMC free article] [PubMed] [Google Scholar]
- 30. Krishnan J, Mishra RK. Emerging trends of long non-coding RNAs in gene activation. FEBS J. 2014;281:34–45. [DOI] [PubMed] [Google Scholar]
- 31. Wilusz JE, Sunwoo H, Spector DL. Long noncoding RNAs: functional surprises from the RNA world. Genes Dev. 2009;23:1494–1504. [DOI] [PMC free article] [PubMed] [Google Scholar]
- 32. Comuzzie AG, Cole SA, Laston SL, et al. Novel genetic loci identified for the pathophysiology of childhood obesity in the Hispanic population. PLoS One. 2012;7:e51954. [DOI] [PMC free article] [PubMed] [Google Scholar]
- 33. Porcu E, Medici M, Pistis G, et al. A meta-analysis of thyroid-related traits reveals novel loci and gender-specific differences in the regulation of thyroid function. PLoS Genet. 2013;9:e1003266. [DOI] [PMC free article] [PubMed] [Google Scholar]
- 34. Alul FY, Shchelochkov OA, Berberich SL, Murray JC, Ryckman KK. Genetic associations with neonatal thyroid-stimulating hormone levels. Pediatr Res. 2013;73:484–491. [DOI] [PMC free article] [PubMed] [Google Scholar]
- 35. Parlato R, Rosica A, Rodriguez-Mallon A, et al. An integrated regulatory network controlling survival and migration in thyroid organogenesis. Dev Biol. 2004;276:464–475. [DOI] [PubMed] [Google Scholar]
- 36. Fernández LP, López-Márquez A, Martínez ÁM, Gómez-López G, Santisteban P. New insights into FOXE1 functions: identification of direct FOXE1 targets in thyroid cells. PLoS One. 2013;8:e62849. [DOI] [PMC free article] [PubMed] [Google Scholar]
- 37. Ortiz L, Zannini M, Di Lauro R, Santisteban P. Transcriptional control of the forkhead thyroid transcription factor TTF-2 by thyrotropin, insulin, and insulin-like growth factor I. J Biol Chem. 1997;272:23334–23339. [DOI] [PubMed] [Google Scholar]
- 38. Bullock M, Duncan EL, O'Neill C, et al. Association of FOXE1 polyalanine repeat region with papillary thyroid cancer. J Clin Endocrinol Metab. 2012;97:E1814–E1819. [DOI] [PubMed] [Google Scholar]
- 39. Landa I, Ruiz-Llorente S, Montero-Conde C, et al. The variant rs1867277 in FOXE1 gene confers thyroid cancer susceptibility through the recruitment of USF1/USF2 transcription factors. PLoS Genet. 2009;5:e1000637. [DOI] [PMC free article] [PubMed] [Google Scholar]