

Abstract
Tafenoquine is being developed for relapse prevention in Plasmodium vivax malaria. This Phase I, single-blind, randomized, placebo- and active-controlled parallel group study investigated whether tafenoquine at supratherapeutic and therapeutic concentrations prolonged cardiac repolarization in healthy volunteers. Subjects aged 18–65 years were randomized to one of five treatment groups (n = 52 per group) to receive placebo, tafenoquine 300, 600, or 1200 mg, or moxifloxacin 400 mg (positive control). Lack of effect was demonstrated if the upper 90% CI of the change from baseline in QTcF following supratherapeutic tafenoquine 1200 mg versus placebo (ΔΔQTcF) was <10 milliseconds for all pre-defined time points. The maximum ΔΔQTcF with tafenoquine 1200 mg (n = 50) was 6.39 milliseconds (90% CI 2.85, 9.94) at 72 hours post-final dose; that is, lack of effect for prolongation of cardiac depolarization was demonstrated. Tafenoquine 300 mg (n = 48) or 600 mg (n = 52) had no effect on ΔΔQTcF. Pharmacokinetic/pharmacodynamic modeling of the tafenoquine–QTcF concentration–effect relationship demonstrated a shallow slope (0.5 ms/μg mL–1) over a wide concentration range. For moxifloxacin (n = 51), maximum ΔΔQTcF was 8.52 milliseconds (90% CI 5.00, 12.04), demonstrating assay sensitivity. In this thorough QT/QTc study, tafenoquine did not have a clinically meaningful effect on cardiac repolarization.
Keywords: QT, tafenoquine, moxifloxacin, cardiology, anti-malarial
Plasmodium vivax malaria has been a neglected disease until recently, overshadowed by the infant mortality associated with P. falciparum.1,2 However, P. vivax also causes severe disease and death,2 and the large burden of illness from this infection is now being appreciated.3,4 Unlike P. falciparum, P. vivax is associated with multiple relapses caused by the reactivation of persistent dormant parasites in the liver (hypnozoites), even if the initial blood stage infection is treated successfully.5,6
Primaquine, co-administered with a blood schizonticide (usually chloroquine), is the only treatment currently available for the radical cure of P. vivax infection. However, current dosing recommendations require 14 days of primaquine treatment and patients must be compliant with the dosing regimen in order for therapy to be effective.7–9
Tafenoquine is an 8-aminoquinoline primaquine analogue with activity against both blood and liver stages of Plasmodium spp.10–13 Tafenoquine has a long half-life (2–3 weeks),14,15 and is being developed as a single-dose therapy for the radical cure of P. vivax malaria when co-administered with standard 3-day chloroquine.16,17 Recent clinical studies indicate 300 mg as the optimal clinical dose.18,19
QT interval prolongation is associated with quinoline anti-malarial agents, though there is wide diversity within the class.20 Only halofantrine and quinidine are known to have clinically significant effects on ventricular repolarization at therapeutic doses in malaria patients.20–22 However, QT prolongation and torsades de pointes have been described after long-term use of chloroquine at supratherapeutic doses for mixed connective tissue disease,23 and in the chronic treatment of rheumatoid arthritis and systemic lupus erythematosus.24
In studies of tafenoquine for the prevention of relapse in patients with P. vivax malaria, there has been no clinical evidence of any significant cardiac adverse effects for total doses up to 2100 mg over 7 days, 1800 mg over 3 days, or 600 mg as a single dose.19,25 In a drug interaction study performed in healthy subjects receiving tafenoquine (900 mg over 2 days) co-administered with chloroquine, there was no apparent trend for an additional effect on QT interval compared with chloroquine administered alone.26 Nevertheless, because of the class effect of quinolone anti-malarials on QT prolongation, a thorough QT study was conducted in accordance with International Conference for Harmonization (ICH) E14 guidance.27 In this study, the effect of supratherapeutic (1200 mg) and therapeutic doses (300 and 600 mg) of tafenoquine on QT corrected for heart rate using Fridericia's correction (QTcF) in healthy volunteers was evaluated.
Methods
Study Objectives
The primary objective of the study was to demonstrate a lack of effect of supratherapeutic tafenoquine (1200 mg) on QTcF as determined by the baseline-adjusted, maximum time-matched QTcF effect as compared to placebo (ΔΔQTcF). Demonstrating a lack of effect of tafenoquine therapeutic doses (300 and 600 mg) on ΔΔQTcF was a secondary objective. Further secondary objectives included describing tafenoquine pharmacokinetics and characterizing the pharmacokinetic/pharmacodynamic (PK/PD) relationship between tafenoquine concentrations and any change in QTcF.
Study Design
This was a Phase I, single-blind, randomized, placebo- and active-controlled parallel group study following accepted guidelines on the evaluation of pharmaceuticals for their potential to cause QT/QTc interval prolongation.27 The study was conducted between July 2011 and June 2012 at two centers in the USA (Parexel at Glendale, CA and Baltimore, MD) in accordance with the Declaration of Helsinki (Seoul 2008), Good Clinical Practice and applicable country-specific requirements. The study protocol and consent forms were approved by Aspire Institutional Review Board, CA, USA. Written informed consent was obtained from all subjects prior to participation in the study.
Subjects were randomized to one of five treatment groups to receive placebo, tafenoquine 300, 600, or 1200 mg, or moxifloxacin 400 mg (positive control). The long half-life of tafenoquine precluded a cross-over design and a parallel group design was used. Tafenoquine (GlaxoSmithKline) was provided as 100 mg capsules. A supratherapeutic tafenoquine dose of 1200 mg was chosen based on the known adverse event profile.16,17 Efficacy and safety data from the clinical trial program indicated tafenoquine 600 mg as the upper therapeutic dose and 300 mg as a lower therapeutic dose. Moxifloxacin hydrochloride (Avelox®, Bayer) 400 mg was used as a concurrent positive control to establish assay sensitivity.27 Tafenoquine 1200 mg was given over 3 days (400 mg/day on Days 1, 2, and 3) to minimize gastrointestinal disturbance. Tafenoquine, 300, 600 mg and moxifloxacin were given on Day 3. All active treatment doses were matched with placebo controls across all treatment groups to maintain blinding. Tafenoquine required administration with food to increase drug exposure and reduce gastrointestinal disturbance.14,15,28 Thus, moxifloxacin was also administered with food to maintain blinding, though labelling advice is to administer without food and so lower drug exposure was anticipated. Subjects were admitted to the clinical unit on the evening of Day –2 and remained in the unit until the morning of Day 6. Subjects returned for follow up at 5, 10, 24, and 60 days after the last dose of study medication.
Sample size
The hypothesis test for lack of QT effect controlled the overall Type I error rate at 5%. As per the ICH E14 guidelines,27 if the upper 90% CI for ΔΔQTcF was <10 milliseconds for all time points, a lack of effect of tafenoquine 1200 mg on QTcF was demonstrated. Assuming a true treatment difference of 2 milliseconds and between-subject standard deviation of 10 milliseconds, to rule out an effect size of ≥10 milliseconds, with overall 90% power at the one-sided 5% (or two-sided 10%) significance level, 42 evaluable subjects were required per group. Allowing for a 20% drop-out rate, target recruitment was 52 subjects per group.
Subjects
Eligible subjects were male or female healthy volunteers aged 18–65 years of age who had a normal medical history, physical examination, baseline electrocardiographs (ECGs) and laboratory tests, body weight ≥50 kg for men and ≥45 kg for women, body mass index within the range of 18.5–31.0 kg/m2 (inclusive), and the ability to provide written informed consent and comply with the study protocol. A negative pregnancy test was required for females of childbearing potential; pregnant or lactating females were excluded. Exclusion criteria included, but were not limited to: glucose-6-phosphate dehydrogenase (G6PD) deficiency determined by a quantitative assay of enzyme activity (<90% for females or <70% for males of study site median for G6PD enzyme activity); history of thalassemia or current or past history of methemoglobinemia. Use of prescription or non-prescription drugs was not allowed within 7 days of study start or within 14 days for potential enzyme-inducing agents.
Assessments
ECG data
Digital ECG data were obtained from 12-lead continuous Holter monitoring (Mortara H12+ at 1000 Hz; Milwaukee, WI, USA) starting on the morning of Day –1 until 72 hours post-final dose. Day –1 ECGs were time-matched and used as baseline to all ECGs post-first dose. Triplicate ECGs were acquired at the following time points: pre-dose on Days 1, 2, and 3, and post-final dose on Day 3 at 1, 2, 3, 4, 5, 6, 9, 12, 15, 20, 24, 36, 48, and 72 hours. Subjects remained in a supine or semi-supine position for at least 30 minutes prior to ECG acquisition and had not eaten within the preceding 2 hours whenever possible. All ECGs were read by an independent cardiologist blinded to treatment and the same cardiologist read all the ECGs from any given subject. Mean QT interval from three separate beats was calculated for each ECG. Analysis of lead II was conducted with V5 as a back-up, and V2 as an alternative when T waves were not well defined in leads II or V5. Other leads could have then been used if these primary leads provided unacceptable recordings. QT interval for an individual beat was calculated from the preceding RR interval.
Pharmacokinetics
Serial blood samples for pharmacokinetic assessment were collected to correspond with ECG assessment time points. Tafenoquine and moxifloxacin concentrations in human plasma samples were determined using validated assays. For tafenoquine, the lower limit of quantification (LLQ) was 2 ng mL–1 and the higher limit of quantification (HLQ) was 3000 ng mL−1. For moxifloxacin the LLQ was 25 ng mL−1 and the HLQ was 5000 ng mL−1. At all validation concentrations examined for both tafenoquine and moxifloxacin, the within- and between-run precision values were less than or equal to 15% (20% at the LLQ), and therefore acceptable. The maximum within- and between-run precision observed for tafenoquine was 8.2% and 4.1%, respectively, and for moxifloxacin, 4.6% and 3.7%, respectively. Pharmacokinetic analyses of plasma tafenoquine and moxifloxacin concentration–time data were conducted using non-compartmental Model 200 (for extravascular administration) of WinNonlin Professional Edition Version 5.2 (Pharsight Corporation, Mountain View, CA). Actual elapsed time from dosing was used to estimate all individual plasma pharmacokinetic parameters for evaluable subjects. The following pharmacokinetic parameters were determined: maximum observed plasma concentration (Cmax), time to Cmax (tmax), time of last quantifiable concentration (tlast), and area under the concentration–time curve (AUC(0–t)) for both tafenoquine and moxifloxacin, and AUC(0–∞) and terminal phase half-life (t1/2) for moxifloxacin only. Based on the long terminal half-life of tafenoquine (2–3 weeks) and the short sampling collection time up to 72 hours post-dose, AUC(0–∞) for tafenoquine was not determined in this study.
Safety
Safety was evaluated by physical examination, vital signs, clinical laboratory tests (hematology, biochemistry, and urinalysis) and adverse event monitoring. In addition, resting single 12-lead ECGs (safety ECGs) were performed at screening, and Days –2, 1, 2, 3, 4, 5, 6, 27, and 63.
Statistical Analysis
The primary endpoint was the change from baseline in the QT interval corrected for heart rate by Fridericia's formula (QTcF = QT/RR1/3) following administration of tafenoquine 1200 mg at the pre-defined matched sample times as compared to placebo (ΔΔQTcF). The least square means (LM) ΔΔQTcF and corresponding 90% confidence intervals (CI) were constructed for each time point. A repeated measures analysis of covariance (ANCOVA) model was fitted for the change from time-matched baseline QTcF using subject as a random effect, and time, treatment, center, sex, and time by treatment interaction as fixed effects. Time-matched baseline QTcF was included as a time-dependent covariate. All final statistical models were fitted using a spatial power covariance structure to account for the within-subject correlation between QTcF measurements over the 14 time points post-final dose. The covariance structure was chosen after fitting various structures, such as unstructured, compound symmetry, heterogeneous compound symmetry, and ante-dependence and was based on the smallest Akaike information criterion (AIC). All statistical analyses were conducted using SAS Version 9.1 or higher (SAS Institute, Inc., Cary, NY, USA).
Similar analyses as described above were performed for ΔΔQTcF for tafenoquine 300 mg, tafenoquine 600 mg or moxifloxacin as secondary endpoints. Moxifloxacin was used as a positive control to determine assay sensitivity. Assay sensitivity was demonstrated if the lower bound of the 2-sided 90% CI for the time-matched ΔΔQTcF for moxifloxacin was ≥5 milliseconds for at least one time point. Categorical analysis was conducted to summarize the number of subjects with a maximum change in QTcF from baseline of >30–60 milliseconds or >60 milliseconds based on the mean value from replicate Holter ECGs at each post-dose time point. Other secondary endpoints were QT interval and heart rate as compared to placebo evaluated for each tafenoquine dose or moxifloxacin.
The adequacy of using QTcF for the primary outcome was evaluated based on pre-dose data using scatter plots of QTcF versus RR and the associated correlation coefficient. This was compared with similar analyses for QT interval corrected with Bazett's formula (QTcB = QT/RR1/2), or the individual-based corrected QT interval which was derived from QTcI = QT + β (1 − RR) where the slopes β were estimated by fitting linear regression models QT = α + β*RR for each individual (β is the estimate of the average correction factor obtained from the baseline time point values at pre-dose on Day 1 of QT and RR for each subject before the start of treatment). If QTcF was not deemed to be adequate, the primary objective was to be evaluated using QTcI with QTcF analyzed as a secondary objective.
Pharmacokinetic/Pharmacodynamic Model
Initial exploratory graphical assessments of QTcF interval versus time were undertaken for Day 3 from all five cohorts to examine the circadian rhythmicity in the QTcF interval. Additionally, plots of individual QTcF interval versus tafenoquine or moxifloxacin concentrations in ascending order of time were generated to examine direct versus delayed effect (hysteresis) relationships for inclusion in the PK/PD analysis. A population analysis approach was used to establish the PK/PD relationship between tafenoquine and moxifloxacin concentrations versus the QTcF interval using the nonlinear mixed effects modeling technique (NONMEM v7.0, double precision, Version 7, ICON Development Solutions, Ellicott City, MD, USA). The model included data for those subjects who provided evaluable tafenoquine and moxifloxacin concentrations and corresponding ECG measures at the same time point and baseline.
The basic effect model for QTcF interval was:
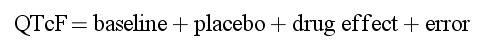 |
where baseline is the off-treatment or drug-free average QTcF interval, placebo is the change from baseline attributable to any placebo effect including circadian rhythmicity, drug effect consists of terms to describe the relationship between drug concentrations and QTcF interval following tafenoquine or moxifloxacin treatment, and error is a normally distributed residual error. Construction of the PK/PD model proceeded in a step wise fashion and the structures of the model components were determined in the following order: (1) baseline and its covariates, (2) placebo effect, and (3) net drug effects of tafenoquine and moxifloxacin. Further details of the model are in Supplementary Appendix S1.
Results
Subjects
A total of 260 subjects were randomized, 52 to each treatment group. Demographic characteristics were similar between the treatment groups (Table1). Subject disposition is shown in Table1. Nine subjects withdrew from the study; the majority were lost to follow-up or withdrew consent and one (tafenoquine 1200 mg group) withdrew because of an adverse event of mild nausea and vomiting on Day 1 after receiving 400 mg of tafenoquine.
Table I.
Subject Disposition and Demographic Characteristics
| Placebo | TQ 300 mg | TQ 600 mg | TQ 1200 mg | Moxifloxacin | |
|---|---|---|---|---|---|
| Randomized | 52 | 52 | 52 | 52 | 52 |
| Completed study | 50 | 48 | 52 | 50 | 51 |
| Withdrawn | 2 | 4 | 0 | 2 | 1 |
| Safety population | 52 | 52 | 52 | 52 | 52 |
| ECG evaluable | 50 | 48 | 52 | 50 | 51 |
| PK evaluable | 0 | 51 | 52 | 51 | 52 |
| PK/PD evaluable | 52 | 51 | 52 | 51 | 52 |
| Sex, male | 32 | 38 | 36 | 36 | 39 |
| Ethnicity | |||||
| Caucasian | 29 | 28 | 26 | 31 | 28 |
| African/African American | 19 | 21 | 23 | 21 | 19 |
| Othera | 4 | 3 | 3 | 0 | 5 |
| Mean age (year) (SD) | 34.4 (10.6) | 35.0 (10.9) | 38.7 (11.8) | 36.0 (10.1) | 34.4 (9.8) |
All values are number in each category except for age. TQ, tafenoquine.
American Indian/Alaskan Native (3), Asian (6), Native Hawaiian or other pacific islander (2), African-American and White (3), or Asian and White (1).
Effect of Tafenoquine on ΔΔQTcF
Supratherapeutic tafenoquine (1200 mg) showed a maximum effect on ΔΔQTcF of 6.39 milliseconds (90% CI 2.86, 9.92) at 36 hours post-final dose and 6.39 milliseconds (90% CI 2.85, 9.94) at 72 hours post-final dose (Figure 1, Supplementary Table S1). The effect on ΔΔQTcF became noticeable at around 12 hours post-dose and peaked between 36 and 72 hours. However, a lack of effect of tafenoquine on QTc interval was demonstrated as the upper 90% CI for ΔΔQTcF was just within the threshold of regulatory concern of <10 milliseconds.27
Figure 1.

Primary outcome: Least squares (LS) mean of treatment differences from placebo for QTcF change from baseline (ΔΔQTcF) and 90% confidence intervals show lack of effect for tafenoquine: upper 90% CI <10 milliseconds at all time points. Assay sensitivity was confirmed with the positive moxifloxacin control: lower 95% CI ≥5 milliseconds for at least one time point (5.0 milliseconds at 4 hours).
For tafenoquine 300 and 600 mg compared to placebo, the upper bounds of the 90% CIs for ΔΔQTcF were <10 milliseconds at all time points (Figure 1, Supplementary Table S1). Therefore, a lack of effect on QTcF interval prolongation was demonstrated for the clinical doses of tafenoquine. Assay sensitivity to detect a QT effect was demonstrated as the lower bound of the 90% CI for the difference in mean change from time-matched baseline QTcF for moxifloxacin compared to placebo was 5.0 milliseconds at 4 hours post-dose (Figure 1, Supplementary Table S1).
Categorical analyses of ECG data showed that no subject in any tafenoquine group had an increase in QTcF interval >30 milliseconds. In the moxifloxacin group, an increase in QTcF interval of >30 to <60 milliseconds was noted in one subject at 12 hours and one at 36 hours post-dose.
Assessment of QTcF as correction method
The use of QT correction method was explored by comparing baseline QTcF, QTcB, and QTcI to baseline RR (Supplementary Figure S1). The plot of QTcF versus RR showed a random scatter of data points and virtually flat trend lines. Hence, QTcF was considered to be the best correction across the range of heart rates. QTcI was determined from individual correction factors obtained from fitting linear models to their baseline QT and RR data (Supplementary Figure S1). Additional plots that combined all treatment groups and included the post-baseline data for comparisons between QTcF, QTcB, QTcI, and RR confirmed that QTcF was the appropriate correction to use for this study (data not shown).
Effect of Tafenoquine on Uncorrected QT and Heart Rate
The upper limits of the 90% CIs for mean change from time-matched baseline in uncorrected QT for all tafenoquine dose levels were <10 milliseconds at all time points (data not shown).
There was no evidence of a dose-related effect of tafenoquine on heart rate compared to placebo (Supplementary Table S2). The largest effect of tafenoquine 1200 mg compared to placebo was observed at 6 hours post-final dose (mean 3.06 bpm 90% CI 0.53, 5.59). The largest treatment difference was observed with tafenoquine 300 mg compared to placebo at 72 hours post-dose (mean 5.98 bpm 90% CI 3.43, 8.54).
Pharmacokinetics
Tafenoquine and moxifloxacin pharmacokinetic parameters are summarized in Table2. Tafenoquine was slowly absorbed with median tmax values of 15.0 hours for the 300 mg dose and 12.0 hours for the 600 and 1200 mg doses. AUC and Cmax exhibited moderate inter-subject variability. AUC and Cmax values increased with increasing tafenoquine dose in a dose-proportional manner. Following administration of 400 mg moxifloxacin in the fed state, moxifloxacin was readily absorbed with a median tmax value of 3 hours. Geometric mean Cmax and AUC(0–∞) values were 1544 ng/mL and 23778 ng mL−1 h, respectively, and exhibited moderate inter-subject variability. Administration of moxifloxacin with food decreased both the rate and extent of absorption as evidenced by the lower Cmax and AUC values for moxifloxacin in comparison to literature values for moxifloxacin obtained in the fasted state.29
Table 2.
Summary of Tafenoquine and Moxifloxacin Plasma Pharmacokinetic Parameters
| AUC(0–t) | AUC(0–∞) | Cmax | tlast | tmax | t1/2 | ||
|---|---|---|---|---|---|---|---|
| Group | N | (ng mL–1 h) | (ng mL–1 h) | (ng/mL) | (h) | (h) | (h) |
| TQ 300 mg | 51 | 10611 (29.7) | N/C | 186 (31.3) | 72.0 (71.9–73.0) | 15.0 (9.0–48.2) | N/C |
| TQ 600 mg | 52 | 22986 (29.6) | N/C | 422 (32.4) | 72.0 (72.0–73.0) | 12.0 (5.0–36.4) | N/C |
| TQ 1200 mg | 51 | 41896 (26.0) | N/C | 724 (24.7) | 72.0 (72.0–73.0) | 12.0 (3.0–48.1) | N/C |
| Moxifloxacin 400 mg | 52 | 22554 (23.3) | 23778 (23.1) | 1554 (27.8) | 72.0 (48.0–72.0) | 3.0 (1.0–6.3) | 16.1 (10.0–22.8) |
AUC(0–t), AUC(0–∞), and Cmax are the geometric mean (% CVb). tlast, tmax, and t1/2 are the median (range). AUC, area under the concentration–time curve; CVb, between-subject coefficient of variance; Cmax, maximum observed concentration; N/C, not calculated; tlast, time of last quantifiable concentration; t1/2, terminal phase half life; tmax, time of maximum plasma concentration; TQ, tafenoquine.
Pharmacokinetic/Pharmacodynamic Model
The final PK/PD model describing the relationship between drug plasma concentrations and QTcF interval included the covariates sex and race (two groups, black and all others) describing the baseline and placebo data, two cosine functions (an 8-hour cycle and a 24-hour cycle) and two slope terms, one for the tafenoquine concentrations versus QTcF interval and the second for the moxifloxacin concentrations versus QTcF interval (Table3). The slope describing the PK/PD relationship between the QTcF interval versus the change in tafenoquine concentrations over time was shallow (0.5 ms/μg mL–1) demonstrating that there was no discernable relationship between tafenoquine plasma concentrations and changes in QTcF interval. The bootstrap analysis using resampling with replacement resulted in similar parameter estimates as those obtained with the final NONMEM model. These results show that the final NONMEM model provides a reliable and robust description of the data with good precision (Table3). Additionally, visual predictive check assessments from 200 simulations showed that most of the observed data were within the 5th to 95th percentiles of the simulated individual values (Figure 2). Hence, the final model adequately described the PK/PD relationship between QTcF interval and tafenoquine or moxifloxacin concentrations.
Table 3.
Population Pharmacokinetic/Pharmacodynamic Parameters for the Final Model of the Effect of Tafenoquine or Moxifloxacin Plasma Concentrations on the Baseline Adjusted QTcF Interval Corrected for Placebo and Evaluation of Parameter Stability Using Bootstrap Analysis
| Parameter | Model | Bootstrap analysis | ||
|---|---|---|---|---|
| Mean | %CV | Mean | 95% CI | |
| Fixed effects | ||||
| Baseline male white+ (ms) | 399 | 0.3 | 399 | 397, 401 |
| Baseline female white+ (ms) | 410 | 17.8 | 409 | 404, 415 |
| Baseline male black race (ms) | 391 | 22.0 | 391 | 388, 396 |
| Baseline female black race (ms) | 401 | 22.0 | 401 | 398, 406 |
| Amplitude 8 h (ms) | 4.2 | 3.5 | 4.2 | 3.9, 4.4 |
| tmax 8 h (h) | –10.1 | 0.4 | –10.1 | –10.2, –10.1 |
| Amplitude 24 h (ms) | 4.0 | 4.1 | 4.0 | 3.7, 4.3 |
| tmax 24 h (h) | –4.5 | 3.2 | –4.4 | –4.2, –4.7 |
| Tafenoquine slope (ms/μg mL–1) | 0.5 | 175 | 0.5 | –1.0, 2.3 |
| Moxifloxacin slope (ms/μg mL–1) | 3.1 | 17.0 | 3.1 | 2.3, 4.0 |
| Inter-individual variability | ||||
| %CV (baseline) | 13.9 | 8.0 | 13.8 | 12.9, 14.7 |
| %CV (amplitude 24 h) | 1.6 | 26.0 | 1.6 | 1.2, 1.9 |
| %CV (tmax 24 h) | 1.2 | 25.3 | 1.2 | 1.0, 1.5 |
| %CV (amplitude 8 h) | 0.9 | 53.5 | 0.9 | 0.3, 1.3 |
| %CV (tmax 8 h) | 0.4 | 24.4 | 1.0 | 0.3, 0.5 |
| %CV (moxifloxacin slope) | 3.0 | 30.2 | 2.9 | 2.2, 3.7 |
| Random residual variability (ms) | 5.7 | 2.8 | 5.7 | 5.6, 5.8 |
CI, confidence interval; CV, coefficient of variance; tmax, time of maximum plasma concentration; white+, white plus all other ethnicities except black.
Figure 2.
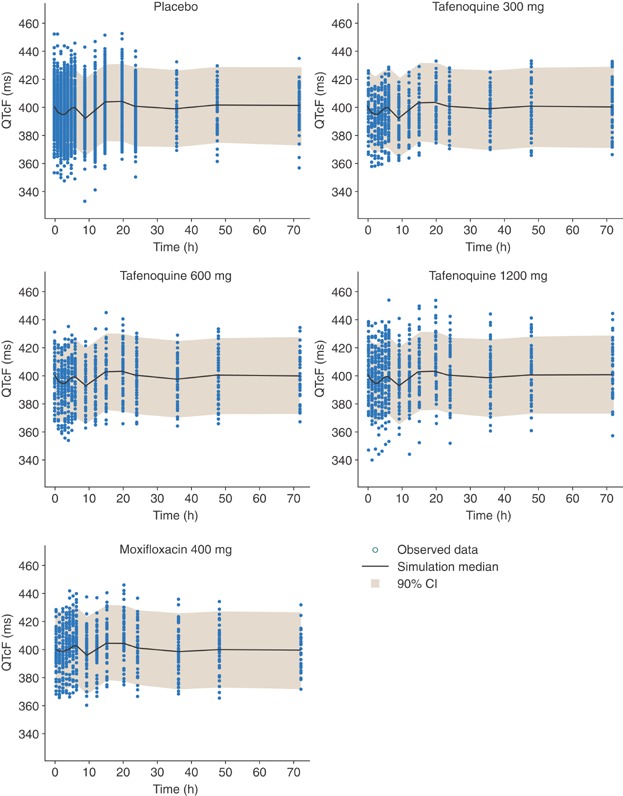
Visual predictive check for QTcF interval (milliseconds) versus time profiles following administration of placebo, 300, 600, and 1200 mg tafenoquine, and 400 mg moxifloxacin. The shaded area indicates the 90% prediction intervals of the simulated QTcF values.
Pharmacokinetic/Pharmacodynamic Assessment of Moxifloxacin as Positive Control
The slope describing the relationship between QTcF interval versus moxifloxacin concentrations was 3.1 ms/μg mL–1, consistent with that observed in other thorough QT studies and confirming an exposure–response effect of moxifloxacin on QTcF.29–31 As moxifloxacin exposure was considerably lower in this study than reported in the literature,30 PK/PD modeling was conducted to assess the predicted effect of higher moxifloxacin concentrations on ΔΔQTcF. One thousand datasets were simulated based on doubling the individual concentrations at each time point in the original dataset so as to be similar to those in the typical range observed in other studies reported in the literature.29 The design of these simulated datasets was the same as the study reported here. Estimates of ΔΔQTcF were generated for seven selected time points between 0 and 6 hours post-final dose (Table4). The simulated data resulted in a lower bound of the 90% CI of ≥5.0 milliseconds at two concentrations; 2730 ng mL–1 at 3 hours and 2530 ng mL–1 at 4 hours.
Table 4.
Median Predicted ΔΔQTcF Interval at Selected Time Points After Doubling the Individual Moxifloxacin Concentrations at Each Time Point in the Original Dataset (N = 1000 Simulated Studies)
| Time (hours) | Median moxifloxacin concentration (ng mL–1) | Lower bound 90% CI | Median ΔΔQTcF (milliseconds) | Upper bound 90% CI |
|---|---|---|---|---|
| 0 | 0 | –1.7 | –0.02 | 1.7 |
| 1 | 1072 | 1.2 | 3.4 | 6.1 |
| 2 | 2430 | 4.4 | 7.1 | 9.7 |
| 3 | 2730 | 5.5 | 8.2 | 11.1 |
| 4 | 2560 | 5.3 | 7.9 | 10.6 |
| 5 | 2340 | 4.7 | 7.3 | 9.7 |
| 6 | 2240 | 4.2 | 6.7 | 9.2 |
Safety
All subjects who received at least one dose of study medication were included in the safety analysis. No clinically significant abnormalities were reported from 12-lead safety paper ECGs (Supplementary Table S3). No subject had a maximum QTcF value >480 milliseconds. Although Holter monitoring did not reveal any increases in QTcF >30 milliseconds in the TQ group, safety (paper) ECGs showed maximum increases >30 milliseconds in 16 subjects receiving TQ, the majority of which (11 subjects) had a maximum increase of <40 milliseconds; the highest maximum change was 51 milliseconds in a subject receiving 300 mg TQ recorded at the final follow-up visit. Thus, no subject receiving tafenoquine had a change in QTcF from baseline >60 milliseconds. One subject receiving moxifloxacin had a maximum change in QTcF from baseline of 63 milliseconds on Day 6.
The overall frequency of adverse events per treatment group was 67.3% (35/52) with placebo, 71.2% (37/52) with tafenoquine 300 mg, 75.0% (39/52) with tafenoquine 600 mg, 75.0% (39/52) with tafenoquine 1200 mg, and 44.2% (23/52) with moxifloxacin (Supplementary Table S4). Serious adverse events occurred in six subjects: Three cases of increased blood creatine phosphokinase, one in the placebo group, and two in the tafenoquine 600 mg group; one case each of decreased hemoglobin and hypersensitivity in the tafenoquine 600 mg group; and one case of urticaria in the tafenoquine 300 mg group. Only the cases of urticaria and hypersensitivity were considered by the investigator to be possibly related to study drug.
Overall, there were no clear trends for changes in hemoglobin in the tafenoquine-treated groups. However, there was a mild decrease in hemoglobin in male subjects receiving tafenoquine, with a hemoglobin nadir in the tafenoquine 1200 mg group at Day 27 with a mean change of –0.9 g dL–1 versus baseline (range –2.4, 1.0 g dL–1), compared with −0.5 g dL–1 (range –1.7, 0.9 g dL–1) in the 600 mg group and –0.3 g dL–1 (range –2.0, 1.2 g dL–1) in the 300 mg group. The maximum decrease from baseline in hemoglobin in any male receiving tafenoquine was −2.7 g dL–1 in the 600 mg group on Day 8. In females, there was no clear pattern of changes in hemoglobin versus baseline, though few females were recruited. Dose-related trends for increases in reticulocytes were noted across all tafenoquine dose groups.
Despite the exclusion of females with <90% G6PD enzyme activity, two subjects heterozygous for known G6PD-deficient genotypes were recruited. On further investigation, one subject (Vanua Lava variant) had a G6PD screening assay of 8.8 IU gHb–1 (81% of site median, ie, a protocol violation) and a maximum decrease in hemoglobin of −2.1 g dL–1 on Day 6. The second subject (G6PD A–) had a screening G6PD assay of 11.0 IU gHb–1 (102% of site median) and a maximum decrease in hemoglobin of −1.9 g dL–1 on Day 8. Both subjects demonstrated reticulocytosis but recovered without any clinical symptoms or sequelae.
Methemoglobin was elevated with tafenoquine in a dose-related manner. For tafenoquine 1200 mg, the mean maximum increase in methemoglobin from baseline was 4.1% (±2.6) at Day 13 and the maximum individual methemoglobin value occurred with this dose; 12.2% on Day 13. Mild methemoglobin elevations occurred at therapeutic tafenoquine concentrations; mean maximum change versus baseline was 1.1% (±1.2) at Day 13 in the 600 mg group and 0.2% (±0.5) at final follow up in the 300 mg group. Methemoglobin levels returned to normal by the final follow-up visit and there were no signs or symptoms of methemoglobinemia.
Overall, there were no clear trends in measurements of liver enzymes. Two subjects receiving tafenoquine 1200 mg had alanine aminotransferase (ALT) increases of 3.3× and 4.2× ULN, though one had possible concurrent Epstein–Barr virus infection. Two subjects in the tafenoquine 600 mg group, had ALT increases of 3.2× and 5.2× ULN, though in the former the increase was associated with strenuous exercise and this subject's aspartate aminotransferase (AST) was also elevated (6.7× ULN). One other subject in the tafenoquine 600 mg group had an increased AST of 7.2× ULN and one subject in the placebo group had an AST value >15× ULN. For bilirubin, overall increases in total, indirect and direct bilirubin were observed in all tafenoquine dose groups when compared with placebo and these appeared to be dose related. However, no subject had an increase in total bilirubin that was >2× ULN.
Dose-related transient increases in serum creatinine were observed across the tafenoquine dose groups compared to placebo (mean increase ∼12 µmol l–1 from baseline in the tafenoquine 600 and 1200 mg groups). There were no other notable changes in laboratory values and no clinically significant abnormalities reported for vital signs.
Discussion
This thorough QT study in healthy volunteers found no effect of clinical doses of tafenoquine (300 and 600 mg) on QTcF prolongation compared to placebo. The supratherapeutic dose of tafenoquine 1200 mg compared to placebo showed a maximum QTcF prolongation that was just within the <10 milliseconds 90% CI threshold as recommended by the ICH E14 guidelines to demonstrate a lack of effect on QTcF interval.27 Furthermore, there was no clear concentration–response relationship as evidenced by a shallow slope (0.5 ms/µg mL–1) for the concentration–QTcF interval (PK/PD) relationship which was not significantly different from zero.
These results are consistent with a recent healthy volunteer drug interaction study of tafenoquine co-administered with chloroquine, which showed no additional effect of tafenoquine on QTcF interval compared with the mild prolongation of this parameter observed with chloroquine alone.26 As in the current study, no subject receiving tafenoquine plus chloroquine had a QTcF >480 milliseconds or a change from baseline ≥60 milliseconds.26
Tafenoquine pharmacokinetics observed in this study were consistent with previous reports in healthy volunteers and during prophylaxis.14,15,26 Exposure to tafenoquine increased in a dose-proportional manner and median tmax occurred at 12–15 hours (range 3–48 hours) after the final dose. Tafenoquine is the major circulating drug-related component and as the absorption and elimination processes are slow, there is a low risk of any significant changes in single-dose tafenoquine pharmacokinetics if co-administered with P450 inhibitors. The observed variability in the tmax values result from the slow absorption and elimination of tafenoquine and are consistent with previous observations.14,15,26 An initial examination of the pharmacokinetic data obtained in this study for tafenoquine using hysteresis plots suggested no consistent trends within and across individuals. Indirect modeling was attempted to establish a PK/PD relationship using the effect site concentrations. However, these runs did not converge successfully or resulted in termination errors. Thus, PK/PD modeling was progressed using direct effect models.
Moxifloxacin observed Cmax and AUC values were approximately 50% and 30% lower than those reported previously in studies where moxifloxacin was administered under both fed and fasted conditions.30 Recently, Taubel et al32 showed that moxifloxacin administration with food resulted in an alteration of moxifloxacin pharmacokinetics consistent with the effect on the QT interval. In the current study, moxifloxacin administration with food contributed to the relatively low exposures obtained compared with previous reports.30,32,33 Despite this, the criteria for assay sensitivity were just met at 4 hours post-dose with the lower end of the 90% CI being exactly 5 milliseconds. Additionally, PK/PD modeling demonstrated that the estimated slope for moxifloxacin was 3.1 ms/μg mL–1, consistent with other thorough QT studies where moxifloxacin was considered to have demonstrated assay sensitivity.29–31 Using a dataset in which all moxifloxacin concentrations were doubled, simulation of 1000 studies showed that moxifloxacin would have the expected effect on QTcF interval had the moxifloxacin concentrations been in the range of those observed in other thorough QT studies where moxifloxacin was used as the positive control. Thus, assay sensitivity was established in this study.
Safety observations were generally consistent with clinical reports of tafenoquine given to healthy volunteers,26,34 for the prevention of relapse of P. vivax malaria,16,17 or during malaria prophylaxis.35–38 Namely, mild and transient dose-related decreased hemoglobin, increased methemoglobin, and at tafenoquine doses ≥600 mg, increased liver enzymes and serum creatinine.16,17,26,34–38 However, there were two hypersensitivity-related adverse events (hypersensitivity and urticaria) which were considered new safety information on tafenoquine.
For radical cure of P. vivax malaria, further clinical studies are being conducted using single-dose 300 mg tafenoquine co-administered with 3-day chloroquine. Recent publication of efficacy data from a Phase IIb study showed that this regimen prevented P. vivax relapse in 89.2% (95% CI 77, 95) of patients; efficacy was better than that of chloroquine alone (treatment difference 51.7% [95% CI 35, 69], P < .0001).19 If the efficacy of tafenoquine plus chloroquine is confirmed in Phase III studies, and safety at least as good as primaquine can be demonstrated, the greatly simplified dosing regimen would be a significant advance in the prevention of relapse following P. vivax malaria.
Acknowledgments
The authors thank the study participants and the staff at Parexel. Also, we thank John Finkle for help with data interpretation and Lucio Luzzatto for comments on G6PD study entry criteria. Naomi Richardson of Magenta Communications Ltd received funding from GlaxoSmithKline to prepare a first draft of the paper from the approved study report and assisted with authors' editing of the manuscript.
Declaration of Conflicting Interests
JAG, AKP, BRP, EJH, AKM, NC, MJMcD, and KM are employees of, and hold stock in GlaxoSmithKline. AH is an employee of PAREXEL which was contracted by GlaxoSmithKline to perform the study. SD is an employee of Medicines for Malaria Venture.
Funding
This trial was supported by the Medicines for Malaria Venture and GlaxoSmithKline.
Supporting Information
Additional supporting information may be found in the online version of this article at the publisher's web-site.
Supporting Information Figure S1. Scatter plots and slope lines for QT correction methods QTcF, QTcB, and QTcI versus RR. Data for each treatment group are given, though these represent pre-dose values. QTcF was the most appropriate method of QT correction in this study.
Supporting Information Table S1. Primary Outcome: Least Squares (LS) Mean of Treatment Differences From Placebo for QTcF Change From Baseline (∆∆QTcF) and 90% Confidence Intervals.
Supporting Information Table S2. Secondary Outcome: Least squares (LS) Mean of Treatment Differences From Placebo for Heart Rate (HR) Change From Baseline (∆∆HR) and 90% Confidence Intervals.
Supporting Information Table S3. Safety ECG Analysis: Maximum Post-Dose QTcF Interval and Maximum Change in QTcF Versus Baseline.
Supporting Information Table S4. Summary of All Adverse Events Occurring in Two or More Subjects in Any Treatment Group by System Organ Class (Safety Population).
References
- Mueller I, Galinski MR, Baird JK, et al. Key gaps in the knowledge of Plasmodium vivax, a neglected human malaria parasite. Lancet Infect Dis. 2009;9(9):555–566. doi: 10.1016/S1473-3099(09)70177-X. [DOI] [PubMed] [Google Scholar]
- Price RN, Tjitra E, Guerra CA, Yeung S, White NJ, Anstey NM. Vivax malaria: neglected and not benign. Am J Trop Med Hyg. 2007;77(6 Suppl):79–87. [PMC free article] [PubMed] [Google Scholar]
- Battle KE, Gething PW, Elyazar IR, et al. The global public health significance of Plasmodium vivax. Adv Parasitol. 2012;80:1–111. doi: 10.1016/B978-0-12-397900-1.00001-3. [DOI] [PubMed] [Google Scholar]
- Gething PW, Elyazar IR, Moyes CL, et al. A long neglected world malaria map: Plasmodium vivax endemicity in 2010. PLoS Negl Trop Dis. 2012;6(9):e1814. doi: 10.1371/journal.pntd.0001814. [DOI] [PMC free article] [PubMed] [Google Scholar]
- White NJ. Determinants of relapse periodicity in Plasmodium vivax malaria. Malar J. 2011;10:297. doi: 10.1186/1475-2875-10-297. [DOI] [PMC free article] [PubMed] [Google Scholar]
- White NJ, Imwong M. Relapse. Adv Parasitol. 2012;80:113–150. doi: 10.1016/B978-0-12-397900-1.00002-5. [DOI] [PubMed] [Google Scholar]
- World Health Organization 2013. World Health Organization, WHO Model Prescribing Information: Drugs Used in Parasitic Diseases—Second Edition. Available at: http://apps.who.int/medicinedocs/en/d/Jh2922e/ Accessed 2nd February.
- John GK, Douglas NM, von Seidlein L, et al. Primaquine radical cure of Plasmodium vivax: a critical review of the literature. Malar J. 2012;11:280. doi: 10.1186/1475-2875-11-280. [DOI] [PMC free article] [PubMed] [Google Scholar]
- Takeuchi R, Lawpoolsri S, Imwong M, et al. Directly-observed therapy (DOT) for the radical 14-day primaquine treatment of Plasmodium vivax malaria on the Thai-Myanmar border. Malar J. 2012;9:308. doi: 10.1186/1475-2875-9-308. [DOI] [PMC free article] [PubMed] [Google Scholar]
- Dow GS, Gettayacamin M, Hansukjariya P, et al. Radical curative efficacy of tafenoquine combination regimens in Plasmodium cynomolgi-infected Rhesus monkeys (Macaca mulatta. Malar J. 2011;10:212. doi: 10.1186/1475-2875-10-212. [DOI] [PMC free article] [PubMed] [Google Scholar]
- Pradines B, Mamfoumbi MM, Tall A, et al. In vitro activity of tafenoquine against the asexual blood stages of Plasmodium falciparum isolates from Gabon, Senegal, and Djibouti. Antimicrob Agents Chemother. 2006;50(9):3225–3226. doi: 10.1128/AAC.00777-06. [DOI] [PMC free article] [PubMed] [Google Scholar]
- Ramharter M, Noedl H, Thimasarn K, Wiedermann G, Wernsdorfer G, Wernsdorfer WH. In vitro activity of tafenoquine alone and in combination with artemisinin against Plasmodium falciparum. Am J Trop Med Hyg. 2002;67(1):39–43. doi: 10.4269/ajtmh.2002.67.39. [DOI] [PubMed] [Google Scholar]
- Coleman RE, Clavin AM, Milhous WK. Gametocytocidal and sporontocidal activity of antimalarials against Plasmodium berghei ANKA in ICR Mice and Anopheles stephensi mosquitoes. Am J Trop Med Hyg. 1992;46(2):169–182. doi: 10.4269/ajtmh.1992.46.169. [DOI] [PubMed] [Google Scholar]
- Charles BG, Miller AK, Nasveld PE, Reid MG, Harris IE, Edstein MD. Population pharmacokinetics of tafenoquine during malaria prophylaxis in healthy subjects. Antimicrob Agents Chemother. 2007;51(8):2709–2715. doi: 10.1128/AAC.01183-06. [DOI] [PMC free article] [PubMed] [Google Scholar]
- Edstein MD, Kocisko DA, Brewer TG, Walsh DS, Eamsila C, Charles BG. Population pharmacokinetics of the new antimalarial agent tafenoquine in Thai soldiers. Br J Clin Pharmacol. 2001;52(6):663–670. doi: 10.1046/j.1365-2125.2001.01482.x. [DOI] [PMC free article] [PubMed] [Google Scholar]
- Walsh DS, Looareesuwan S, Wilairatana P, et al. Randomized dose-ranging study of the safety and efficacy of WR 238605 (Tafenoquine) in the prevention of relapse of Plasmodium vivax malaria in Thailand. J Infect Dis. 1999;180(4):1282–1287. doi: 10.1086/315034. [DOI] [PubMed] [Google Scholar]
- Walsh DS, Wilairatana P, Tang DB, et al. Randomized trial of 3-dose regimens of tafenoquine (WR238605) versus low-dose primaquine for preventing Plasmodium vivax malaria relapse. Clin Infect Dis. 2004;39(8):1095–1103. doi: 10.1086/424508. [DOI] [PubMed] [Google Scholar]
- Green J, Harrell E, Narayan S, et al. A clinical summary of investigations to determine the haemolytic potential of tafenoquine in G6PD-deficient subjects. Presented at: 62nd Annual Meeting of the American Society of Tropical Medicine and Hygiene, 2013, Washington, DC.
- Llanos-Cuentas A, Lacerda MV, Rueangweerayut R, et al. Tafenoquine plus chloroquine for the treatment and relapse prevention of Plasmodium vivax malaria (DETECTIVE): a multicentre, double-blind, randomised, phase 2b dose-selection study. Lancet. 2013;383(9922):1049–1058. doi: 10.1016/S0140-6736(13)62568-4. [DOI] [PubMed] [Google Scholar]
- White NJ. Cardiotoxicity of antimalarial drugs. Lancet Infect Dis. 2007;7(8):549–558. doi: 10.1016/S1473-3099(07)70187-1. [DOI] [PubMed] [Google Scholar]
- Touze JE, Heno P, Fourcade L, et al. The effects of antimalarial drugs on ventricular repolarization. Am J Trop Med Hyg. 2002;67(1):54–60. doi: 10.4269/ajtmh.2002.67.54. [DOI] [PubMed] [Google Scholar]
- Roden DM, Woosley RL, Primm RK. Incidence and clinical features of the quinidine-associated long QT syndrome: implications for patient care. Am Heart J. 1986;111(6):1088–1093. doi: 10.1016/0002-8703(86)90010-4. [DOI] [PubMed] [Google Scholar]
- Vereckei A, Fazakas A, Balo T, Fekete B, Molnar MJ, Karadi I. Chloroquine cardiotoxicity mimicking connective tissue disease heart involvement. Immunopharmacol Immunotoxicol. 2013;35(2):304–306. doi: 10.3109/08923973.2013.766801. [DOI] [PubMed] [Google Scholar]
- Teixeira RA, Borba EF, Bonfa E, Martinelli Filho M. Arrhythmias in systemic lupus erythematosus. Rev Bras Reumatol. 2010;50(1):81–89. [PubMed] [Google Scholar]
- GlaxoSmithKline Clinical Investigator's Brochure for SB252263, version 8, November 2010. Document on file: GM2007/00152/04.
- Miller A, Harrell E, Ye L, et al. Pharmacokinetic interactions and safety evaluations of coadministered tafenoquine and chloroquine in healthy subjects. Br J Clin Pharmacol. 2013;76(6):858–867. doi: 10.1111/bcp.12160. [DOI] [PMC free article] [PubMed] [Google Scholar]
- International Conference on Harmonisation of Technical Requirements for Registration of Pharmaceuticals for Human Use. The Clinical Evaluation of QT/QTc Interval Prolongation and Proarrhythmic Potential for Nonantiarrhythmic Drugs. E14, Step 5. ICH Steering Committee. Available at: http://www.ich.org/fileadmin/Public_Web_Site/ICH_Products/Guidelines/Efficacy/E14/E14_Guideline.pdf Accessed 24th February, 2013.
- Brueckner RP, Lasseter KC, Lin ET, Schuster BG. First-time-in-humans safety and pharmacokinetics of WR 238605, a new antimalarial. Am J Trop Med Hyg. 1998;58(5):645–649. doi: 10.4269/ajtmh.1998.58.645. [DOI] [PubMed] [Google Scholar]
- del Corral A, Dutreix C, Huntsman-Labed A, et al. Midostaurin does not prolong cardiac repolarization defined in a thorough electrocardiogram trial in healthy volunteers. Cancer Chemother Pharmacol. 2012;69(5):1255–1263. doi: 10.1007/s00280-012-1825-y. [DOI] [PMC free article] [PubMed] [Google Scholar]
- Florian JA, Tornoe CW, Brundage R, Parekh A, Garnett CE. Population pharmacokinetic and concentration–QTc models for moxifloxacin: pooled analysis of 20 thorough QT studies. J Clin Pharmacol. 2011;51(8):1152–1162. doi: 10.1177/0091270010381498. [DOI] [PubMed] [Google Scholar]
- Tornoe CW, Garnett CE, Wang Y, Florian J, Li M, Gobburu JV. Creation of a knowledge management system for QT analyses. J Clin Pharmacol. 2011;51(7):1035–1042. doi: 10.1177/0091270010378408. [DOI] [PubMed] [Google Scholar]
- Taubel J, Ferber G, Lorch U, Batchvarov V, Savelieva I, Camm AJ. Thorough QT study of the effect of oral moxifloxacin on QTc interval in the fed and fasted state in healthy Japanese and Caucasian subjects. Br J Clin Pharmacol. 2014;77(1):170–179. doi: 10.1111/bcp.12168. [DOI] [PMC free article] [PubMed] [Google Scholar]
- Lettieri J, Vargas R, Agarwal V, Liu P. Effect of food on the pharmacokinetics of a single oral dose of moxifloxacin 400mg in healthy male volunteers. Clin Pharmacokinet. 2001;40(Suppl 1):19–25. doi: 10.2165/00003088-200140001-00003. [DOI] [PubMed] [Google Scholar]
- Leary KJ, Riel MA, Roy MJ, et al. A randomized, double-blind, safety and tolerability study to assess the ophthalmic and renal effects of tafenoquine 200mg weekly versus placebo for 6 months in healthy volunteers. Am J Trop Med Hyg. 2009;81(2):356–362. [PubMed] [Google Scholar]
- Lell B, Faucher JF, Missinou MA, et al. Malaria chemoprophylaxis with tafenoquine: a randomised study. Lancet. 2000;355(9220):2041–2045. doi: 10.1016/S0140-6736(00)02352-7. [DOI] [PubMed] [Google Scholar]
- Nasveld PE, Edstein MD, Reid M, et al. Randomized, double-blind study of the safety, tolerability, and efficacy of tafenoquine versus mefloquine for malaria prophylaxis in nonimmune subjects. Antimicrob Agents Chemother. 2010;54(2):792–798. doi: 10.1128/AAC.00354-09. [DOI] [PMC free article] [PubMed] [Google Scholar]
- Walsh DS, Eamsila C, Sasiprapha T, et al. Efficacy of monthly tafenoquine for prophylaxis of Plasmodium vivax and multidrug-resistant P. falciparum malaria. J Infect Dis. 2004;190(8):1456–1463. doi: 10.1086/424468. [DOI] [PubMed] [Google Scholar]
- Shanks GD, Oloo AJ, Aleman GM, et al. A new primaquine analogue, tafenoquine (WR 238605), for prophylaxis against Plasmodium falciparum malaria. Clin Infect Dis. 2001;33(12):1968–1974. doi: 10.1086/324081. [DOI] [PubMed] [Google Scholar]
Associated Data
This section collects any data citations, data availability statements, or supplementary materials included in this article.
Supplementary Materials
Supporting Information Figure S1. Scatter plots and slope lines for QT correction methods QTcF, QTcB, and QTcI versus RR. Data for each treatment group are given, though these represent pre-dose values. QTcF was the most appropriate method of QT correction in this study.
Supporting Information Table S1. Primary Outcome: Least Squares (LS) Mean of Treatment Differences From Placebo for QTcF Change From Baseline (∆∆QTcF) and 90% Confidence Intervals.
Supporting Information Table S2. Secondary Outcome: Least squares (LS) Mean of Treatment Differences From Placebo for Heart Rate (HR) Change From Baseline (∆∆HR) and 90% Confidence Intervals.
Supporting Information Table S3. Safety ECG Analysis: Maximum Post-Dose QTcF Interval and Maximum Change in QTcF Versus Baseline.
Supporting Information Table S4. Summary of All Adverse Events Occurring in Two or More Subjects in Any Treatment Group by System Organ Class (Safety Population).