

Abstract
Directed evolution is a technique that enables the identification of mutants of a particular protein that carry a desired property by successive rounds of random mutagenesis, screening, and selection. This technique has many applications, including the development of G protein-coupled receptor-based biosensors and designer drugs for personalized medicine. Although effective, directed evolution is not without challenges and can greatly benefit from the development of computational techniques to predict the functional outcome of single-point amino acid substitutions. In this article, we describe a molecular dynamics-based approach to predict the effects of single amino acid substitutions on agonist binding (salicin) to a human bitter taste receptor (hT2R16). An experimentally determined functional map of single-point amino acid substitutions was used to validate the whole-protein molecular dynamics-based predictive functions. Molecular docking was used to construct a wild-type agonist–receptor complex, providing a starting structure for single-point substitution simulations. The effects of each single amino acid substitution in the functional response of the receptor to its agonist were estimated using three binding energy schemes with increasing inclusion of solvation effects. We show that molecular docking combined with molecular mechanics simulations of single-point mutants of the agonist–receptor complex accurately predicts the functional outcome of single amino acid substitutions in a human bitter taste receptor.
Key words: : bitter taste, directed evolution, GPCR selectivity, GPCR specificity, hT2R16, human bitter taste receptor 16, ligand binding, molecular dynamics, mutation simulations, single amino acid substitutions
1. Introduction
Understanding how single amino acid substitutions (mutations) impact protein function is relevant to uncover disease mechanisms and for fostering personalized medicine. The introduction of mutations and subsequent selection of mutants with increased response to a ligand or with affinity toward a different ligand is a strategy referred to as directed evolution. This strategy has been explored for developing G protein-coupled receptor (GPCR)-based biosensors (Sen et al., 2005; Ault and Broach, 2006), among other applications. In both personalized medicine and directed evolution contexts, the ability to predict the functional outcome of single amino acid substitutions is very desirable. The challenge is that a single amino acid substitution may disrupt function either directly (e.g., a catalytic site mutation) or indirectly (e.g., by affecting structural stability or cell trafficking), and it is difficult to differentiate between these two effects without extensively annotating functional sites. Moreover, a mutation may affect the folding process rather than the stability of the folded protein, and current methods for predicting mutation outcomes only account for structural stability of the folded protein. It is difficult to create a mathematical model for functional stability per residue position without having large amounts of experimental data to support it. Even if such a model is created for a particular protein, generalizing it to be applicable to diverse sets of proteins would be extremely difficult.
Most mutations that affect protein function cause structural destabilization (Yue et al., 2005; Yang et al., 2013). Changes in free energy caused by mutations have been used to estimate structural stability (Potapov et al., 2009) and predict functional effects. These changes are often calculated using molecular dynamics and a force field energy function (Potapov et al., 2009). However, empirical energy functions and other methods such as statistical potentials (Dehouck et al., 2011, 2009) and machine learning algorithms (Yue et al., 2005; Masso and Vaisman, 2008; Chen et al., 2009; Dehouck et al., 2009; Ferrada and Melo, 2009) have also been employed. Structural descriptors such as solvent accessibility and secondary structure propensity as well as residue–residue interaction networks have also been used with limited success (Li et al., 2011; Martin et al., 2011; Wang et al., 2012; Yang et al., 2013).
The performance of these methods in predicting effects of mutations on protein function is weak and highly depends on protein conformational sampling (Potapov et al., 2009; Kellogg et al., 2011; Gerek et al., 2013). Methods based on structural dynamic flexibility have also been employed (Echave and Fernandez, 2010; Gerek et al., 2013). These methods represent only a small improvement (3–4%) over traditional evolutionary methods based on sequence alignment, but carry a much higher computational cost (Li et al., 2011). Most prediction methods tend to overestimate the effects of mutations at conserved sites while underestimating them at variant sites, and are not geared toward identifying mutations that change specificity or selectivity of a particular ligand. These discrepancies likely come from underestimating structural flexibility.
In this article, we present a whole-protein approach that takes into account the effects on agonist binding of substitutions in every single amino acid position within a receptor. Our approach is validated using published experimental data that correlate surface expression and agonist response for 424 single-point mutants (Greene et al., 2011), and that cross-compares mutant response to four ligands relative to wild type (Anu Thomas et al., in preparation). The latter identifies mutations that primarily influence ligand binding, and not expression or trafficking. We show that mutation positions that are influential in ligand specificity experimentally are identifiable using calculated binding energies from molecular mechanics-optimized single-point mutants of an agonist–receptor complex obtained through molecular docking. These influential positions are also consistent with mutation data from the literature for bitter taste receptors and other GPCRs.
1.1. Experimental data and target receptor
Bitter taste is one of five taste modalities perceived by humans (Kinnamon and Cummings, 1992; Gilbertson et al., 2000; Lindemann, 2001). Its perception is mediated by the T2R family of mammalian taste receptors (Zuker et al., 2000, 2005; Adler et al., 2002). T2Rs are GPCRs with short N-terminal domains, and there are an estimated of 25 functional T2Rs in humans (Zuker et al., 2000; Lindemann, 2001). Human bitter taste receptor 16 (hT2R16) is a broadly tuned member of the human T2R family capable of detecting various molecules structurally similar to β-glucopyranosides (Bufe et al., 2002; Behrens et al., 2007; Greene et al., 2011). Greene and coauthors recently obtained experimentally a functional map of single-point amino acid replacements for hT2R16 using shotgun mutagenesis (Greene et al., 2011). Their initial analysis focused on mutations that affected probenecid response without affecting response to salicin. An extended analysis of the same shotgun mutagenesis library identified mutations that primarily influence ligand binding (Anu Thomas et al., in preparation). These two sets of data were used in the present article to assess the quality of whole-protein molecular dynamics-based functions for predicting the effects of single amino acid substitutions in the functional response of (hT2R16) to its agonist (salicin).
2. Methods
2.1. Generation of three-dimensional structures
The bitter taste receptors have no experimentally determined structure, and hence the structure for hT2R16 had to be predicted. Taste receptors are considered to be closer to Frizzled receptors than to other GPCR subfamilies (Lagerstrom and Schioth, 2008). Only recently (March, 2013) an experimentally determined structure for the TM domain of a frizzled receptor (smoothened receptor, PDB code 4JKV) has become available. However, the sequence homology between the smoothened receptor and hT2R16 is very low (10% sequence identity). Instead of using the smoothened receptor as template structure, we opted building the hT2R16 3D model using the ab initio 3D structure of hT2R38 (Floriano et al., 2006) as template. Because these receptors share low sequence identity (22%), a multiple-sequence alignment of all human bitter taste receptors was constructed to guide modeling. The amino acid sequences of all 25 human bitter taste receptors were downloaded from NCBI and aligned using the program ClustalX (Thompson et al., 2002). The default GONNET substitution matrix was used in all alignments.
We constructed an alignment tailored to be used in homology-based modeling by setting gap penalties according to the secondary structure of the hT2R38 template. The resulting alignment, which maintained the integrity of the helical structures, was used to build the hT2R16 model. The molecular modeling software MOE (Molecular Operating Environment, 2014) was used to build and optimize the model. Optimization was performed by simulated annealing minimization. The root mean square deviation in carbon alpha coordinates (RMSD-Ca) between the final hT2R16 3D model and the corresponding hT2R38 template was 1.16Å. The 3D model was evaluated for deviation from standard values of bond lengths and angles, torsion angles, planarity, side-chain conformers, and overall quality. Deviations from standard values indicate the need for further optimization of the structure. The program Procheck (Laskowski et al., 1993) was used to perform stereochemical quality analysis of the 3D model.
A second alignment between class A GPCRs and taste receptors was constructed to allow comparison of mutation data, which are abundant for class A GPCRs due to their pharmacological relevance. The alignment of 25 human bitter taste receptors was aligned to a prebuilt alignment of 18,211 class A GPCRs from the GPCRDB (Vroling et al., 2011; Isberg et al., 2014) using the Profile option in ClustalX (Thompson et al., 2002). Key GPCRs from the resulting alignment were used in our mutation for data comparison.
2.2. Validation of the hT2R16 models through docking and scoring of known ligands
An initial set of five ligands was constructed and docked to the hT2R16 model. This set included ligands for which receptor response is known (Behrens et al., 2007; Greene et al., 2011): salicin and phenyl-beta-D-glucoside are agonists; probenecid is an antagonist; phenyl-beta-D-galactoside and phenylthiocarbamide elicit no response. The initial structures of the ligands were constructed and optimized using the software MOE (Molecular Operating Environment, 2014). SMILES strings for each compound were obtained from NCBI's PubChem. Gasteiger partial charges were assigned to each ligand, and energy minimizations (MMFF94X force field) were performed to prepare the ligands for the docking simulations. Docking and scoring were performed using HierVLS (Floriano et al., 2004) as implemented in Cassandra (Ramjan et al., 2008). The force field-based binding energies calculated for the known ligands docked to the hT2R16 models were used to evaluate the adequacy of each model in representing the binding interactions between receptor and agonists. Using binding energy analysis, the hT2R16 model was found to adequately represent the experimental responses. The salicin–hT2R16 complex obtained from this molecular docking study was used to carry out the single amino acid mutation simulations. The probenecid–hT2R16 complex obtained by molecular docking was used to identify positions within the active site involved in antagonist (probenecid) but not agonists (salicin) binding. Contact analysis was performed using the program Yasara (Krieger et al., 2004) with a cutoff distance of 5 Å.
2.3. Simulating single-point mutations
Every position in the modeled structure of hT2R16 was mutated to each of the 20 standard amino acids. A rotamer optimization of the mutated side chain was followed by an all-atoms energy minimization. The force field used in the simulations was YAMBER (Krieger et al., 2004) with particle mesh Ewald long-range electrostatic interactions. Solvation energies were calculated using Poisson–Boltzmann solvation, as implemented in the modeling software Yasara. All mutations were performed from the same starting structure, with salicin bound to the putative active site of hT2R16. For each position, the wild-type amino acid was treated exactly the same as the other 19, resulting in one wild-type binding energy per amino acid position. Three binding energies were calculated:
1. Binding energy for a globular protein (BEG), with solvation of the ligand, complex, and free protein.
 |
where i is the position number, epot is the potential energy for the complex (epotcmp), free protein (epotrec), or free ligand (epotlig), and esolv is the solvation energy for the complex (esolcmp), free protein (esolvrec), or free ligand (esollig). More positive BEG values indicate better binding.
2. Gas-phase (Yasara) binding energy (BEY). Yasara has a built-in protocol for calculating binding energies (BindEnergyObj command). The binding energy is obtained by calculating the energy at infinite distance between the selected object and the rest of the simulation system (i.e., the unbound state) and subtracting the energy of the simulation system (i.e., the bound state).
 |
More positive BEY binding energies indicate more favorable binding in the context of the chosen force field. Solvation effects are not considered in the calculations.
3. Binding energy for membrane-bound protein (BEM). These are similar to (1), except that only the free ligand is considered to be solvated in water. More negative BEM values indicate more favorable binding.
 |
2.4. Principal component analysis
Principal component analysis (PCA) finds new set of variables (principal components) that are linear combinations of the original variables. PCAs were calculated for the complete set of binding energies obtained from the single-point mutation calculations using each of the three binding energy schemes, BEY, BEG, and BEM. PCA was also applied to the two experimental variables, Surf_Exp and Ca_Flux, expressed as percentage of the wild-type hT2R16. We calculated PCAs with the program Past (Hammer et al., 2001), using the correlation matrix and the singular value decomposition algorithm for eigenanalysis. The resulting principal components (one per variable) are orthogonal and each accounts for a portion of the total variance in the data. Often, the first component (PC1) carries most of the variance in the original data. For the binding energy data, PC1 represents the overall effect of the 20 mutations at each amino acid position. For the experimental data, PC1 represents the combined effect of surface expression levels and calcium flux in response to salicin.
3. Results and Discussion
3.1. Structural analysis of the ligand-bound 3D model of hT2R16
The 3D model of hT2R16 bound to salicin (an agonist) is shown in Figure 1, with the side chains of residues within 5 Å of the bound salicin in stick representation. These contact residues are expected to have significant influence on ligand binding due to their location within the binding cavity, in direct contact with the bound ligand in the predicted ligand–receptor structures. Mutations within this group are expected to significantly influence the calculated binding energies, which in turn should correlate with calcium flux in response to salicin, after surface expression levels are taken into account. These residues are T82, I83, E86, H181, L185, I247, T250, L251, K254, and W257.
FIG. 1.
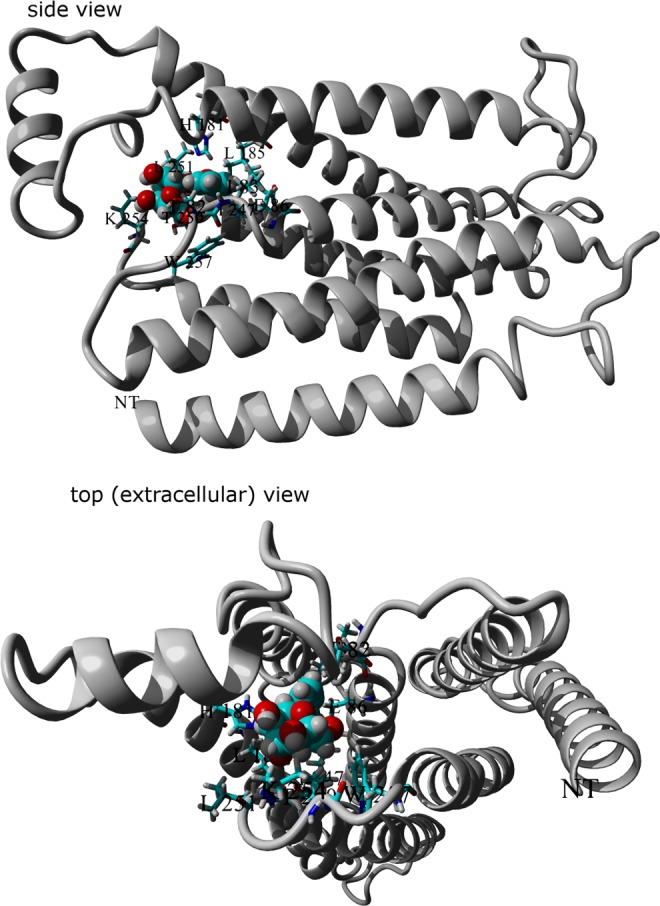
Amino acids predicted by molecular docking to be in direct contact (5.0 Å) with salicin (spaced-filled) bound to hT2R16 (ribbon). Amino acids within 5.0 Å from the bound ligand are shown in stick representation.
3.2. Identification of positions influential in salicin binding based on percent variation in calculated binding energy for mutants
A series of position versus amino acid substitution tables were created in html format for the simulation results (Fig. 2). Each row corresponds to one position in the amino acid sequence of hT2R16. Each column corresponds to one of the 20 standard amino acids being present at that position. At each position (row), the matrix cell corresponding to the amino acid found in the wild-type receptor has white font numbers. Cells corresponding to mutations with less than 10% variation (for better or worse) in calculated binding energy relative to wild type are marked gray. Cells corresponding to mutation positions predicted to produce variations in binding energy above or below 10% are colored based on normalized (N) values between minimum (Emin) and maximum binding energies (Emax):
 |
FIG. 2.


(A) Globular proteins binding energies (BEG), (B) gas-phase (Yasara) binding energies (BEY), and (C) membrane-bound binding energy (BEM) for wild type and mutants of hT2R16 bound to salicin. Each row corresponds to one position in the amino acid sequence of hT2R16. Each column corresponds to one of the 20 standard amino acids being present at that position. At each position (row), the matrix cell corresponding to the amino acid found in the wild-type receptor has binding energies written in white font. Cells corresponding to mutations with less than 10% variation (for better or worse) in calculated binding energy relative to wild type are marked gray. Rows that contain at least one cell with a variation in binding energy above 10% are colored based on normalized values at each mutation point, with 1 (worse) corresponding to red and 0 (best) corresponding to violet. Only selected sections of the full matrix are shown for clarity.
Although the cells are colored based on normalized values, the value within each cell corresponds to the actual binding energy calculated according to the schemes discussed earlier. For all three binding energies, 1 is worse (red) and 0 is best (violet), and cells with colors to the left (toward violet) of the wild-type color indicate that binding to the mutant is more favorable than binding to the wild-type receptor. The number of mutation positions leading to 10% or more change in calculated binding energy for any of the amino acid substitutions at those positions is summarized in Table 1, along with the list of position numbers.
Table 1.
List of Mutation Positions Identified Experimentally as Outstanding and Positions Identified as Influential in Ligand Binding to hT2R16 by Different Binding Energy/Selection Schemes
| Method (number of positions) | Critical positions for ligand binding | |||||||||||||||||||
|---|---|---|---|---|---|---|---|---|---|---|---|---|---|---|---|---|---|---|---|---|
| Exp_PC1 (124) | 7 | 10 | 13 | 14 | 16 | 17 | 18 | 24 | 25 | 32 | 35 | 38 | 39 | 45 | 46 | 48 | 49 | 50 | 51 | 54 |
| 56 | 58 | 59 | 60 | 61 | 64 | 72 | 73 | 74 | 75 | 76 | 78 | 80 | 81 | 82 | 83 | 89 | 92 | 94 | 97 | |
| 102 | 104 | 106 | 107 | 108 | 112 | 113 | 114 | 120 | 130 | 133 | 134 | 135 | 136 | 141 | 143 | 148 | 151 | 152 | 153 | |
| 155 | 156 | 157 | 158 | 159 | 160 | 161 | 162 | 165 | 168 | 169 | 172 | 173 | 176 | 178 | 179 | 181 | 183 | 185 | 186 | |
| 187 | 189 | 191 | 196 | 200 | 202 | 204 | 205 | 206 | 207 | 208 | 209 | 212 | 214 | 215 | 216 | 221 | 222 | 223 | 227 | |
| 231 | 232 | 233 | 234 | 238 | 239 | 240 | 243 | 244 | 250 | 253 | 255 | 256 | 259 | 260 | 262 | 268 | 269 | 271 | 274 | |
| 275 | 276 | 277 | 278 | |||||||||||||||||
| Exp_2 (14) | 59 | 77 | 79 | 81 | 82 | 90 | 144 | 148 | 184 | 222 | 257 | 258 | 261 | 262 | ||||||
| Exp_3 (16) | 71 | 79 | 85 | 86 | 89 | 93 | 94 | 177 | 181 | 185 | 240 | 242 | 243 | 251 | 262 | 265 | ||||
| Ala_BEY (8) | 82 | 86 | 168 | 181 | 247 | 250 | 253 | 257 | ||||||||||||
| Ala_BEG (45) | 11 | 14 | 17 | 44 | 49 | 53 | 58 | 59 | 60 | 61 | 67 | 72 | 73 | 79 | 81 | 82 | 83 | 86 | 89 | 94 |
| 95 | 119 | 125 | 128 | 149 | 150 | 154 | 175 | 178 | 181 | 182 | 187 | 188 | 230 | 234 | 243 | 247 | 250 | 251 | 252 | |
| 253 | 254 | 258 | 261 | 268 | ||||||||||||||||
| Ala_BEM (9) | 82 | 86 | 168 | 181 | 247 | 250 | 251 | 253 | 257 | |||||||||||
| BEY_10% (5) | 150 | 181 | 247 | 250 | 257 | |||||||||||||||
| BEG_10% (49) | 9 | 25 | 63 | 66 | 70 | 78 | 79 | 80 | 82 | 83 | 84 | 85 | 86 | 87 | 88 | 89 | 90 | 91 | 92 | 143 |
| 147 | 150 | 152 | 157 | 161 | 178 | 179 | 181 | 184 | 185 | 186 | 188 | 193 | 240 | 243 | 244 | 246 | 247 | 248 | 250 | |
| 251 | 253 | 254 | 255 | 257 | 258 | 261 | 264 | 265 | ||||||||||||
| BEM_10% (81) | 66 | 70 | 73 | 74 | 77 | 78 | 79 | 80 | 81 | 82 | 83 | 84 | 85 | 86 | 87 | 89 | 90 | 91 | 93 | 143 |
| 144 | 146 | 147 | 148 | 149 | 150 | 151 | 152 | 153 | 154 | 155 | 156 | 157 | 158 | 159 | 160 | 161 | 162 | 164 | 165 | |
| 167 | 168 | 169 | 171 | 173 | 174 | 177 | 178 | 180 | 181 | 184 | 185 | 186 | 188 | 189 | 192 | 236 | 238 | 239 | 240 | |
| 241 | 242 | 243 | 244 | 245 | 246 | 247 | 248 | 249 | 250 | 251 | 252 | 253 | 254 | 255 | 257 | 258 | 260 | 261 | 264 | |
| 268 | ||||||||||||||||||||
| BEY_PC1 (11) | 82 | 86 | 147 | 157 | 158 | 168 | 181 | 250 | 251 | 253 | 257 | |||||||||
| BEG_PC1 (24) | 73 | 80 | 82 | 83 | 85 | 86 | 89 | 93 | 143 | 147 | 150 | 168 | 181 | 182 | 184 | 185 | 188 | 246 | 247 | 252 |
| 253 | 254 | 257 | 261 | |||||||||||||||||
| BEM_PC1 (13) | 82 | 86 | 147 | 157 | 158 | 168 | 181 | 185 | 250 | 251 | 253 | 254 | 257 | |||||||
| hT2R16-salicin at 5Å (10) | 82 | 83 | 86 | 181 | 185 | 247 | 250 | 251 | 254 | 257 | ||||||||||
Influential positions in ligand binding were determined experimentally by Exp_PC1, principal component analysis of data from shotgun mutagenesis followed by functional response to salicin (Greene et al., 2011); Exp_2, mutant response to four ligands with the positions most important for salicin binding underlined; and Exp_3, mutation studies reported in the literature for bitter taste receptors and other GPCRs, with positions identified directly against hT2R16 underlined. These are compared to the influential mutation positions identified with binding energies calculated using the BEY, BEG, or BEM schemes for 273 × 20 standard amino acids mutants, or for 273 × Ala mutants of hT2R16 bound to salicin. PC1 or 10% refer to the criteria used to identify influential mutations using the calculated binding energies. Positions within contact distance (5 Å) from bound salicin in our 3D model are also listed for comparison (hT2R16-salicin at 5 Å). For shotgun mutagenesis data, mutations were considered outstanding if the first principal component of the Surf_Exp/Ca_Flux combination (PC1) was one standard deviation above or below the mean value for all mutants.
We chose 10% variation as threshold through trial and error based on the sensitivity of the binding energy schemes to mutations expected to have very little influence on binding energies, such as positions facing the outside of the transmembrane bundle in the hT2R16 3D model. The residues facing outward in the helix bundle used in this analysis are 11, 15, 19, 22 (TM1); 50, 54, 57, 65, 68 (TM2); 87, 88 (TM3); 126, 130, 134, 141 (TM4); 183, 187, 191, 194 (TM5); 235, 241, 245, 252 (TM6); and 260, 263, 267 (TM7). The number of mutations in the transmembrane domains leading to 10% or more change in calculated binding energy is very low for all three binding energy schemes tested (BEG = 2/26; BEY = 0/26; BEM = 5/26). Moreover, the gas-phase energy BEY is the least sensitive to mutations on residues facing outward in the helix bundle, consistent with the hypothesis that outward transmembrane residues within the model should not affect calculated binding energies directly but through solvation energy.
A total of 49, 5, and 81 out of 273 positions were identified as influential in binding, respectively, by the BEG_10%, BEY_10%, and BEM_10% schemes. BEG_10% and BEM_10% binding energy schemes lead to 10% or more change in calculated binding energy relative to wild type for all the amino acids in direct contact with salicin in the 3D model, whereas the smaller set obtained with BEY_10% included 4 of them.
3.3. Identification of positions influential in salicin binding based on PC1
We used PCA to reduce the complexity of the 273 × 20 BEY, BEM, and BEG binding energy matrices into their most representative components to facilitate the identification of influential positions in ligand binding. In our PCA analysis, we found that PC1 represents 72% (BEM), 70% (BEY), and 37% (BEG) of the variance in each data set analyzed. Although the variance carried by BEG_PC1 is quite low and thus not representative of the data, we proceed with its analysis for consistency with the other two schemes. We considered positions yielding PC1 scores one standard deviation above or below the mean as influential in ligand binding. These PC1 scores are combinations of the binding affinities of all the possible substitutions at each position, and the ones deviating the most from the mean indicate the relative importance of that position to the binding energies. The list of influential positions identified by the PC1 analysis is provided in Table 1 under BEY_PC1, BEG_PC1, and BEM_PC1.
3.4. Each-to-all versus each-to-alanine replacements
Since calculating single-point mutations of every position in a protein structure to every one of the 20 standard amino acids is time-consuming, we compared the each-to-all results to a simpler alanine (Ala) scanning, where each position within the receptor's structure is mutated to Ala but not to the other amino acids. Using one standard deviation above or below the means as cutoff, a total of 45, 8, and 9 positions were identified as influential for agonist binding by, respectively, the Ala_BEG, Ala_BEY, and Ala_BEM binding energy schemes (Table 1). Using Ala scanning with a one standard deviation cutoff, the number of influential positions identified by BEM_10% binding energies dramatically changes from 81 to 9, whereas the other two binding energy schemes produce comparable lists of influential positions (the list of positions is provided in Table 1). The alanine replacement approach with BEY or BEM binding energies places all positions in direct contact with salicin in the 3D model in the influential list, whereas BEG misses position 257. Next, we will use experimental data to validate the influential positions assignment based on calculated binding energies.
3.5. Deconvolution of surface expression and calcium flux in response to salicin
Surface expression levels (Surf_Exp) and calcium flux in response to salicin (Ca_Flux) were determined experimentally for a library of hT2R16 mutants by Greene et al. (2011). A subset of 424 single-point mutants corresponding to substitution within the range of amino acids in our 3D models was obtained from the authors and utilized in our work to validate the different simulation schemes. In Figure 3 we show histograms for calcium flux (blue) and cell surface expression (red) of single-point mutants as percentage of the wild-type hT2R16 values. As indicated in the histogram, the majority of mutations reduce the response to salicin (calcium flux is less than 100% of the wild-type response), some very significantly. Few mutants have higher response to salicin than wild-type hT2R16, as evidenced by the low frequency of mutants above 100% calcium flux. Surface expression is also altered by the single-point mutations, with the majority of mutants expressing near-WT levels. An analysis of the correlation between surface expression and salicin-induced calcium flux (Fig. 4a) shows no linear correlation (correlation coefficient r2 is 0.12 for all points). Some mutations may alter surface expression levels without directly impacting binding affinity, whereas others may have an effect in both. Differences in response to salicin as measured by calcium flux may, therefore, be due to differences in surface expression, differences in binding affinities between mutants and salicin, or a combination of both.
FIG. 3.

Histogram for cell surface expression (Surf_Exp) and calcium flux in response to salicin (Ca_Flux) for single-point mutants of hT2R16. The majority of mutations reduce the response to salicin (calcium flux is less than 100% of the wild-type response). Relatively few mutants have higher response to salicin than wild-type hT2R16, as evidenced by the low frequency of mutants above 100% calcium flux. Surface expression is also altered by single-point mutations, with almost as many mutants expressing at lower levels than at higher levels relative to the wild-type hT2R16.
FIG. 4.

Correlation between surface expression (Surf_Exp), calcium flux in response to salicin (Ca_Flux), and the first principal component (PC1) obtained from a principal component analysis of the two experimental variables.
The experimental response to salicin is, thus, dependent on the expression levels of the receptor. An increase/decrease in the amount of functional receptor may induce a correspondent change in calcium flux that is not related to changes in binding affinity caused by a mutation. Our calculations, however, only estimate the effect of each mutation in the binding energy. Therefore, we cannot directly compare binding energies to the experimental calcium responses without adjusting for surface expression levels. In other words, we need to combine the two experimentally obtained quantities into one quantity that accounts for variation in both surface expression and response to salicin simultaneously.
We used PCA to accomplish this goal. The resulting principal components, PC1 and PC2, are orthogonal and each accounts for a portion of the total variance in the data. In the Surf_Exp/Ca_Flux analysis, PC1 carried 67% of data variance, whereas PC2 carried 33%. A graphical representation of the correlation between PC1 and the original variables Surf_Exp and Ca_Flux is presented in Figure 4b and 4c. The first component, PC1, represents the most variance in the original data and it was thus used to identify mutation positions that dramatically affect the receptor's response to salicin. We considered as “outstanding” any mutation that produced a PC1 above or below one standard deviation from the mean. A total of 124 outstanding mutation positions for salicin binding were identified from this analysis and are listed as Exp_PC1 in Table 1. These are compared to positions identified computationally, as well as to additional experimental data, in Table 2.
Table 2.
Percentage of Influential Positions Identified by Different Methods (Rows) That Are Found in the Three Experimentally Determined Groups of Outstanding Positions for Ligand Binding (Columns)
| Scheme | n | Exp_PC1 | Exp_2 | Exp_3 | Exp_2 + Exp_3 | All Exp groups |
|---|---|---|---|---|---|---|
| Exp_PC1 | 124 | 100 | 6 | 6 | 10 | 100 |
| Exp_2 | 14 | 43 | 100 | 14 | 100 | 100 |
| Exp_3 | 16 | 44 | 13 | 100 | 100 | 100 |
| Ala BEY | 8 | 63 | 25 | 25 | 50 | 88 |
| Ala BEG | 45 | 49 | 13 | 16 | 22 | 60 |
| Ala BEM | 9 | 56 | 22 | 33 | 55 | 89 |
| BEY_10% | 5 | 40 | 20 | 20 | 40 | 60 |
| BEG_10% | 49 | 45 | 14 | 20 | 33 | 65 |
| BEM_10% | 81 | 49 | 14 | 15 | 27 | 67 |
| BEY_PC1 | 11 | 64 | 18 | 27 | 45 | 91 |
| BEG_PC1 | 24 | 42 | 13 | 25 | 38 | 63 |
| BEM_PC1 | 13 | 62 | 15 | 31 | 46 | 85 |
| hT2R16-salicin | 10 | 50 | 20 | 50 | 60 | 80 |
Influential positions in ligand binding were identified by Exp_PC1, principal component analysis of data from shotgun mutagenesis followed by functional response to salicin (Greene et al., 2011); Exp_2, mutant response to 4 ligands; Exp_3, mutation studies reported in the literature for bitter taste receptors and other GPCRs; calculated binding energies for 273 × 20 standard amino acids mutants of hT2R16 bound to salicin, with selection based on 10% energy difference (BEY_10%, BEG_10%, BEM_10%) or PC1 (BEY_PC1, BEG_PC1, BEM_PC1); Ala_BEY, Ala_BEG, Ala_BEM, calculated binding energies for 273 × Ala mutants of hT2R16 bound to salicin; hT2R16-salicin, positions within 5 Å of bound salicin in the hT2R16-salicin modeled structure. The last column is the percentage of positions found in all three experimental groups combined. n is the number of positions identified by each scheme.
3.6. Effect of hT2R16 mutations on the activity of four ligands
The same experimental mutant library described in the previous sections was further studied for ligand binding (Anu Thomas et al., in preparation). The activity of four different ligands was tested against the entire library of hT2R16 mutants: salicin, 4-nitrophenyl-β-D-mannopyranoside (mannopyranoside), hexyl-β-D-glucopyranoside (hexyl), and phenyl-N-acetyl-β-D-glucosaminide (glucosaminide). The activity of each ligand against a specific hT2R16 mutant was compared to the activity of the same ligand against wild-type hT2R16. Mutations that showed differences between the ligands with at least one ligand showing near wild-type levels of activity were considered to indicate proper folding and signaling of the receptor. These results identified a total of 14 mutation positions as influential in ligand binding. These are listed as Exp_2 in Table 1, and are used to assess our in silico methodology as well. Four mutations were found to influence salicin binding significantly (more than 60% reduction in calcium flux relative to wild type). These most influential mutations (shown underlined in Table 1) affect positions 79, 257, 258, and 261 in the amino acid sequence of hT2R16.
3.7. Mutations reported in the literature affecting ligand recognition in bitter taste receptors and other GPCRs
We used the alignment between bitter taste receptors and other GPCRs described in the Methods section to annotate amino acid positions identified experimentally as important for ligand recognition in bitter taste receptors T2R9 (Dotson et al., 2008), T2R16 (Sakurai et al., 2010), T2R44 (Pronin et al., 2004), T2R38 (Biarnes et al., 2010), and T2R46 (Brockhoff et al., 2010), and four other GPCRs (Strader et al., 1994; Wieland et al., 1996b; Alberts et al., 1998a,b; Allman et al., 2000; Klabunde and Hessler, 2002; Bissantz, 2003): acetylcholine muscarinic (ACM1_HUMAN), β2-adrenergic receptor (B2AR_HUMAN), dopamine receptor (DRD3_HUMAN), and purinergic receptor (P2RY1_HUMAN). The comparison of these amino acid positions identified experimentally as important for ligand recognition resulted in 16 key positions in transmembrane domains 3, 5, 6, and 7, as shown in Figure 5. These are referred to as Exp_3 in Tables 1 and 2 (numbering refers to the human T2R16 sequence): Y71, C79, W85, E86, N89, F93, W94, Q177, H181, L185, F240, T242, I243, L251, E262, and V265. The underlined amino acids were identified in studies directly involving hT2R16.
FIG. 5.

Mutations reported in the literature affecting ligand recognition in bitter taste receptors and other GPCRs. The sequences included in the alignment are T2R9 (Dotson et al., 2008), T2R16 (Sakurai et al., 2010), T2R44 (Pronin et al., 2004), T2R38 (Biarnes et al., 2010), and T2R46 (Brockhoff et al., 2010), and four other GPCRs (Strader et al., 1994; Wieland et al., 1996b; Alberts et al., 1998a,b; Allman et al., 2000; Klabunde and Hessler, 2002; Bissantz, 2003): acetylcholine muscarinic (ACM1_HUMAN), β2-adrenergic receptor (B2AR_HUMAN), dopamine receptor (DRD3_HUMAN), and purinergic receptor (P2RY1_HUMAN). For simplicity, only the amino acids corresponding to transmembrane domains (TMs) 3, 5, 6, and 7 are shown. The secondary structure assignment is based on the experimentally determined structure for β2-adrenergic receptor with pdb code 2RH1 (!b2ar), and on the predicted secondary structure for hT2R38 (!TMPLT). Amino acids experimentally determined to be involved in agonist binding for bitter taste receptors and for four other GPCRs are boxed, whereas amino acids predicted as influential in ligand binding in our study using Ala_BEY binding energies are shaded gray (T82 and E86 in TM 3, I150 [EC 2, not shown], D168 [EC 2, not shown], H181 [TM 5], I247 [TM 6], T250 and D253 in EC 3, and W257 [TM 7]).
3.8. Agreement between predicted and experimental positions influential in ligand binding
The lists of positions identified as influential in ligand binding determined experimentally by PCA of data from shotgun mutagenesis followed by functional response to salicin (Exp_PC1), mutant response to four ligands (Exp_2), and mutation studies reported in the literature for bitter taste receptors and other GPCRs (Exp_3) are compared in Table 2 to the influential mutation positions determined by calculated binding energies for 273 × 20 standard amino acids mutants with selection by a 10% binding energy cutoff (BEY_10%, BEM_10%, BEG_10%) or by a one standard deviation from the mean PC1 (BEY_PC1, BEM_PC1, BEG_PC1), and for 273 × Ala mutants of hT2R16-salicin (Ala_BEY, Ala_BEM, and Ala_BEG). All these positions are graphically compared in Figure 6.
FIG. 6.

Graphical comparison of influential positions in ligand binding determined by Exp_PC1, principal component analysis of data from shotgun mutagenesis followed by functional response to salicin (Greene et al., 2011); Exp_2, mutant response to four ligands; Exp_3, mutation studies reported in the literature for bitter taste receptors and other GPCRs; calculated binding energies for 273 × 20 standard amino acids mutants of the hT2R16-salicin complex, with selection based on 10% energy difference (BEY_10%, BEG_10%, BEM_10%) or PC1 (BEY_PC1, BEG_PC1, BEM_PC1); Ala_BEY, Ala_BEG, Ala_BEM, binding energies calculated for 273 × Ala mutants of hT2R16 bound to salicin.
It is interesting to note that the overlap between influential positions in the three experimentally determined groups is very low. Exp_PC1, the largest group with 124 positions, contains 43% of the positions in Exp_2, and 44% of the positions in Exp_3, whereas Exp_2 and Exp_3 share only two positions in common: 79 (loop between TM2 and TM 3) and 262 (TM 7). The only position that is common to all three experimentally determined groups is 262, which is located in TM7, facing the inside of the helical bundle in the extracellular side of the receptor. This location is consistent with antagonist binding in other GPCRs. The large number of shotgun mutagenesis positions affecting agonist response (124/273) reflects the complex balance between structure and function in GPCRs, and likely include mutations that affect signal transduction or G protein coupling in addition to mutations directly affecting ligand binding. The diversity of positions implicated experimentally in agonist response in multiple studies of bitter taste receptors suggests that agonist specificity in these broad-response receptors is achieved by multiple binding modes causing activation of the receptor.
The computational scheme with best overall performance is BEY_PC1 (gas-phase binding energies with PCA selection), which identifies 11 positions as influential in ligand binding out of 273 mutated, with 91% of them found in the experimental sets. The only position predicted as influential but not found in one of the experimental sets is 247 (TM 6). However, amino acid I247 in hT2R16 aligns to N293 in β2-adrenergic receptor (b2ar in Fig. 5) that has been implicated in stereospecific agonist recognition (Wieland et al., 1996a), conferring confidence in this assignment. Not far behind in performance are Ala_BEM and Ala_BEY with, respectively, 9 and 8 positions predicted to be influential in ligand binding. Ala_BEM has 89% of its 9 predicted influential positions validated by the experimental sets. Ala_BEY has 63% of its 8 influential positions belonging to experimental set 1 and 50% found in experimental sets 2 and 3 combined, to a total of 88% of its influential positions validated.
All three best performers share a common set of influential positions, which is the set that corresponds to Ala_BEY. All three schemes have all but one influential position not included in the experimental sets used for validation: position 247 (TM6), which, as discussed before, is implicated in agonist recognition in a related receptor (Wieland et al., 1996a). It is interesting to notice that the best-performing schemes correctly assign more influential positions than a selection of positions based on proximity to the bound salicin in our docked model does (hT2R16-salicin in Tables 1 and 2). The good performance of the proximity selection attests of the good quality of the model. However, the better performance obtained by the whole-protein mutation schemes indicates that the extra work required to optimize the structures and calculate the binding energies for the mutants is justified.
The BEM_PC1 scheme also performs well, with 85% of its 13 positions predicted as influential belonging to the experimental sets. The BEM_PC1 influential positions not verified experimentally are 147 and 254. Position 147 is located in TM4, whereas position 254 is located in the extracellular loop connecting TMs 6 and 7, both in close proximity to the bound agonist in our 3D model. The worse performer among the PC1-based selection schemes is BEG_PC1, with only 63% of its 24 influential positions belonging to an experimental set. This low performance is likely reflecting the low variance carried by PC1 in this case (37%), enforcing the common notion that for PC1 to be representative of the data it needs to carry most of the variance in the data.
The three schemes with selection based on a 10% variation in binding energy for any of the 19 mutants at a given position (BEY_10%, BEG_10% and BEM_10%) perform worse than selection of influential positions based solely on proximity to the bound ligand in the 3D model (hT2R16-salicin in Tables 1 and 2). The significant difference in overall performance reflects a fundamental difference between the two approaches. The 10% selection flags a position even in cases where only one of the mutations leads to 10% or more change in binding energy, but the other amino acid substitutions at that same position are tolerated well. PC1, on the other hand, reflects the overall effect mutations have at each position. To be outstanding in the PC1 selection scheme, the position must be significantly affected by mutations in general, compared to the other positions.
Overall, the binding energy scheme that water-solvates the agonist–receptor complex (BEG) did not perform as well as the other two, which are more compatible with the membrane-bound nature of bitter taste receptors. Worth noting is that the binding energy scheme BEG_10% outperformed the others in the ability to identify mutation positions critical for salicin response. All four most influential positions (79, 257, 258, and 261) in salicin binding from experimental group 2 and most of the hT2R16-specific positions from experimental group 2 were flagged by BEG as influential (both sets of positions are underlined in Table 2). However, the number of positions not supported by experimental data is considerable (16 out of 49 assigned as influential), which reduces the overall performance of this scheme.
The Ala scanning performed remarkably well for a much more simplified simulation. This is also observed experimentally with mutation libraries (Zhen et al., 1998; Faham et al., 2004; Fountain and North, 2006; Yamada and Yamamoto, 2006; Yamamoto et al., 2006; Serrano-Vega et al., 2008). However, the extra computational cost required by a full 20 amino acid mutations per position in the receptor's sequence may be justified in cases where mutation effects on the response to a specific agonist, as opposed to general agonist response, are sought.
4. Conclusions
We constructed a 3D model for salicin bound to hT2R16 without prior knowledge of mutant stability and function. We used this 3D model to simulate the effects of single-point mutations on the binding affinity of the receptor for its agonist through molecular dynamics calculations. These simulations provided an effective way to identify mutation positions that are significant for ligand binding and receptor activations, as demonstrated by the agreement between predicted and experimental data.
Among the schemes tested, BEY_PC1 (gas-phase binding energies with identification of influential positions through principal component analysis) has the best performance. This scheme identifies 11 positions as influential out of 273 mutated with only one position not having been implicated experimentally in bitter taste receptors ligand binding (247 in TM 6). However, this amino acid aligns to N293 in β2-adrenergic receptor that has been implicated in stereospecific agonist recognition (Wieland et al., 1996a), validating all 11 predicted positions. A simplified scheme using BEY energies where only mutations to Alanine are considered (Ala_BEY) performs comparatively well at a much lower computational cost. Both schemes outperform a simple distance-based analysis of the agonist-bound complex for identification of positions that influence ligand binding.
The caveat in our approach is that the single-point mutation calculations look at mutation effect on the binding energy of only one bound ligand (salicin, in the present case). Different ligands may be affected by the same mutation differently, depending on the location of the mutation relative to the bound ligand. Only mutations that compromise structural stability, which can affect the receptor's ability to respond, will have similar effects on different ligands. Based on the performance of the different schemes, we suggest the alanine scanning simulations using a gas-phase binding energy scheme to identify positions that are influential in agonist binding in general. Whenever specificity or selectivity for a particular ligand is key, simulation of single-point mutations to all 20 standard amino acids is a better choice. The approach presented in this study can aid the design of biosensors and provide guidance for directed evolution experiments.
Acknowledgment
This work was supported by National Institutes of Health Grant DC010105.
Author Disclosure Statement
No competing financial interests exist.
References
- Adler E., Li X.D., Staszewski L., and Xu H.2002. Mammalian taste receptors. Abstracts of Papers of the American Chemical Society 224, U66 [Google Scholar]
- Alberts G.L., Pregenzer J.F., and Bin Im W.1998a. Contributions of cysteine 114 of the human D3 dopamine receptor to ligand binding and sensitivity to external oxidizing agents. Br. J. Pharmacol. 125, 705–710 [DOI] [PMC free article] [PubMed] [Google Scholar]
- Alberts G.L., Pregenzer J.F., and Im W.B.1998b. Identification of transmembrane regions critical for ligand binding to the human D-3 dopamine receptor using various D-3/D-1 transmembrane chimeras. Mol. Pharmacol. 54, 379–388 [DOI] [PubMed] [Google Scholar]
- Allman K., Page K.M., Curtis C.A.M., and Hulme E.C.2000. Scanning mutagenesis identifies amino acid side chains in transmembrane domain 5 of the M-1 muscarinic receptor that participate in binding the acetyl methyl group of acetylcholine. Mol. Pharmacol. 58, 175–184 [DOI] [PubMed] [Google Scholar]
- Ault A.D., and Broach J.R.2006. Creation of GPCR-based chemical sensors by directed evolution in yeast. Protein Eng. Des. Selection 19, 1–8 [DOI] [PubMed] [Google Scholar]
- Behrens M., Foerster S., Staehler F., et al. 2007. Gustatory expression pattern of the human TAS2R bitter receptor gene family reveals a heterogenous population of bitter responsive taste receptor cells. J. Neurosci. 27, 12630–12640 [DOI] [PMC free article] [PubMed] [Google Scholar]
- Biarnes X., Marchiori A., Giorgetti A., et al. 2010. Insights into the binding of phenyltiocarbamide (PTC) agonist to its target human TAS2R38 bitter receptor. Plos One 5, e12394. [DOI] [PMC free article] [PubMed] [Google Scholar]
- Bissantz C.2003. Conformational changes of G protein-coupled receptors during their activation by agonist binding. J. Recept. Signal Transduct. Res. 23, 123–153 [DOI] [PubMed] [Google Scholar]
- Brockhoff A., Behrens M., Niv M.Y., and Meyerhof W.2010. Structural requirements of bitter taste receptor activation. Proc. Natl. Acad. Sci. USA 107, 11110–11115 [DOI] [PMC free article] [PubMed] [Google Scholar]
- Bufe B., Hofmann T., Krautwurst D., et al. 2002. The human TAS2R16 receptor mediates bitter taste in response to beta-glucopyranosides. Nat. Genet. 32, 397–401 [DOI] [PubMed] [Google Scholar]
- Chen M., Dousis A.D., Wu Y., et al. 2009. Predicting protein folding cores by empirical potential functions. Arch. Biochem. Biophys. 483, 16–22 [DOI] [PMC free article] [PubMed] [Google Scholar]
- Dehouck Y., Grosfils A., Folch B., et al. 2009. Fast and accurate predictions of protein stability changes upon mutations using statistical potentials and neural networks: PoPMuSiC-2.0. Bioinformatics 25, 2537–2543 [DOI] [PubMed] [Google Scholar]
- Dehouck Y., Kwasigroch J.M., Gilis D., and Rooman M.2011. PoPMuSiC 2.1: a web server for the estimation of protein stability changes upon mutation and sequence optimality. BMC Bioinformatics 12, 151. [DOI] [PMC free article] [PubMed] [Google Scholar]
- Dotson C.D., Zhang L., Xu H., et al. 2008. Bitter taste receptors influence glucose homeostasis. Plos One 3, e3974. [DOI] [PMC free article] [PubMed] [Google Scholar]
- Echave J., and Fernandez F.M.2010. A perturbative view of protein structural variation. Proteins Struct. Funct. Bioinformatics 78, 173–180 [DOI] [PubMed] [Google Scholar]
- Faham S., Yang D., Bare E., et al. 2004. Side-chain contributions to membrane protein structure and stability. J. Mol. Biol. 335, 297–305 [DOI] [PubMed] [Google Scholar]
- Ferrada E., and Melo F.2009. Effective knowledge-based potentials. Protein Sci. 18, 1469–1485 [DOI] [PMC free article] [PubMed] [Google Scholar]
- Floriano W.B., Hall S., Vaidehi N., et al. 2006. Modeling the human PTC bitter-taste receptor interactions with bitter tastants. J. Mol. Model. 12, 931–941 [DOI] [PubMed] [Google Scholar]
- Floriano W.B., Vaidehi N., Zamanakos G., and Goddard W.A., 3rd., 2004. HierVLS hierarchical docking protocol for virtual ligand screening of large-molecule databases. J. Med. Chem. 47, 56–71 [DOI] [PubMed] [Google Scholar]
- Fountain S.J., and North R.A.2006. A C-terminal lysine that controls human P2X4 receptor desensitization. J. Biol. Chem. 281, 15044–15049 [DOI] [PubMed] [Google Scholar]
- Gerek Z.N., Kumar S., and Ozkan S.B.2013. Structural dynamics flexibility informs function and evolution at a proteome scale. Evol. Appl. 6, 423–433 [DOI] [PMC free article] [PubMed] [Google Scholar]
- Gilbertson T.A., Damak S., and Margolskee R.F.2000. The molecular physiology of taste transduction. Curr. Opin. Neurobiol. 10, 519–527 [DOI] [PubMed] [Google Scholar]
- Greene T.A., Alarcon S., Thomas A., et al. 2011. Probenecid inhibits the human bitter taste receptor TAS2R16 and suppresses bitter perception of salicin. Plos One 6, e20123. [DOI] [PMC free article] [PubMed] [Google Scholar]
- Isberg V., Vroling B., van der Kant R., et al. , 2014. GPCRDB: an information system for G protein-coupled receptors. Nucleic Acids Res. 42, D422–D425 [DOI] [PMC free article] [PubMed] [Google Scholar]
- Kellogg E.H., Leaver-Fay A., and Baker D.2011. Role of conformational sampling in computing mutation-induced changes in protein structure and stability. Proteins 79, 830–838 [DOI] [PMC free article] [PubMed] [Google Scholar]
- Kinnamon S.C., and Cummings T.A.1992. Chemosensory transduction mechanisms in taste. Annu. Rev. Physiol. 54, 715–731 [DOI] [PubMed] [Google Scholar]
- Klabunde T., and Hessler G.2002. Drug design strategies for targeting G-protein-coupled receptors. Chembiochem 3, 929–944 [DOI] [PubMed] [Google Scholar]
- Krieger E., Darden T., Nabuurs S.B., et al. 2004. Making optimal use of empirical energy functions: Force-field parameterization in crystal space. Proteins. 57, 678–683 [DOI] [PubMed] [Google Scholar]
- Lagerstrom M.C., and Schioth H.B.2008. Structural diversity of G protein-coupled receptors and significance for drug discovery. Nat. Rev. Drug Discov. 7, 339–357 [DOI] [PubMed] [Google Scholar]
- Laskowski R.A., Moss D.S., and Thornton J.M.1993. Main-chain bond lengths and bond angles in protein structures. J. Mol. Biol. 231, 1049–1067 [DOI] [PubMed] [Google Scholar]
- Li Y.Z., Wen Z.N., Xiao J.M., et al. 2011. Predicting disease-associated substitution of a single amino acid by analyzing residue interactions. BMC Bioinformatics 12, 14. [DOI] [PMC free article] [PubMed] [Google Scholar]
- Lindemann B.2001. Receptors and transduction in taste. Nature 413, 219–225 [DOI] [PubMed] [Google Scholar]
- Martin A.J.M., Vidotto M., Boscariol F., et al. 2011. RING: networking interacting residues, evolutionary information and energetics in protein structures. Bioinformatics 27, 2003–2005 [DOI] [PubMed] [Google Scholar]
- Masso M., and Vaisman I.I.2008. Accurate prediction of stability changes in protein mutants by combining machine learning with structure based computational mutagenesis. Bioinformatics 24, 2002–2009 [DOI] [PubMed] [Google Scholar]
- Molecular Operating Environment (MOE), 2013.08; Chemical Computing Group Inc., 1010 Sherbrooke St. West, Suite #910, Montreal, QC, Canada, H3A 2R7, 2014
- Hammer Ø., Harper D.A.T., and Ryan P.D.2001. PAST: paleontological statistics software package for education and data analysis. Palaeontologia Electronica 4, 9pp [Google Scholar]
- Potapov V., Cohen M., and Schreiber G.2009. Assessing computational methods for predicting protein stability upon mutation: good on average but not in the details. Protein Eng. Des. Select. 22, 553–560 [DOI] [PubMed] [Google Scholar]
- Pronin A.N., Tang H.X., Connor J., and Keung W.2004. Identification of ligands for two human bitter T2R receptors. Chem. Senses 29, 583–593 [DOI] [PubMed] [Google Scholar]
- Ramjan Z.H., Raheja A., and Floriano W.B.2008. A cluster-aware graphical user interface for a virtual ligand screening tool. 30th Annual International Conference of the IEEE Engineering in Medicine and Biology Society, Vols. 1–8, pp. 4102–4105 [DOI] [PubMed] [Google Scholar]
- Sakurai T., Misaka T., Ishiguro M., et al. 2010. Characterization of the beta-D-glucopyranoside binding site of the human bitter taste receptor hTAS2R16. J. Biol. Chem. 285, 28373–28378 [DOI] [PMC free article] [PubMed] [Google Scholar]
- Sen S., Jaakola V.P., Pirila P., et al. 2005. Functional studies with membrane-bound and detergent-solubilized alpha(2)-adrenergic receptors expressed in Sf9 cells. Biochim. Biophys. Acta Biomembr. 1712, 62–70 [DOI] [PubMed] [Google Scholar]
- Serrano-Vega M.J., Magnani F., Shibata Y., and Tate C.G.2008. Conformational thermostabilization of the beta1-adrenergic receptor in a detergent-resistant form. Proc. Natl. Acad. Sci. USA 105, 877–882 [DOI] [PMC free article] [PubMed] [Google Scholar]
- Strader C.D., Fong T.M., Tota M.R., et al. 1994. Structure and function of G-protein-coupled receptors. Annu. Rev. Biochem. 63, 101–132 [DOI] [PubMed] [Google Scholar]
- Thompson J.D., Gibson T.J., and Higgins D.G.2002. Multiple sequence alignment using ClustalW and ClustalX. Curr. Protoc. Bioinform. Chapter 2, Unit 23 [DOI] [PubMed] [Google Scholar]
- Vroling B., Sanders M., Baakman C., et al. 2011. GPCRDB: information system for G protein-coupled receptors. Nucleic Acids Res. 39, D309–D319 [DOI] [PMC free article] [PubMed] [Google Scholar]
- Wang M.J., Zhao X.M., Takemoto K., et al. 2012. FunSAV: predicting the functional effect of single amino acid variants using a two-stage Random Forest model. Plos One 7, e43847. [DOI] [PMC free article] [PubMed] [Google Scholar]
- Wieland K., Zuurmond H.M., Krasel C., et al. 1996a. Involvement of Asn-293 in stereospecific agonist recognition and in activation of the beta 2-adrenergic receptor. Proc. Natl. Acad. Sci. USA 93, 9276–9281 [DOI] [PMC free article] [PubMed] [Google Scholar]
- Wieland K., Zuurmond H.M., Krasel C., et al. 1996b. Involvement of Asn-293 in stereospecific agonist recognition and in activation of the beta(2)-adrenergic receptor. Proc. Natl. Acad. Sci. USA 93, 9276–9281 [DOI] [PMC free article] [PubMed] [Google Scholar]
- Yamada S., and Yamamoto K.2006. Ligand recognition by vitamin D receptor: total alanine scanning mutational analysis of the residues lining the ligand binding pocket of vitamin D receptor. Curr. Top. Med. Chem. 6, 1255–1265 [DOI] [PubMed] [Google Scholar]
- Yamamoto K., Abe D., Yoshimoto N., et al. 2006. Vitamin D receptor: ligand recognition and allosteric network. J. Med. Chem. 49, 1313–1324 [DOI] [PubMed] [Google Scholar]
- Yang Y., Chen B., Tan G., et al. 2013. Structure-based prediction of the effects of a missense variant on protein stability. Amino Acids 44, 847–855 [DOI] [PubMed] [Google Scholar]
- Yue P., Li Z., and Moult J.2005. Loss of protein structure stability as a major causative factor in monogenic disease. J. Mol. Biol. 353, 459–473 [DOI] [PubMed] [Google Scholar]
- Zhen L., Yu L., and Dinauer M.C.1998. Probing the role of the carboxyl terminus of the gp91phox subunit of neutrophil flavocytochrome b558 using site-directed mutagenesis. J. Biol. Chem. 273, 6575–6581 [DOI] [PubMed] [Google Scholar]
- Zuker C.S., Chandrashekar J., Mueller K.L., et al. 2000. T2Rs function as bitter taste receptors. Cell 100, 703–711 [DOI] [PubMed] [Google Scholar]
- Zuker C.S., Mueller K.L., Hoon M.A., et al. 2005. The receptors and coding logic for bitter taste. Nature 434, 225–229 [DOI] [PubMed] [Google Scholar]