

Abstract
Embryonic stem cells (ESCs) self-renew in a state of naïve pluripotency in which they are competent to generate all somatic cells1. It has been hypothesized that, before irreversibly committing, ESCs pass through at least one metastable transition state2-4. This transition would represent a gateway for differentiation and reprogramming of somatic cells5,6. We sought a mechanical phenotype of transition by probing the nuclear response to compressive and tensile forces and found that, during transition, nuclei of ESCs are auxetic: they displayed a cross-sectional expansion when stretched and a cross-sectional contraction when compressed, and their stiffness increased under compression. We show that the auxetic phenotype of transition ESC nuclei is driven at least in part by global chromatin decondensation. Through the regulation of molecular turnover in the differentiating nucleus by external forces, auxeticity could be a key element in mechanotransduction. Our findings highlight the importance of nuclear structure in the regulation of differentiation and reprogramming.
Understanding the trajectory between naïve pluripotency and lineage restriction has been a holy grail of ESC research, much of it focusing on defining a transcriptional and epigenetic ESC ‘state space’7-9. It is widely believed that there must be a fulcrum of “precarious balance”2 – a hypothetical transitional pluripotent state which is metastable in nature – from which ESCs have a choice to return to a naïve pluripotent state or irreversibly prime for differentiation. If a clear definition of the transition could be established, this could be used as a gateway to control differentiation and reprogramming.
In order to construct a definition of a naïve pluripotency (N), transition (T), and differentiation priming (P) in mouse ESCs, we used a Rex1GFPd2 reporter10 (Fig. 1a and S1). Rex1 is a specific marker for pluripotency, and its downregulation accompanies irreversible exit from pluripotency in ESCs11. Naïve pluripotency is maintained by 2i medium supplemented with Leukemia inhibitory factor (LIF)12; replacing this medium by N2B27 medium initiates ESC differentiation (Methods). We defined ESCs to be in transition (T-ESCs) when they reach a time point after which Rex1 expression is prone to change. Using a culturing procedure (Methods) we identified this time point to be 24 hours (Fig. S1). Although they have not downregulated Rex1, T-ESCs at this time point have downregulated the pluripotency factor Nanog (Fig. S2), but can be returned to N-ESCs in 2i+LIF medium for an indefinitely self-renewing ESC culture (data not shown, personal communication with Austin Smith). ESCs cultured in N2B27 after 24 hours and before 48 hours are expressing Rex1 heterogeneously (Fig. S1). P-cells, which we obtained after 48 hours in N2B27 medium, have entirely downregulated Rex1 and cannot generally be reverted to N-ESCs without reprogramming; P-cells are nonetheless distinct from lineage restricted cells (data not shown, personal communication with Austin Smith). With these defined N-ESCs, T-ESCs, and P-cells, we explored the mechanical properties of differentiating ESCs.
Fig. 1. Atomic force microscopy measurements of ESCs.
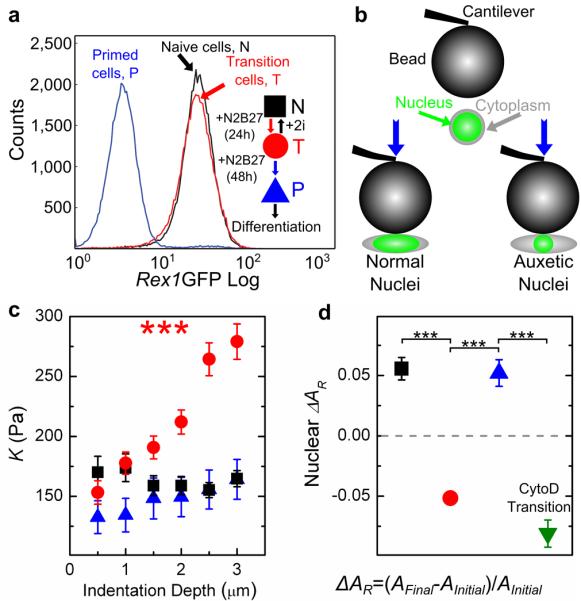
(a) Rex1-GFP profiles of ESCs at different stages during differentiation, and a schematic demonstrating the culturing protocol to define the ESC states (inset). (b) Cartoon depicting the applied compressive load and the cell response for different cell types (not to scale, bead is ~37 μm while average cell size is ~13 μm). Both cytoplasm and nuclear deformation are measured by cross-sectional area. (c) K measured at different indentation depths δ for N-ESCs, T-ESCs, and P-cells. While K of N-ESCs and P-cells remains constant, K of T-ESCs significantly increases with indentation depth. The numbers of independent experiments and measured cells, (M,m), are (3,56), (3,56) and (1,21), respectively. (d) Relative change in the nuclear cross-sectional area upon compressing N-ESCs, T-ESCs, P-cells and Cytochalasin D-treated T-ESCs by 2 μm. (M,m) are (3,98), (3,117), (3,53) and (2,32), respectively. The dashed line denotes a cross-sectional area change of zero. Materials below this line, including T- and CytoD-treated T-nuclei, are auxetic. *** indicates P < 1E-5 by a 1-way ANOVA test, and error bars are standard error of the mean, in all the text and figure captions unless otherwise noted.
We used atomic force microscopy (AFM, CellHesion 200, JPK Instruments AG) to measure the apparent reduced modulus K = E / (1-ν2) of the cells13,14 (Fig. 1b, Supplemental Methods). K is related to two standard material properties, the Young’s modulus E, which is a measure of elastic uniaxial stiffness (the larger E the stiffer the material), and the Poisson’s ratio ν, which relates the change in length of a material that is subject to a force to the accompanying change in its cross-section. Poisson’s ratio is the negative ratio of transverse and longitudinal normalized deformation. Almost all common materials become thinner when stretched and therefore have a positive Poisson’s ratio.
At low indentation depths (δ ≤ 1 μm), K was similar in all cell groups (average values of 130 Pa < K < 180 Pa). While K of N-ESCs and P-cells did not change at larger indentations (δ up to 3 μm), surprisingly K of T-ESCs significantly increased with increasing compression (Fig. 1c; PN = 0.69, PP = 0.71, PT = 5.5E-16, 1-way ANOVA). As the cell sizes of N- and T-ESCs were nearly identical (Fig. S3), this stiffening was not attributable to a substrate effect that would emerge as a consequence of a decreased cell height15.
Because in all investigated cell populations the nucleus takes up a large part of the cell volume, and because nuclei contribute significantly to cell stiffness14 we investigated how nuclear deformation is involved in the cellular response to the applied stress. Cells were labelled with Syto13 (Invitrogen), a nucleic acid dye suitable for live cells, and imaged during AFM measurements using epifluorescence microscopy (Fig. 1b). The signal intensity of Syto13 is 3-4 times higher in the nucleus than in the cytoplasm; we used this contrast for reliable discernment between the two (Supplementary Information and Fig. S4). The cytoplasm of all investigated cell types, as well as the nuclei of N-ESCs and P-cells, and lineage restricted extraembryonic (XEN) cells, significantly increased in cross-sectional area by ~5-10% upon compression by 2 μm with the AFM probe, as expected (Fig. 1d and S5). Remarkably, however, the nuclei of T-ESCs became smaller by ~5-10 % in cross-sectional area upon compression (Fig. 1d), which implied that the T nuclei have a negative Poisson’s ratio, i.e., they are auxetic. The stiffening of T-ESCs with increasing compression described above is also a signature of auxetic materials, because auxetic materials become denser with compression16. The nucleus of T-ESCs remained auxetic even after a 10 minute treatment with 1 μM of the actin-depolymerizing drug Cytochalasin D (CytoD, Supplementary Information and Fig. 1d). These AFM studies thus strongly imply that the T-nuclei, in contrast to the N- and P-nuclei, are auxetic, and this auxeticity exists independent of the actin cytoskeleton.
To further demonstrate the auxeticity of nuclei of T-ESCs with higher throughput, and under tension as opposed to compression, we developed an optofluidic assay. This assay allowed us to confine single ESCs in a microchannel (see Figs. 2a-d, Figs. S6 and S7, Video S1). We recorded fluorescence microscopy videos of cells stained with Syto13 passing through the channels (video S2) and used images of the same cell before entering the channel, during translocation, and after exiting the channel (Fig. 2b-d) for deformation analysis. Ellipses were fitted to the cell and the nucleus, yielding axial and transverse strain, SA and ST, respectively (Fig. 2e). These quantities were utilized to measure changes in cell and nuclear morphology of N- and T-ESCs, P-, XEN, HL60 and HeLa cells (Supplementary Information) as well. In this assay, nuclear deformation is largely driven by two components. First, nuclei larger than the channel width directly experience a transverse compression, an effect that should become increasingly insignificant for nuclei smaller than the channel width. In addition, all nuclei experience stretching stresses caused by cytoskeletal strain when the cell is confined in the channel.
Fig. 2. Optofluidic assay.

(a) ESCs are detached from culture plate, resuspended as single cells and loaded in the inlet of the microfluidic chip. The applied pressure gradient powers the transport of single cells from the inlet to the outlet. The inlet and outlet reservoirs are connected via channels smaller than the average cell size; therefore, cells must squeeze through the channels. Single cells collected from the outlet form colonies of fully functioning ESCs. Scale bars: 10 and 50 μm for single cells and colonies respectively. (b)-(d) Three consecutive epi-fluorescence snapshots of a Syto13-labelled cell translocating the channel from the inlet to the outlet under an applied pressure of 10 mbar. The detected fluorescence signal allows the simultaneous measurement of both cell and nuclear deformation. Scale bars: 25 μm. (e) Schematic of nuclear shape whilst the cell is the inlet (left) and in the channel (right). We quantify nuclear deformation by using the transverse, ST, and axial strains, SA, where a (b) and a’ (b’) are the nuclear transverse (axial) extents in the inlet and in the channel, respectively. (f)-(i) Scatter plots correlating the transverse nuclear strain ST in the channel to the initial nuclear minor axis for N-ESCs (squares), T-ESCs (circles), P-cells (upward triangles), lineage restricted HL60 cells (diamonds) and T-ESCs treated with Cytochalasin D (downward triangles). M= 3, 3, 2, 1 and 2, respectively. A negative (positive) strain denotes a decrease (increase) of the nuclear transverse extent while the cell squeezes through the channel. The horizontal lines denotes a nuclear ST of zero, while the vertical line is the population median for each data set used to separate the population of each class of cells in small and large nuclei categories. Small T-ESC nuclei show a markedly different behavior from all other investigated cell types: their ST increases above 0, indicative of auxeticity.
Despite their similar size (Fig. S3), T-ESCs translocated the channels faster than N- and P-ESCs (Fig. S8), suggesting a higher overall deformability in T-ESCs when stretched. We found no significant differences in overall cell deformation in the channels across cell types, though there was an overall loss of volume (as extrapolated from cross-section, assuming spheroidal cells) in all cells (Fig. S9), which was observed in previous reports17. Nuclear deformation in the channel, however, strongly depended on the ESC stage. The axial elongation SA was largest for T-ESCs compared to other cell types (Fig. S10). Moreover, when their nucleus was smaller than the channel width, and compressive stresses from the channel thus became less significant, ST in T-nuclei – in contrast to N- and P-nuclei – was positive (Fig. 2g and Fig. S10).
Our nuclear strain analysis (Fig. 2 f-i) is further evidence of the auxeticity of the T-nucleus for the following reasons. Nuclear deformation depends partly on the channel geometry, with a shift between positive and negative ST occurring in T-ESCs at an initial nuclear minor axis of ~9 μm. Given the channel size of 11 μm and that cytoplasm is surrounding the nucleus, this shift is likely due to the fact that larger nuclei start to experience more direct compression by the imposed geometric constraints. To further investigate this phenomenon, we distinguished between small and large nuclei by the median of the nuclear size data (dashed blue line in Fig. 2f-i, using the short axis of the ellipse as the size). We predicted the following two possible strain responses based on considerations of elastic materials (Fig. 3a). First, in non-auxetic materials, all nuclei should have a negative ST. Additionally, smaller nuclei will experience an axial stretch but a smaller transverse compression than the larger nuclei; therefore, the larger nuclei should possess a larger SA than the smaller nuclei. Second, in auxetic materials, since the effects of compression and stretch would tend to counteract each other, the larger nuclei should possess a smaller SA than the smaller nuclei. Furthermore, ST should be positive for smaller nuclei and negative for larger nuclei.
Fig. 3. Normal and auxetic nuclei.

(a) Depiction of stresses (arrows in the second column) acting on small and large nuclei as defined in Fig.s 2f-i (small and large black circles, respectively) for cells untreated and treated with Cytochalasin D. Size of arrows indicates relative force. The normal and auxetic nucleus response is depicted in the third and fourth column, respectively, where the red shapes representing the deformed nuclei, are overlapped with the original nuclear shape (black circle). (b) Correlation between transverse and axial nuclear strain for normal and auxetic nuclei. The dotted arrows are guides for the eye denoting the trend from small to large nuclei (small and large symbols, respectively). Designation of small and large nuclei is determined from the cut-off shown in Fig. 2(f)-(i). N- and P- (inset) nuclei (squares and upward triangles, respectively) present a “normal” response: upon increasing the nuclear size (from small to large symbol) the nuclear ST becomes more negative while the nuclear SA increases. This is qualitatively in agreement with simple biaxial compression models (dashed dotted line, for information about models see Supplemental Information). T-nuclei (circles) clearly exhibit an auxetic behavior: upon increasing the nuclear size the nuclear ST changes sign from positive for small nuclei to negative for large nuclei, whilst the ratio of SA for small to large nuclei is nearly 2. SA presents the same trend in T nuclei treated with Cytochalasin D (olive triangles). Error bars are reported in Fig. S10. (c)-(d) Bright field and epifluorescence images of a T-ESC after fluorescein incubation, imaged through a 60× objective (NA = 1.4). Scale bar: 5 μm. (e)-(h) Epifluorescence images and corresponding gray value profiles (measured along the dashed line) of a T-ESC loaded with fluorescein before and upon entering the microfluidic channel, respectively. The apparent signal is higher in the center of the cell where this is thicker. Ratio between the profile standard deviations σ (i) and kurtosis k (j) (inside/outside channel) for naïve (black) and transition (red) cells (cf Fig. S15). (M,m) are (3,270) and (3,317), respectively. Scale bars: 5 μm. The decrease in σ and increase in k for small T-ESCs suggest that fluorophores are driven towards the center of the stretched cells, i.e. the nuclear signal increases at the expense of the signal from the cytoplasm.
The first prediction was true for the N- and P-nuclei, as well as for the HL60, XEN, and HeLa nuclei (Figs. S10 and S11). In contrast, the second prediction was true for T-nuclei: the larger T-nuclei experienced less SA than the smaller T-nuclei, and the smaller T-nuclei had a positive ST (Fig. S10).
To test whether the expansion during stretching in the T-nuclei was caused by tensile forces arising from the actin cytoskeleton, we used the CytoD treatment described above on T-ESCs (Supplementary Information). SA in the nuclei diminished by over 50%, and the positive ST observed in the smaller nuclei of the untreated T-ESCs largely disappeared (Fig. 2i and S10). This confirms that the transverse expansion seen in untreated T-nuclei is caused by the cytoskeletal stretch. The fact that CytoD-treated small T-nuclei exhibited negative transverse strain can be explained by a change in the balance between compression from the channel walls and reduced tension transmitted through the perturbed actin cytoskeleton; the induced cross-sectional contraction of the compressed auxetic nucleus here overwhelms the (reduced) stretch transmitted through the cytoskeleton. These nuclei are thus still auxetic, and accordingly after treatment the larger nuclei experienced smaller SA than the smaller nuclei (Fig. S10).
We summarized the results in Fig. 3. After separating the large and small nuclei of each cell group by median size (as in Fig. 2f-i) we plot ST vs. SA. For materials with a positive Poisson’s ratio experiencing a biaxial compression or uniaxial stretch, there would be a negative slope going from small to large nuclei (see Supplementary Information). This negative slope was observed in N, P, HL60, XEN, and HeLa cells and nuclei; however, the exact opposite trend was observed for T-nuclei (CytoD treated and untreated, Figs. 3b and S11), but not the cells themselves (data not shown), a further indication of the T-nuclei’s auxetic behavior. Therefore, we defined the auxetic phenotype seen in T-nuclei as shown in Fig. 3b: at a population level, the nuclear ST and SA are larger in smaller nuclei than they are in larger nuclei.
Auxeticity has profound volume implications: stretched auxetic materials will experience a significant volume expansion. We first verified the volume changes that would be intrinsic to an auxetic nucleus with confocal microscopy of Syto 13-labeled cells (Fig. S12) and a Hoechst-based assay (Fig. S13). Furthermore, the dramatic nuclear volume changes arising from stretch of the nucleus would imply a concomitant flow of fluid and small molecules into the nucleus. To show this, we loaded both N- and T-ESCs with fluorescein. In relaxed cells, the dye was significantly more concentrated in the cytoplasm, indicating that there is more available space in the cytoplasm than in the nucleus through which the molecules can freely diffuse (Fig. 3c and 3d). In auxetic materials, the volume and with it the porosity18 (or void fraction, i.e., the available space) should increase upon stretch (cf. Fig. S14), and the otherwise more densely packed nucleus should provide a largely enhanced space into which small molecules can diffuse. Indeed, we found a strong increase in the nuclear signal at the expense of signal from the cytoplasm in the T-ESCs, but not in the N-ESCs. To quantify this, we extracted a profile of the fluorescence intensity before the cell entered the channel and inside the channel (Fig. 3e-h). We then inferred 3 quantities from each intensity profile: the axial length of the cell s, the standard deviation σ of the profile, and its kurtosis k, defined as the fourth moment of the distribution normalised by σ4. Qualitatively, kurtosis characterises the flatness of a distribution: the lower the kurtosis, the flatter and less peaked the distribution, and in case of these experiments the more equally distributed the dye. If fluorophores move into the nucleus and thus towards the center of a cell, we expect that σ will decrease, and that k will increase, as explained in Fig. S15. Accordingly, σ increased in the channel in small N-ESCs but decreased in small T-ESCs, while k showed the opposite trend (Fig. 3i and j), which strongly suggests that fluorophores are driven towards the center of small T-ESCs when stretched, but not in small N-ESCs. This also suggests that fluorophores enter the cell nucleus while its volume increases upon deformation, indicating a possible function for auxeticity: external stresses in the developing embryo could thus drive an increase in molecular turnover in the nucleus of stretched T-ESCs during differentiation.
To address possible mechanisms for the auxeticity we investigated chromatin condensation states, and, given recent reports about their importance for mechanosensing19, nuclear lamins. Lamin A/C expression was low to undetectable, and we did not observe any consistent change in the expression of Lmna or Lmnb1 by qPCR (Fig. S2) or immunofluorescence (data not shown) across the ESC groups, though the nuclear envelope of the T-nuclei was significantly less wrinkled than the N- and P-nuclei (Figs. 4a-b; S16). Electron microscopy images showed considerable differences in global chromatin condensation levels between the three states. A quantitative analysis revealed that the T-nuclei are significantly less condensed than the N- and P-nuclei (Fig. 4c). To further investigate the role of chromatin decondensation in nuclear auxecity, we treated N-ESCs with 300nM of Trichostatin A (TSA), an HDAC inhibitor that globally decondenses chromatin. TSA treatment caused the cells to become auxetic: as in the T-ESCs, the apparent reduced modulus K of TSA treated N-ESCs significantly increased with increasing indentation δ (Fig. 4d), the nuclear cross-sectional area shrank under compression with AFM (Fig. 4e and Fig. S5), and it increased under stretch in the microfluidic assay (Fig. 4f and Fig. S10). Therefore, chromatin condensation states likely play a significant role in causing the auxetic phenotype.
Fig. 4. Auxeticity and chromatin condensation states.

Representative electron microscopy images of (a) N-ESCs and (b) T-ESCs, suggesting a less densely packed nucleus in T-ESCs. Scale bars: 3 μm. (c) Corresponding measurements of the ratio between low frequencies νL (corresponding to wavelengths λ>80nm) and high frequencies νH (corresponding to wavelengths 10<λ <100nm) calculated from the 2-D Fourier spectrum (see Supplementary information). The ratio is significantly lower for T– compared to N- and P nuclei, indicating that chromatin is less densely packed (more uniform) in T-nuclei. m= 23, 23 and 24, respectively. (d) K measured at different indentation depths δ for N (black squares, reprinted from Fig. 1c) and Trichostatin A (TSA) treated N-ESCs (red circles). (M, m) are (3,56) and (3,64). TSA treatment leads to chromatin decondensation, and to an increase of K with δ, as it is expected for auxetic materials. (e) Relative change in the nuclear cross-sectional area upon compressing N-ESCs and TSA treated N-ESCs with AFM. (M, m) are (3,98) and (2,63), respectively. The dashed line denotes a cross-sectional area change of zero. Materials below this line are auxetic. (f) Scatter plot correlating the transverse nuclear strain ST in the channel to the initial nuclear minor axis for N-ESCs and TSA treated N-ESCs. M=2 and 4, respectively. Overall, these data imply the involvement of chromatin decondensation in the auxetic phenotype of transition ESC nuclei.
The present study provides evidence that transition embryonic stem cells can be distinguished by an auxetic nucleus. Auxetics are rare materials widely studied in physical and materials sciences16; this study presents an extraordinary example of auxeticity in a living material. Auxeticity is a biophysical phenotype, which, like cell and nuclear mechanics, could be important for cell movement in tissue20 and for modulating the sensitivity of ESCs to physical cues21-24. Furthermore, it has been observed that nuclear mechanics and structure are significant for ESCs: nuclei of ESCs stiffen upon differentiation25 and show significant global condensation of chromatin26. There is also evidence that the nucleus undergoes dynamic structural and mechanical changes during the process of differentiation and downstream lineage specification27,28. Importantly, the T-ESC exists in a state of heightened chromatin decondensation (indicated from electron microscopy in the current study and reference27). Indeed, nuclei of T-ESCs as well as nuclei of N-ESCs with pharmacologically induced decondensed chromatin are auxetic. Furthermore, the strong increase in K under increasing compression found in both T and TSA-treated N-ESCs is a signature of an auxetic material.
In addition to establishing a transition phenotype, there are other significant implications of the observed auxeticity. First, auxeticity is a consequence of architecture: it imposes structural rules on the comprising substructures of a material29. The findings presented in this paper can guide investigations of the superstructure of the nucleus and interactions between its comprising substructures. Second, auxeticity in the nucleus – given that it leads to stiffening of materials under compression (c.f. Fig. 1c) – could play a crucial role in tissue organization, particularly since transition cells have been observed in the early embryo30. Cells of the early embryo have large nuclear to cytoplasmic ratios31; therefore, auxeticity could lead to active alteration of the mechanical properties of these cells under stress, thereby affecting their ability to reorganize in tissue. This could dramatically impact the physically driven formation of the pluripotent epiblast32.
Ultimately, nuclear auxeticity could be crucially involved in the conversion of mechanical stimuli into a cellular response, i.e., in mechanotransduction. External stresses could change the volume of T-nuclei, and thus the space available in the nucleus for small molecules such as signaling molecules and transcription factors. T-nuclei exposed to tension, for example, would increase in volume, which could lead to more space for molecules that trigger differentiation, while, at the same time, cells of the same population but in other parts of the tissue could be compressed, leaving less space for molecules, and thus assume a different fate. Alternatively, the physical properties of T-nuclei in a dynamically remodeling tissue could enhance differentiative capacity by acting as stress-driven auxetic pumps to increase molecular turnover.
Methods
Cell culture
The Rex1GFPd2 ESCs used in the current study10 were used between passage 15 and passage 25, and were cultured on 0.1% gelatin at all times in 2i medium, described in12, which is N2B27 medium (Invitrogen) supplemented with MEK inhibitor (1 μM PD0325901) and GSK3 inhibitor (3 μM CHIR99021) plus Leukemia inhibitory factor (LIF). For priming/differentiation protocol, ESCs were passaged and seeded directly into N2B27 medium at a concentration of 4E5 cells/mL. The GFP signal was regularly analysed by flow cytometry using a CyAn ADP analyser (Beckman Coulter, Brea, CA, USA) to monitor Rex1 expression in the cells, and we titrated the time point of 24h after seeding in N2B27 to be T ESCs, and 48h after seeding in N2B27 to be P ESCs (Fig. 1a and Fig. S1).
Cell preparation
For microfluidics experiments, cells were incubated at 37° C with 1 μM Syto13 (Invitrogen) for 20 minutes, and were detached from tissue plastic with Accutase (for ESCs) and Trypsin for XEN and HeLa cells (HL60s are a suspended cell line), and then centrifuged and resuspended in PBS. The cells were then filtered with 20 μm filters (Partec, Munster, Germany) to remove aggregates.
For imaging experiments, cells were allowed to settle on glass dishes while they were incubated with 1 μM Syto13 for 20 minutes. For AFM experiments, cells were passaged three hours prior to experiments to ensure the ability to measure single cells, and were incubated with 1 μM Syto13 for 20 minutes prior to measurement. For all experiments, the time between the cells being taken out of incubation and measured was less than 20 minutes.
Atomic force microscopy
Monodisperse polystyrene beads (diameter 37.28 +/− 0.34 μm, microParticles GmbH, Berlin, Germany) were glued to tipless silicon cantilevers (Arrow-TL1, spring constant ~0.02 N/m; NanoWorld, Neuchatel, Switzerland). Cantilevers were mounted on a JPK CellHesion 200 AFM (JPK Instruments AG, Berlin, Germany), which was set up on an inverted optical microscope (Zeiss Axio Observer A1, Zeiss, Germany). Cantilever spring constants were determined via the thermal noise method included in the AFM software. See Supplementary Information for further details.
Microfluidic assay
The microfabrication of the fluidic chip relies on multilevel photolithography and replica molding. For the fabrication of the mold, a layer of SU-8 2005 (Microchem, Erlenbach, Switzerland) was deposited via spin coating (1000 rpm for 30 s) on a silicon wafer and exposed to UV light (1 s, 365-405 nm, 52 mW/cm2) through a quartz mask (Photodata Ltd, Hitchin, UK) patterned with an array of wires with two different widths, 10 μm and 12 μm. After development, a layer of SU-8 2015 (Microchem) was deposited by spin coating (2000 rpm for 30 s). A second mask patterned with two symmetrical reservoir chambers separated by a 50 μm gap and ending with two 1 mm-side circular pads was aligned relatively to the sample through a MJB4 mask aligner (Karl Suss, Garching, Germany) in a way that positioned the central region of the wires under the 50 μm-gap on the mask. The sample was exposed for 4 s and developed. The thickness of the obtained wires was 10 μm while the one of the reservoir was 20 μm as measured by a Dektak stylus profilometer (Veeco, Plainview, NY). Replica molding of the device is realized by casting on it a 9: 1 (base:curing agent) polydimethylsiloxane (PDMS) mixture and in situ curing at 60° C for 60 min in oven. PDMS is bonded to a glass slide by exposing both surfaces to oxygen plasma treatment (8.5 s exposure to 2.5 W plasma power, Plasma etcher, Diener, Royal Oak, MI) thus improving adhesion quality and hydrophilicity. The device is completed by the integration of PEEK tubing connected to a computerized pressure-based flow control system (MFCS-4C, Fluigent, Paris, France) that allows to regulate the flow in the microfluidic chip. This multi-layer device allows us to achieve – in a single chip – accurate screening and high throughput. Indeed thanks to the fact that the reservoirs have dimension larger than the cell size by applying a pressure gradient we can deliver cells with a high throughput to the channel region. Here, given that the channel’s cross sectional area is smaller than the typical cell dimension (although larger than the typical nucleus), the cells must squeeze through the channels. The resulting slow translocation time (from hundreds of microseconds to a few seconds) enables single cell measurements.
Supplementary Material
Acknowledgements
This work was supported by the Royal Society, UK Medical Research Council and Wellcome Trust (G.W., C.L.F., and K.J.C.), a European Research Council starting grant (S.P. and U.F.K.), a Human Frontier in Science grant (R.J.M.F and C.R.M.), a Leverhulme and Newton Trust early career fellowship (S.P.) and the UK Medical Research Council (Career Development Award to K.F.). We also thank T. Kalkan for providing cells and guidance, E.K. Paluch for critical reading of the manuscript, A.E.X. Brown for helpful discussions, A. Ekpenyong for experimental support, and A. Smith for providing significant intellectual support for this work.
Footnotes
Additional information
Supplementary information is available in the online version of the paper.
Competing financial interests
The authors declare no competing financial interests.
References
- 1.Silva J, Smith A. Capturing pluripotency. Cell. 2008;132:532–536. doi: 10.1016/j.cell.2008.02.006. [DOI] [PMC free article] [PubMed] [Google Scholar]
- 2.Loh KM, Lim B. A precarious balance: pluripotency factors as lineage specifiers. Cell Stem Cell. 2011;8:363–369. doi: 10.1016/j.stem.2011.03.013. [DOI] [PubMed] [Google Scholar]
- 3.Smith A. Pluripotent stem cells: private obsession and public expectation. EMBO Mol Med. 2010;2:113–116. doi: 10.1002/emmm.201000065. [DOI] [PMC free article] [PubMed] [Google Scholar]
- 4.Betschinger J, et al. Exit from pluripotency is gated by intracellular redistribution of the bHLH transcription factor Tfe3. Cell. 2013;153:335–347. doi: 10.1016/j.cell.2013.03.012. [DOI] [PMC free article] [PubMed] [Google Scholar]
- 5.Hanna J, et al. Human embryonic stem cells with biological and epigenetic characteristics similar to those of mouse ESCs. Proc Natl Acad Sci U S A. 2010;107:9222–9227. doi: 10.1073/pnas.1004584107. [DOI] [PMC free article] [PubMed] [Google Scholar]
- 6.Fisher CL, Fisher AG. Chromatin states in pluripotent, differentiated, and reprogrammed cells. Curr Opin Genet Dev. 2011;21:140–146. doi: 10.1016/j.gde.2011.01.015. [DOI] [PubMed] [Google Scholar]
- 7.Nichols J, Smith A. Naive and primed pluripotent states. Cell Stem Cell. 2009;4:487–492. doi: 10.1016/j.stem.2009.05.015. [DOI] [PubMed] [Google Scholar]
- 8.Young RA. Control of the embryonic stem cell state. Cell. 2011;144:940–954. doi: 10.1016/j.cell.2011.01.032. [DOI] [PMC free article] [PubMed] [Google Scholar]
- 9.Marks H, et al. The transcriptional and epigenomic foundations of ground state pluripotency. Cell. 2012;149:590–604. doi: 10.1016/j.cell.2012.03.026. [DOI] [PMC free article] [PubMed] [Google Scholar]
- 10.Wray J, et al. Inhibition of glycogen synthase kinase-3 alleviates Tcf3 repression of the pluripotency network and increases embryonic stem cell resistance to differentiation. Nat Cell Biol. 2011;13:838–845. doi: 10.1038/ncb2267. [DOI] [PMC free article] [PubMed] [Google Scholar]
- 11.Toyooka Y, Shimosato D, Murakami K, Takahashi K, Niwa H. Identification and characterization of subpopulations in undifferentiated ES cell culture. Development. 2008;135:909–918. doi: 10.1242/dev.017400. [DOI] [PubMed] [Google Scholar]
- 12.Ying QL, et al. The ground state of embryonic stem cell self-renewal. Nature. 2008;453:519–523. doi: 10.1038/nature06968. [DOI] [PMC free article] [PubMed] [Google Scholar]
- 13.Franze K. Atomic force microscopy and its contribution to understanding the development of the nervous system. Curr Opin Genet Dev. 2011;21:530–537. doi: 10.1016/j.gde.2011.07.001. [DOI] [PubMed] [Google Scholar]
- 14.Lu YB, et al. Viscoelastic properties of individual glial cells and neurons in the CNS. Proc Natl Acad Sci U S A. 2006;103:17759–17764. doi: 10.1073/pnas.0606150103. [DOI] [PMC free article] [PubMed] [Google Scholar]
- 15.Mahaffy RE, Park S, Gerde E, Kas J, Shih CK. Quantitative analysis of the viscoelastic properties of thin regions of fibroblasts using atomic force microscopy. Biophys J. 2004;86:1777–1793. doi: 10.1016/S0006-3495(04)74245-9. [DOI] [PMC free article] [PubMed] [Google Scholar]
- 16.Evans KE, Alderson A. Auxetic materials: Functional materials and structures from lateral thinking! Adv Mater. 2000;12:617–+. [Google Scholar]
- 17.Trickey WR, Baaijens FP, Laursen TA, Alexopoulos LG, Guilak F. Determination of the Poisson’s ratio of the cell: recovery properties of chondrocytes after release from complete micropipette aspiration. J Biomech. 2006;39:78–87. doi: 10.1016/j.jbiomech.2004.11.006. [DOI] [PubMed] [Google Scholar]
- 18.Moeendarbary E, et al. The cytoplasm of living cells behaves as a poroelastic material. Nat Mater. 2013;12:253–261. doi: 10.1038/nmat3517. [DOI] [PMC free article] [PubMed] [Google Scholar]
- 19.Swift J, et al. Nuclear lamin-A scales with tissue stiffness and enhances matrix-directed differentiation. Science. 2013;341:1240104. doi: 10.1126/science.1240104. [DOI] [PMC free article] [PubMed] [Google Scholar]
- 20.Rowat AC, et al. Nuclear envelope composition determines the ability of neutrophil-type cells to passage through micron-scale constrictions. J Biol Chem. 2013 doi: 10.1074/jbc.M112.441535. [DOI] [PMC free article] [PubMed] [Google Scholar]
- 21.Booth-Gauthier EA, Alcoser TA, Yang G, Dahl KN. Force-induced changes in subnuclear movement and rheology. Biophys J. 2012;103:2423–2431. doi: 10.1016/j.bpj.2012.10.039. [DOI] [PMC free article] [PubMed] [Google Scholar]
- 22.Chowdhury F, et al. Material properties of the cell dictate stress-induced spreading and differentiation in embryonic stem cells. Nat Mater. 2010;9:82–88. doi: 10.1038/nmat2563. [DOI] [PMC free article] [PubMed] [Google Scholar]
- 23.Dahl KN, Ribeiro AJS, Lammerding J. Nuclear shape, mechanics, and mechanotransduction. Circ Res. 2008;102:1307–1318. doi: 10.1161/CIRCRESAHA.108.173989. [DOI] [PMC free article] [PubMed] [Google Scholar]
- 24.Mazumder A, Roopa T, Basu A, Mahadevan L, Shivashankar GV. Dynamics of chromatin decondensation reveals the structural integrity of a mechanically prestressed nucleus. Biophys J. 2008;95:3028–3035. doi: 10.1529/biophysj.108.132274. [DOI] [PMC free article] [PubMed] [Google Scholar]
- 25.Pajerowski JD, Dahl KN, Zhong FL, Sammak PJ, Discher DE. Physical plasticity of the nucleus in stem cell differentiation. Proc Natl Acad Sci U S A. 2007;104:15619–15624. doi: 10.1073/pnas.0702576104. [DOI] [PMC free article] [PubMed] [Google Scholar]
- 26.Meshorer E, et al. Hyperdynamic plasticity of chromatin proteins in pluripotent embryonic stem cells. Dev Cell. 2006;10:105–116. doi: 10.1016/j.devcel.2005.10.017. [DOI] [PMC free article] [PubMed] [Google Scholar]
- 27.Chalut KJ, et al. Chromatin decondensation and nuclear softening accompany nanog downregulation in embryonic stem cells. Biophys J. 2012;103:2060–2070. doi: 10.1016/j.bpj.2012.10.015. [DOI] [PMC free article] [PubMed] [Google Scholar]
- 28.Masui O, et al. Live-Cell Chromosome Dynamics and Outcome of X Chromosome Pairing Events during ES Cell Differentiation. Cell. 2011;145:447–458. doi: 10.1016/j.cell.2011.03.032. [DOI] [PMC free article] [PubMed] [Google Scholar]
- 29.Blumenfeld R, Edwards SF. Theory of Strains in Auxetic Materials. J Supercond Nov Magn. 2012;25:565–571. [Google Scholar]
- 30.Nichols J, Silva J, Roode M, Smith A. Suppression of Erk signalling promotes ground state pluripotency in the mouse embryo. Development. 2009;136:3215–3222. doi: 10.1242/dev.038893. [DOI] [PMC free article] [PubMed] [Google Scholar]
- 31.Evans MJ, Kaufman MH. Establishment in culture of pluripotential cells from mouse embryos. Nature. 1981;292:154–156. doi: 10.1038/292154a0. [DOI] [PubMed] [Google Scholar]
- 32.Plusa B, Piliszek A, Frankenberg S, Artus J, Hadjantonakis AK. Distinct sequential cell behaviours direct primitive endoderm formation in the mouse blastocyst. Development. 2008;135:3081–3091. doi: 10.1242/dev.021519. [DOI] [PMC free article] [PubMed] [Google Scholar]
Associated Data
This section collects any data citations, data availability statements, or supplementary materials included in this article.