

Abstract
Objectives
This study examined the impact of the United Network for Organ Sharing (UNOS) policy changes for regional differences in waitlist time and mortality before and after heart transplantation.
Background
The 2006 UNOS thoracic organ allocation policy change was implemented to allow for greater regional sharing of organs for heart transplantation.
Methods
We analyzed 36,789 patients who were listed for heart transplantation from January 1999 through April 2012. These patients were separated into 2 eras centered on the July 12, 2006 UNOS policy change. Pre- and post-transplantation characteristics were compared by UNOS regions.
Results
Waitlist mortality decreased nationally (up to 180 days: 13.3% vs. 7.9% after the UNOS policy change, p < 0.001) and within each region. Similarly, 2-year post-transplant mortality decreased nationally (2-year mortality: 17.3% vs. 14.6%; p < 0.001) as well as regionally. Waitlist time for UNOS status 1A and 1B candidates increased nationally 17.8 days on average (p < 0.001) with variability between the regions. The greatest increases were in Region 9 (59.2-day increase, p < 0.001) and Region 4 (41.2-day increase, p < 0.001). Although the use of mechanical circulatory support increased nearly 2.3-fold nationally in Era 2, significant differences were present on a regional basis. In Regions 6, 7, and 10, nearly 40% of those transplanted required left ventricular assist device bridging, whereas only 19.6%, 22.3%, and 15.5% required a left ventricular assist device in regions 3, 4, and 5, respectively.
Conclusions
The 2006 UNOS policy change has resulted in significant regional heterogeneity with respect to waitlist time and reliance on mechanical circulatory support as a bridge to transplantation, although overall both waitlist mortality and post-transplant survival are improved.
Keywords: heart transplantation, United Network of Organ Sharing, ventricular assist device
Heart failure is a growing health problem affecting nearly 6 million in the United States (1), with approximately 200,000 patients having progressed to end-stage or Stage D (2). Heart transplantation (HTx) is the definitive therapy for end-stage heart failure patients with over 90% 1-year survival and median survival of 10 years. Moreover, 90% of HTx recipients have no limitation in activity to 5 years (3). This therapy is limited by a growing supply-demand mismatch; in 2012 1,968 HTx were performed nationwide, yet over 3,300 patients were on the wait list (4). The allocation of donor organs in the United States is regulated by United Network for Organ Sharing (UNOS). This allocation system is periodically updated to reflect changes in medical care. The UNOS criteria were last altered in 2006, whereby candidates within a transplant region served by a local organ procurement agency with 1A or 1B status are transplanted preferentially, followed by candidates with UNOS 1A or 1B designation in an adjoining 500-mile concentric circular zone. Before this change, organs were transplanted within a UNOS region in all status groups before being offered to adjoining regions. This policy change was initiated to allow greater regional sharing of organs and to decrease waitlist mortality. In 2012, Singh et al. (5) reported the success of this policy change, demonstrating a 17% decline in waitlist mortality. Despite this national success, the 2006 policy change has been suggested to have a variable regional impact (6). Furthermore, the growing role of mechanical circulatory support (MCS) for patients waiting for HTx as a bridge-to-transplantation (BTT) has had an impact on the survival of patients on the waitlist and after HTx (7,8).
Our current analysis aimed to evaluate for geographic discrepancies resulting from the 2006 policy change. We studied national and regional differences in waitlist and post-transplantation mortality as well as changes in national and regional waitlist time in the UNOS regions before and after the 2006 allocation change.
Methods
We analyzed 36,789 patients who were listed for HTx from January 1999 through April 2012. The candidates for re-transplantation or multi-organ transplantation were excluded from this study. These patients were separated into 2 eras centered on the July 12, 2006 UNOS policy change, with further stratification by UNOS region.
Study population and design
Data were obtained from UNOS for all adults (>18 years of age) listed for HTx from January 20, 1999 to April 30, 2012. The data listed in the Organ Procurement and Transplant Network database include data with regard to time on the waitlist and patient information at time of listing and transplant. The patients were separated into 2 eras centered on the July 12, 2006 policy change: Era 1 representing the pre-policy change era (January 20, 1999 to July 11, 2006); and Era 2 (July 12, 2006 to April 30, 2012). Patients were included in the era in which they were initially listed, regardless of when they were ultimately transplanted (intention-to-treat principle). Additionally, patients were further separated and analyzed by the UNOS region where they were listed. The primary endpoint was waitlist mortality and delisting due to being too sick to transplant. Secondary outcomes included: post-transplant mortality up to 2 years for those ultimately transplanted; waitlist time; use of MCS including left ventricular assist devices (LVADs); and ischemic time.
Statistical analysis
Continuous data are presented as mean ± SD, and normality was evaluated for each variable on the basis of normal distribution plots and histograms and by the Kolmogorov-Smirnov test. Student unpaired t test and 1-way analysis of variance were used to compare the variables among the groups. Categorical variables were summarized as frequencies and percents and were compared with the Pearson chi-square test or Fisher exact test. A p value <0.05 was considered statistically significant. For the evaluation of risk in the period preceding HTx, death and delisting for worsening clinical status on waitlist were censored, and the cumulative incidence rate up to 180 days after listing was calculated and compared by log-rank test. Post-transplant survival up to 2 years was also compared with Kaplan-Meier survival curves and log-rank test between the 2 eras. All statistical analyses were performed with SPSS software (version 20.0, SPSS, Chicago, Illinois).
Results
Baseline characteristics
In Era 1, 20,292 patients were listed for HTx with 13,252 of those successfully transplanted, whereas in Era 2, 16,497 patients were listed with 10,139 of those ultimately transplanted. There were baseline differences in patients listed in Era 2 compared with those in Era 1, but few were of clinical significance. Some notable differences included a 4% increase in prevalence of diabetes in those listed for HTx and a significant increase in the use of LVADs at the time of listing for HTx (both p < 0.001). The baseline patient demographic data are listed in Table 1.
Table 1. Baseline Patient Characteristics Compared Between the 2 Eras at Listing.
| Era 1 (n = 20,292) | Era 2 (n = 16,497) | p Value | |
|---|---|---|---|
| Age, yrs | 51.1 ± 12.1 | 51.8 ± 12.7 | <0.001 |
|
| |||
| Male | 15,399 (75.9) | 12,328 (74.7) | 0.010 |
|
| |||
| BMI, kg/m2 | 26.8 ± 10.9 | 27.0 ± 5.9 | 0.079 |
|
| |||
| Race | <0.001 | ||
| White | 15,233 (75.1) | 11,263 (68.3) | |
| Black | 3,110 (15.3) | 3,410 (20.7) | |
| Hispanic | 1,345 (6.6) | 1,231 (7.5) | |
| Asian | 394 (1.9) | 422 (2.6) | |
| Other | 210 (1.1) | 171 (0.9) | |
|
| |||
| Blood type | 0.164 | ||
| A | 8,075 (39.8) | 6,389 (38.7) | |
| B | 2,594 (12.8) | 2,167 (13.1) | |
| AB | 844 (4.2) | 724 (4.4) | |
| O | 8,779 (43.2) | 7,217 (43.8) | |
|
| |||
| Etiology of heart failure* | <0.001 | ||
| Ischemic | 6,068 (45.8) | 3,870 (38.0) | |
| Nonischemic | 5,660 (42.7) | 4,987 (49.0) | |
| Hypertrophic | 234 (1.8) | 202 (2.0) | |
| Congenital | 344 (2.6) | 235 (2.3) | |
| Other | 946 (7.1) | 880 (8.7) | |
|
| |||
| Laboratory data | |||
| Creatinine (mg/dl) | 1.42 ± 0.97 | 1.43 ± 1.04 | 0.301 |
| Albumin (g/dl) | 3.64 ± 0.78 | 3.66 ± 0.71 | 0.037 |
|
| |||
| UNOS status at listing | <0.001 | ||
| 1A | 4,040 (19.9) | 3,344 (20.0) | 0.395 |
| 1B | 5,211 (25.7) | 6,252 (37.5) | <0.001 |
| 2 | 10,624 (52.4) | 6,383 (38.2) | <0.001 |
|
| |||
| LVAD support | |||
| At listing | 610 (3.7) | 2,523 (15.3) | <0.001 |
| During waiting period | 391 (1.9) | 1,815 (11.0) | <0.001 |
|
| |||
| Comorbidities† | |||
| Diabetes mellitus | 4,896 (24.2) | 4,673 (28.4) | <0.001 |
| Cerebrovascular disease | 766 (3.9) | 282 (4.2) | 0.278 |
| Peripheral vascular disease | 707 (3.6) | 30 (3.8) | 0.839 |
| Hypertension | 7,946 (40.0) | 338 (42.6) | 0.279 |
Values are mean ± SD or n(%).
7,040 patients in Era 1 and 6,323 patients in Era 2 with unclassified etiology of heart failure were excluded from the analysis.
Data not obtained from all patients, n (%) indicating the numbers (percents) of patients on the basis of the available data.
BMI = body mass index; LVAD = left ventricular assist device; UNOS = United Network for Organ Sharing.
Waitlist time, mortality, and delisting
We calculated the average wait time for HTx of patients who were ultimately transplanted and compared the time between 2 eras and among each region. Nationally there was a trend for decreased waitlist time in the post-policy change era. Examining combined UNOS Status 1A and 1B time, the average wait time increased 17.8 days (61.7 ± 106.6 days to 79.6 ± 123.5 days, p < 0.001) (Table 2), and Status 1A waitlist time across all regions increased from 1 day to 29.6 days on average. However, the increase was not uniform, with Regions 1 and 9 having disproportionate increases. As seen in Table 2, Region 1 patients experienced an approximately 30-day increase (20.1 ± 34.6 days to 49.7 ± 59.1 days, p < 0.001) to an average Status 1A waiting time of 50 days. Similarly, Status 1A time in Region 9 increased 65% to 35 days in Era 2 (21.0 ± 34.4 days to 34.7 ± 59.4 days, p < 0.001). This is matched by markedly lower wait time in Regions 2 (14.8 ± 28.7 days to 16.8 ± 33.7 days, p = 0.064), 8 (7.8 ± 19.5 days to 8.2 ± 16.7 days, p = 0.657), and 10 (12.7 ± 24.1 days to 13.7 ± 21.1 days, p = 0.308). Similarly, waitlist time for Status 1B patients increased in Era 2 when compared with Era 1, as demonstrated in Table 2 and Online Table 1.
Table 2. Time Spent Awaiting Heart Transplantation.
| Region Era 1/Era 2 |
Status 1A | p Value | Status 1B | p Value | Status 2 | p Value | |||
|---|---|---|---|---|---|---|---|---|---|
|
|
|
|
|||||||
| Era 1 | Era 2 | Era 1 | Era 2 | Era 1 | Era 2 | ||||
| Region 1 (495/427) | 20.1 ± 34.6 | 49.7 ± 59.1 | <0.001 | 67.5 ± 133.5 | 63.7 ± 109.7 | 0.639 | 126.6 ± 266.6 | 63.1 ± 171.2 | <0.001 |
| Region 2 (1,668/1,475) | 14.8 ± 28.7 | 16.8 ± 33.7 | 0.066 | 59.6 ± 96.5 | 65.5 ± 115.1 | 0.119 | 89.0 ± 209.6 | 32.8 ± 103.2 | <0.001 |
| Region 3 (1658/1,273) | 9.0 ± 19.4 | 16.0 ± 29.7 | <0.001 | 52.5 ± 104.3 | 61.2 ± 103.1 | 0.024 | 117.8 ± 241.9 | 32.0 ± 100.4 | <0.001 |
| Region 4 (1,360/964) | 8.6 ± 19.5 | 16.7 ± 34.2 | <0.001 | 49.9 ± 95.4 | 83.1 ± 132.0 | <0.001 | 108.3 ± 217.6 | 51.2 ± 145.9 | <0.001 |
| Region 5 (1,974/1,567) | 8.4 ± 20.4 | 12.2 ± 27.8 | <0.001 | 23.5 ± 66.5 | 21.6 ± 54.9 | 0.353 | 151.1 ± 293.4 | 49.0 ± 133.4 | <0.001 |
| Region 6 (435/278) | 7.9 ± 26.3 | 19.2 ± 39.7 | <0.001 | 41.7 ± 80.1 | 66.4 ± 94.2 | <0.001 | 132.9 ± 307.6 | 47.2 ± 140.8 | <0.001 |
| Region 7 (1,218/939) | 9.7 ± 21.9 | 21.6 ± 41.1 | <0.001 | 55.3 ± 101.6 | 73.2 ± 119.0 | <0.001 | 125.9 ± 233.6 | 58.7 ± 145.2 | <0.001 |
| Region 8 (623/616) | 7.7 ± 19.5 | 8.2 ± 16.7 | 0.657 | 54.3 ± 101.0 | 50.7 ± 97.9 | 0.523 | 122.9 ± 260.2 | 63.6 ± 163.1 | <0.001 |
| Region 9 (985/638) | 21.0 ± 34.4 | 34.6 ± 59.4 | <0.001 | 63.8 ± 110.1 | 109.3 ± 156.7 | <0.001 | 119.9 ± 334.6 | 32.3 ± 106.9 | <0.001 |
| Region 10 (1,302/833) | 12.7 ± 24.1 | 13.7 ± 21.1 | 0.308 | 50.8 ± 88.2 | 56.2 ± 100.6 | 0.205 | 102.2 ± 232.3 | 52.8 ± 141.2 | <0.001 |
| Region 11 (1,534/1,129) | 10.9 ± 24.1 | 18.1 ± 35.2 | <0.001 | 54.2 ± 98.6 | 61.1 ± 100.7 | 0.076 | 101.6 ± 231.5 | 54.9 ± 140.5 | <0.001 |
| All (13,252/10,139) | 11.4 ± 24.7 | 18.4 ± 36.6 | <0.001 | 50.2 ± 96.8 | 61.1 ± 109.5 | <0.001 | 116.7 ± 254.2 | 47.0 ± 132.6 | <0.001 |
|
| |||||||||
|
Region (Era 1/Era 2) |
Status 1A/1B | p value | Whole Waiting time | p value | |||||
|
|
|
||||||||
| Era 1 | Era 2 | Era 1 | Era 2 | ||||||
|
| |||||||||
| Region 1 (495/427) | 87.6 ± 152.1 | 113.4 ± 137.0 | 0.007 | 251.7 ± 420.2 | 194.3 ± 232.1 | 0.009 | |||
| Region 2 (1,668/1,475) | 74.3 ± 108.6 | 82.3 ± 128.0 | 0.060 | 190.5 ± 307.9 | 131.0 ± 185.9 | <0.001 | |||
| Region 3 (1,658/1,273) | 61.5 ± 110.2 | 77.2 ± 112.2 | <0.001 | 194.0 ± 300.1 | 126.9 ± 174.6 | <0.001 | |||
| Region 4 (1,360/964) | 58.6 ± 103.8 | 99.8 ± 139.5 | <0.001 | 192.1 ± 305.2 | 169.4 ± 226.8 | 0.040 | |||
| Region 5 (1,974/1,567) | 31.9 ± 71.8 | 33.8 ± 64.4 | 0.411 | 213.8 ± 383.2 | 99.3 ± 168.6 | <0.001 | |||
| Region 6 (435/278) | 49.6 ± 90.1 | 85.6 ± 115.8 | <0.001 | 206.8 ± 365.3 | 156.3 ± 202.7 | 0.018 | |||
| Region 7 (1,218/939) | 65.0 ± 109.2 | 94.7 ± 132.5 | <0.001 | 213.7 ± 296.0 | 176.8 ± 217.2 | 0.001 | |||
| Region 8 (623/616) | 62.0 ± 110.6 | 58.9 ± 101.7 | 0.601 | 208.5 ± 336.8 | 143.6 ± 206.3 | <0.001 | |||
| Region 9 (985/638) | 84.8 ± 125.0 | 144.0 ± 186.4 | <0.001 | 220.8 ± 417.9 | 185.6 ± 237.7 | 0.031 | |||
| Region 10 (1,302/833) | 63.4 ± 97.5 | 69.8 ± 107.1 | 0.163 | 178.6 ± 269.3 | 156.5 ± 211.8 | 0.035 | |||
| Region 11 (1,534/1,129) | 65.1 ± 108.9 | 79.2 ± 117.5 | 0.001 | 179.6 ± 283.5 | 144.9 ± 204.1 | <0.001 | |||
| All (13,252/10,139) | 61.7 ± 106.6 | 79.5 ± 123.5 | <0.001 | 200.2 ± 329.6 | 144.7 ± 202.7 | <0.001 | |||
Values are days, unless otherwise indicated. Time spent (days) receiving heart transplantation: whole waiting time; and the time as United Network for Organ Sharing listing each status between the 2 eras (Era 1: January 20, 1999 to July 11, 2006; Era 2: July 12, 2006 to April 30, 2012).
When compared with those in Era 1, patients in Era 2 had a decreased cumulative incidence rate of the primary endpoint (mortality and/or removal due to progressive disease while on the waitlist). Nationally there was a 3.7% decrease in the composite event rate (15.3% vs. 11.6%, p < 0.001), as seen in Figure 1. Regionally this improvement was consistently seen, with statistically significant decreases seen in all regions except 1, 5, 6, and 8, where there was only a trend toward decreased event rate (Figs. 2 and 3).
Figure 1. Comparison of 180-Day Waitlist Prognosis.
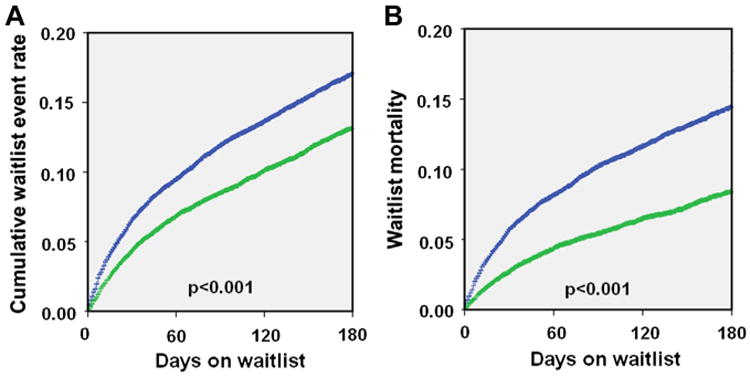
(A) Comparison of the cumulative event rate including death and delisting (15.3% vs. 11.6%, p < 0.001) between the 2 eras. (B) Mortality while being listed (13.3% vs. 7.9%, p < 0.001) in the 2 eras. Blue = Era 1 (January 20, 1999 to July 11, 2006); green = Era 2 (July 12, 2006 to April 30, 2012).
Figure 2. Regional Differences in Waitlist Prognosis: Death and Delisting.
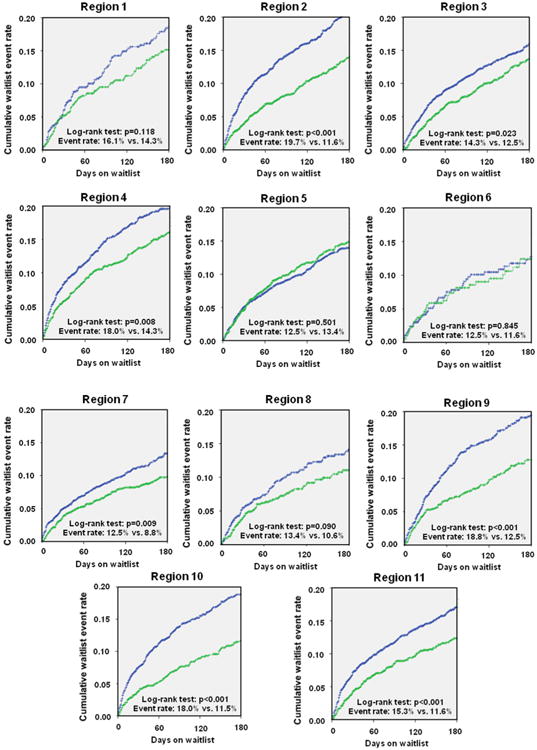
The comparison of regional differences chows a uniform trend toward better prognosis of patients listed for heart transplantation. Blue = Era 1 (January 20, 1999 to July 11, 2006); green = Era 2 (July 12, 2006 to April 30, 2012).
Figure 3. Percentage of Cumulative Waiting Time in Each UNOS Category.
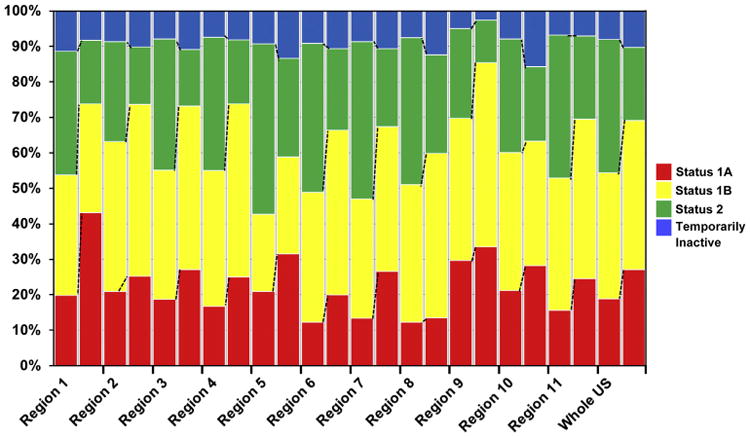
The analysis revealed a uniform trend toward an increased time listed as United Network for Organ Sharing (UNOS) status 1A and 1B during the time waiting for heart transplantation. Total waiting time equals 100%. Left bar = Era 1 (January 20, 1999 to July 11, 2006); right bar = Era 2 (July 12, 2006 to April 30, 2012).
UNOS listing status at transplantation
At the time of transplant, patients in Era 2 were in higher clinical severity and need, because Status 1A patients represent 52.0% of transplants in Era 2 (vs. 35.8%, p < 0.001), with a range from 36.3% in Region 6 to 78.8% in Region 1. By contrast, the proportion of patients in UNOS status 1B was almost stable or slightly decreased in all regions between the 2 eras, despite a higher use of MCS. Furthermore, the proportion of Status 2 patients transplanted decreased from 25.3% to 9% (p < 0.001) nationally, with regional variation ranging from 3.1% in Region 9 to 17.6% in Region 5 (Fig. 4, Online Table 2).
Figure 4. UNOS Listing Status at Time of Transplantation.
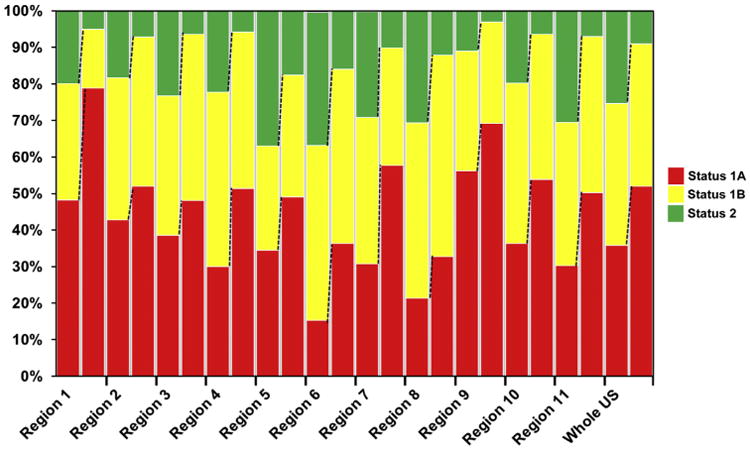
The analysis revealed a uniform trend toward a lower percent of United Network for Organ Sharing (UNOS) status 2 patients and increased proportion of patients at UNOS status 1A and 1B at the time of heart transplantation. Left bar = Era 1 (January 20, 1999 to July 11, 2006); right bar = Era 2 (July 12, 2006 to April 30, 2012).
Mechanical circulatory support
The use of MCS of every type (LVAD, right ventricular assist device, total artificial heart, and bi-ventricular assist device) increased in every region in Era 2 compared with Era 1 except right ventricular assist device. The LVADs represent most MCS and have seen the largest increase between the eras, overall from 11.1% to 26.6% at the time of HTx (Table 3).
Table 3. Use of MCS While Listed for HTx Compared Between the 2 Eras.
| Region Era 1/Era 2 (n) |
LVAD at HTx | p Value | RVAD at HTx | p Value | BiVAD at HTx | p Value | |||
|---|---|---|---|---|---|---|---|---|---|
|
|
|
|
|||||||
| Era 1 | Era 2 | Era 1 | Era 2 | Era 1 | Era 2 | ||||
| Region 1 (316/427) | 18.4% (58) | 30.9% (132) | <0.001 | 0.6% (2) | 0.0% (0) | 0.100 | 6.6% (21) | 7.0% (30) | 0.839 |
| Region 2 (1,077/1,475) | 14.1% (152) | 24.0% (354) | <0.001 | 0.7% (8) | 0.5% (8) | 0.526 | 2.7% (29) | 3.4% (50) | 0.315 |
| Region 3 (1,010/1,273) | 6.8% (69) | 19.6% (250) | <0.001 | 0.1% (1) | 0.1% (1) | 0.870 | 2.0% (20) | 1.5% (19) | 0.372 |
| Region 4 (819/964) | 6.6% (54) | 22.3% (215) | <0.001 | 0.2% (2) | 0.0% (0) | 0.125 | 1.2% (10) | 0.7% (7) | 0.284 |
| Region 5 (1,264/1,567) | 4.4% (56) | 15.5% (243) | <0.001 | 0.3% (4) | 0.3% (4) | 0.760 | 2.5% (31) | 6.5% (102) | <0.001 |
| Region 6 (284/278) | 13.0% (37) | 46.8% (130) | <0.001 | 0.0% (0) | 0.7% (2) | 0.152 | 3.5% (10) | 2.9% (8) | 0.665 |
| Region 7 (860/939) | 14.1% (121) | 43.2% (406) | <0.001 | 0.1% (1) | 0.2% (2) | 0.616 | 1.6% (14) | 2.8% (26) | 0.101 |
| Region 8 (406/616) | 12.3% (50) | 24.2% (149) | <0.001 | 0.0% (0) | 0.3% (2) | 0.250 | 0.5% (2) | 2.6% (16) | 0.012 |
| Region 9 (752/638) | 13.0% (98) | 33.5% (214) | <0.001 | 0.0% (0) | 0.5% (3) | 0.060 | 3.1% (23) | 6.3% (40) | 0.004 |
| Region 10 (845/832) | 16.2% (137) | 36.9% (307) | <0.001 | 0.5% (4) | 0.1% (1) | 0.184 | 1.5% (13) | 4.0% (33) | 0.002 |
| Region 11 (945/1,129) | 12.6% (119) | 26.3% (297) | <0.001 | 0.1% (1) | 0.2% (2) | 0.670 | 1.8% (17) | 2.5% (28) | 0.289 |
| All (8,578/10,138)* | 11.1% (951) | 26.6% (2697) | <0.001 | 0.3% (23) | 0.2% (25) | 0.771 | 2.2% (190) | 3.5% (359) | <0.001 |
|
| |||||||||
|
Region Era 1/Era 2 (n) |
TAH at HTx | p Value | MCS all at HTx | p Value | |||||
|
|
|
||||||||
| Era 1 | Era 2 | Era 1 | Era 2 | ||||||
|
| |||||||||
| Region 1 (316/427) | 0.0% (0) | 0.0% (0) | NA | 25.6% (81) | 37.9% (162) | <0.001 | |||
| Region 2 (1,077/1,475) | 0.0% (0) | 0.7% (10) | 0.007 | 17.5% (189) | 28.6% (422) | <0.001 | |||
| Region 3 (1,010/1,273) | 0.0% (0) | 0.0% (0) | NA | 8.9% (90) | 21.2% (270) | <0.001 | |||
| Region 4 (819/964) | 0.0% (0) | 0.5% (5) | 0.039 | 8.1% (66) | 23.5% (227) | <0.001 | |||
| Region 5 (1,264/1,567) | 0.7% (9) | 2.2% (35) | 0.001 | 7.9% (100) | 24.5% (384) | <0.001 | |||
| Region 6 (284/278) | 0.0% (0) | 0.0% (0) | NA | 16.5% (47) | 50.4% (140) | <0.001 | |||
| Region 7 (860/939) | 0.1% (1) | 0.3% (3) | 0.361 | 15.9% (137) | 46.4% (436) | <0.001 | |||
| Region 8 (406/616) | 0.0% (0) | 0.2% (1) | 0.417 | 12.8% (52) | 27.3% (168) | <0.001 | |||
| Region 9 (752/638) | 0.0% (0) | 0.2% (1) | 0.277 | 16.1% (121) | 40.4% (258) | <0.001 | |||
| Region 10 (845/832) | 0.5% (4) | 1.7% (14) | 0.016 | 18.7% (158) | 42.6% (355) | <0.001 | |||
| Region 11 (945/1,129) | 0.1% (1) | 4.1% (46) | <0.001 | 14.6% (138) | 33.0% (373) | <0.001 | |||
| All (8,578/10,139)* | 0.2% (15) | 1.1% (115) | <0.001 | 13.7% (1179) | 31.5% (3195) | <0.001 | |||
Use of mechanical circulatory support (MCS) while listed for heart transplantation (HTx) compared between the 2 eras (percent of patients and absolute numbers listed; Era 1: January 20, 1999 to July 11, 2006; Era 2: July 12, 2006 to April 30, 2012).
Data of 4,674 patients in Era 1 and that of 1 patient in Era 2 not obtained.
BiVAD = bi-ventricular assist device; LVAD = left ventricular assist device; RVAD = right ventricular assist device; TAH = total artificial heart.
The LVAD use at listing and the need to bridge with an LVAD while on the waitlist increased in all regions. In Era 2, 15.3% of patients had LVADs at the time of listing, almost a 5-fold increase from Era 1. There was no significant regional variation. In Era 1, LVAD use was fairly uniform, because the percent of BTT was 4.4% to 18.4%. As was the case with waitlist time, the increase in MCS was not regionally consistent. Regional variations were evident with profound increases in BTT in Regions 1, 6, 7, 9, 10, and 11 (33.0% to 50.4%), whereas in Regions 2, 3, 4, 5, and 8, the overall rate of BTT was less significant (21.2% to 28.6%).
Given the longer Status 1A wait times in Regions 1 and 9, HTx with the 30-day 1A grace period for mechanical device support is essentially not an option for these waitlist candidates, adding to the geographic discrepancies.
Ischemic time
Ischemic time during organ procurement has increased nationally on average approximately 6 min. The largest changes were seen in Regions 1 and 6, with over 30- and 25-min increases, respectively, with only Region 6 approaching 4 h of ischemic time (Online Table 3).
Post-transplant mortality
Improved post-transplant mortality up to 2 years in Era 2 was demonstrated nationally (2-year survival: 82.7% vs. 85.4%; p < 0.001) (Fig. 5). This improved mortality was consistently detected in our regional analysis with Regions 2, 4, 8, and 10 showing a statistically significant benefit, whereas all other regions showed a trend toward improved mortality (Figs. 6 and 7).
Figure 5. Comparison of Post-Transplant Mortality.
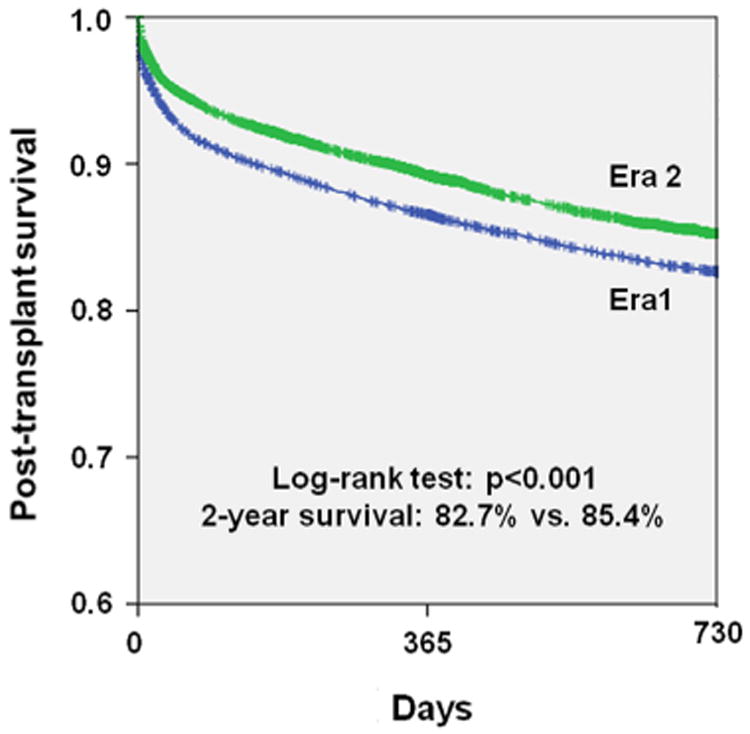
Analysis of outcomes after heart transplantation up to 2 years between the 2 eras. Blue = Era 1 (January 20, 1999 to July 11, 2006); green = Era 2 (July 12, 2006 to April 30, 2012).
Figure 6. Comparison of Post-Transplant Mortality.
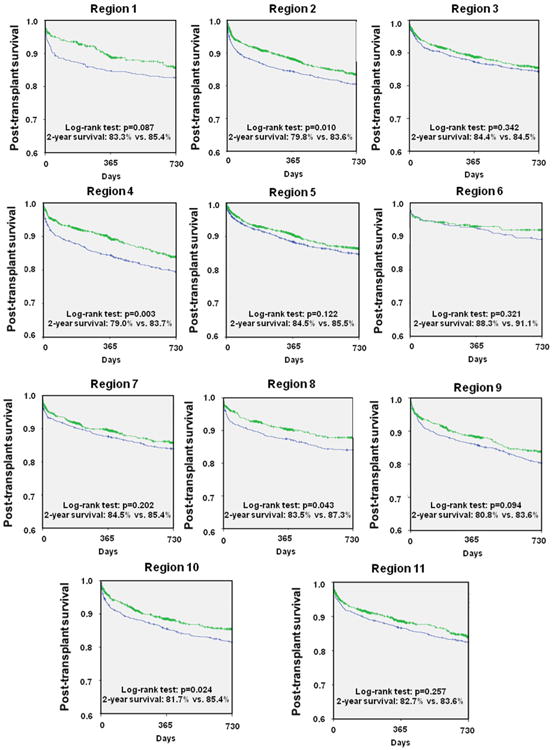
Survival after heart transplantation was analyzed after stratifying for United Network for Organ Sharing (UNOS) regions and compared between the 2 eras. Blue = Era 1 (January 20, 1999 to July 11, 2006); green = Era 2 (July 12, 2006 to April 30, 2012).
Figure 7. Comparison of Annualized Waiting Time to HTx, Waitlist Prognosis, and Transplant Rate.
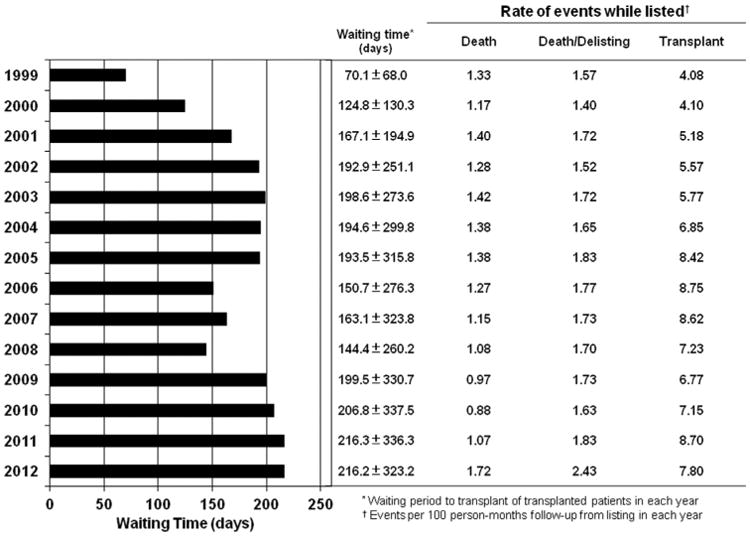
Annualized event rates were analyzed for the entire population of patients undergoing heart transplantation (HTx) showing a temporary response after the 2006 change in the United Network for Organ Sharing allocation rules that was not detectable in the current era. Event rates increased in the most recent era stepwise.
Discussion
The 2006 UNOS allocation policy change was implemented to achieve greater regional sharing so that those with the greatest medical necessity (Status 1A and 1B) would receive priority and thus decrease waitlist mortality as well as improve post-transplantation survival. Our analysis demonstrates that the policy change has achieved a decrease in both waitlist and post-transplantation mortality consistent with Singh et al. (5). However, there have been definite impacts of increase in waitlist time and use of MCS, which has had considerable regional variability. One of the core missions for UNOS was to establish an organ allocation system that was equitable across the country. Our analysis shows that significant regional differences in waitlist time, MCS usage, and post-HTx outcomes exist after the UNOS allocation policy change.
Nationally, the waitlist time increased uniformly for Status 1A and 1B patients. This increase was present in nearly all regions; however, some regions were disproportionately affected. In particular, Regions 1 and 9 had a 148% and 65% increase, respectively, in Status 1A wait time, and similarly, Regions 4 and 9 had 66% and 70% increases, respectively, in Status 1B waiting time. The increase in 1A waitlist time in these regions essentially negated the effectiveness of the 30-day 1A grace period for mechanical device patients in these regions. Waitlist time naturally will vary when analyzed by region, because there is significant regional heterogeneity with regard to the number of organ donations, yet variability in donation alone is not sufficient to account for the variation.
The national trend of increased use of MCS seen in our study has been previously described (7,9). Compared with Era 1, there has been nearly a 7-fold increase in LVAD use at the time of transplantation nationally such that at transplant nearly 1 in 3 has an LVAD. This likely is contributing to the decreased mortality on the waitlist, because patients can be clinically stabilized and end-organ damage can be prevented. National trends in increased use of MCS as BTT undoubtedly also reflect broader availability of these devices. Consistently, in a recent analysis of the current era of continuous flow LVADs, patients supported by MCS have waitlist outcomes commensurate with those listed as Status 2 (7). The study further demonstrated that those with device-related complications have outcomes analogous to Status 1B patients.
However, the increase in waitlist time results in a greater use of MCS in those regions with a disproportionate increase in waitlist time. In many transplant programs in regions with prolonged wait times (i.e., Regions 1 and 9), a blood type O UNOS 1B candidate is educated early about the probable need for device support, and frequently elective device surgery is scheduled (personal communication). Although post-transplantation survival might be comparable for patients with and without MCS support (10–12), MCS as BTT can be problematic due to alloimmunosensitization, increased primary graft failure, increased risk of infection, strokes and bleeding complications, peri-transplant complications, and costs (13,14). As of 2011, over 12% of HTx candidates have panel reactive antibody levels over 10% (3). This is problematic, because it necessitates a negative cross-match before HTx (unless a prospective crossmatch can be performed that allows donor-recipient matching in the presence of elevated panel reactive antibody levels), resulting in a restricted donor population, which will also increase waitlist times and time on device therapy. The economic impact of expanding MCS use is relevant in the current era of fiscal responsibility, and the cost-effectiveness of BTT has not been validated (15,16).
Although survival to transplant is high, the Interagency Registry for Mechanically Assisted Circulatory Support reports a 70% significant adverse event rate (infection, bleeding, stroke, malfunction, death) at 1 year post-implantation. As the waitlist time lengthens, the probability of device-bridged patients developing an adverse event increases and as such diminishes rather than enhances their condition for transplant. Dardas et al. (17) recently argued against the 30-day elective 1A time awarded to stable device candidates without complications as unnecessary, given a survival comparable to Status 2 patients. However, our experience in a region with a long waitlist time where the 30-day period is not an adequate duration to receive an appropriate donor (UNOS region 9) has unfortunately revealed a shift in MCS-bridged candidates toward recipients with increased risk profiles due to a significant proportion with device-related complications. Most studies to date show comparable survival of MCS-free and MCS-bridged patients after HTx (10–12), but the trend toward transplantation of high-risk candidates with device-related complications will potentially decrease the post-HTx survival in the future.
The major question resulting from our current analysis is how to eliminate the geographic variability we have observed. There might be a variety of approaches. First, the UNOS regions were constructed in the mid-1980s. As with congressional districts over time as fluxes in the population occur, boundaries are redrawn; second, in the present system, the activity of an adult transplant program is closely allied to the productivity of its local organ procurement agency. The performance of a local donor network should not be the primary driving force for the allocation of organs. How could this problem be reconciled? In pediatric heart allocation, there is only a concentric geographic zone allocation. This allocation scheme could provide an easily implemented solution for the adult patients as well. Third, in our rapidly evolving era of technology, it might be time once again to revise the allocation system. Both lung and liver transplant physicians have developed an objective score to better allocate organs, and the heart transplantation community should work to develop and implement a similar scoring system to support and standardize the allocation of donor hearts. Future options will include use of warm preservation systems that can significantly maintain the organ and allow longdistance procurements without time restrictions. Warm preservation devices are being tested but are not ready for general application.
Study limitations
We acknowledge that there are limitations to our study in that it is retrospective. The dataset from UNOS is high-quality in that for all U.S. transplant centers data submission is mandatory pursuant to the National Transplantation Act of 1984. These data are used for organ allocation; the data are nevertheless limited to what has been collected and reported. We excluded patients undergoing double organ transplantation. Importantly, we are unable to identify patients that have been “double listed” in different regions, thereby causing crossover. Furthermore, equitable access to HTx through access to HTx centers and listing practice patterns might be different in the various UNOS regions. Our analysis cannot reflect changes in center-specific HTx listing criteria, changes in medical management of advanced heart failure patients and changes in the management of organ donors.
Conclusions
Improvements in waitlist mortality and post-transplant mortality seen nationally since the 2006 policy change are consistent through each region. However, major regional differences exist in waitlist time and MCS use with potentially deleterious consequences as increased waitlist times and broader availability result in a greater reliance on MCS. Although MCS has been an enormously effective BTT strategy, increased waiting time and prolonged MCS use is associated with adverse events that can further prolong waitlist time with potentially deleterious effects significantly increasing post-transplantation mortality risk.
Supplementary Material
Acknowledgments
This work was supported by grants from the National Heart, Lung, and Blood Institute (K23 HL095742-01, P30 HL101272-01, UL1 RR 024156, HL073029; New York, New York) and the Herbert and Florence Irving Scholar Award to Dr. Schulze.
Abbreviations and Acronyms
- BTT
bridge-to-transplantation
- HTx
heart transplantation
- LVAD
left ventricular assist device
- MCS
mechanical circulatory support
- UNOS
United Network for Organ Sharing
Footnotes
All authors have reported that they have no relationships relevant to the contents of this paper to disclose
References
- 1.Go AS, Mozaffarian D, Roger VL, et al. Heart disease and stroke statistics—2013 update: a report from the American Heart Association. Circulation. 2013;127:e6–245. doi: 10.1161/CIR.0b013e31828124ad. [DOI] [PMC free article] [PubMed] [Google Scholar]
- 2.Ammar KA, Jacobsen SJ, Mahoney DW, et al. Prevalence and prognostic significance of heart failure stages: application of the American College of Cardiology/American Heart Association heart failure staging criteria in the community. Circulation. 2007;115:1563–70. doi: 10.1161/CIRCULATIONAHA.106.666818. [DOI] [PubMed] [Google Scholar]
- 3.Stehlik J, Edwards LB, Kucheryavaya AY, et al. The registry of the International Society for Heart and Lung Transplantation: 29th official adult heart transplant report—2012. J Heart Lung Transplant. 2012;31:1052–64. doi: 10.1016/j.healun.2012.08.002. [DOI] [PubMed] [Google Scholar]
- 4.OPTN data as of January 18, 2013. [Accessed January 23, 2013]; Available at: http://optn.transplant.hrsa.gov/latestData/advancedData.asp.
- 5.Singh TP, Almond CS, Taylor DO, Graham DA. Decline in heart transplant wait list mortality in the United States following broader regional sharing of donor hearts. Circ Heart Fail. 2012;5:249–58. doi: 10.1161/CIRCHEARTFAILURE.111.964247. [DOI] [PubMed] [Google Scholar]
- 6.Nativi JN, Kfoury AG, Myrick C, et al. Effects of the 2006 U.S. thoracic organ allocation change: analysis of local impact on organ procurement and heart transplantation. J Heart Lung Transplant. 2010;29:235–9. doi: 10.1016/j.healun.2009.05.036. [DOI] [PubMed] [Google Scholar]
- 7.Wever-Pinzon O, Drakos SG, Kfoury AG, et al. Morbidity and mortality in heart transplant candidates supported with mechanical circulatory support: is reappraisal of the current United network for organ sharing thoracic organ allocation policy justified? Circulation. 2013;127:452–62. doi: 10.1161/CIRCULATIONAHA.112.100123. [DOI] [PMC free article] [PubMed] [Google Scholar]
- 8.Kirklin JK, Naftel DC, Kormos RL, et al. Fifth INTERMACS annual report: risk factor analysis from more than 6,000 mechanical circulatory support patients. J Heart Lung Transplant. 2013;32:141–56. doi: 10.1016/j.healun.2012.12.004. [DOI] [PubMed] [Google Scholar]
- 9.Uriel N, Jorde UP, Woo Pak S, et al. Impact of long term left ventricular assist device therapy on donor allocation in cardiac transplantation. J Heart Lung Transplant. 2013;32:188–95. doi: 10.1016/j.healun.2012.11.010. [DOI] [PMC free article] [PubMed] [Google Scholar]
- 10.Kamdar F, John R, Eckman P, Colvin-Adams M, Shumway SJ, Liao K. Postcardiac transplant survival in the current era in patients receiving continuous-flow left ventricular assist devices. J Thorac Cardiovasc Surg. 2013;145:575–81. doi: 10.1016/j.jtcvs.2012.09.095. [DOI] [PubMed] [Google Scholar]
- 11.Russo MJ, Hong KN, Davies RR, et al. Posttransplant survival is not diminished in heart transplant recipients bridged with implantable left ventricular assist devices. J Thorac Cardiovasc Surg. 2009;138:1425–32. e1–3. doi: 10.1016/j.jtcvs.2009.07.034. [DOI] [PubMed] [Google Scholar]
- 12.Osaki S, Edwards NM, Johnson MR, et al. Improved survival after heart transplantation in patients with bridge to transplant in the recent era: a 17-year single-center experience. J Heart Lung Transplant. 2009;28:591–7. doi: 10.1016/j.healun.2009.03.008. [DOI] [PubMed] [Google Scholar]
- 13.Miller LW, Guglin M. Patient selection for ventricular assist devices: a moving target. J Am Coll Cardiol. 2013;61:1209–21. doi: 10.1016/j.jacc.2012.08.1029. [DOI] [PubMed] [Google Scholar]
- 14.Miller LW, Guglin M, Rogers J. Cost of ventricular assist devices: can we afford the progress? Circulation. 2013;127:743–8. doi: 10.1161/CIRCULATIONAHA.112.139824. [DOI] [PubMed] [Google Scholar]
- 15.Mulloy DP, Bhamidipati CM, Stone ML, Ailawadi G, Kron IL, Kern JA. Orthotopic heart transplant versus left ventricular assist device: a national comparison of cost and survival. J Thorac Cardiovasc Surg. 2013;145:566–73. doi: 10.1016/j.jtcvs.2012.10.034. discussion 573–4. [DOI] [PMC free article] [PubMed] [Google Scholar]
- 16.Moreno SG, Novielli N, Cooper NJ. Cost-effectiveness of the implantable HeartMate II left ventricular assist device for patients awaiting heart transplantation. J Heart Lung Transplant. 2012;31:450–8. doi: 10.1016/j.healun.2011.10.017. [DOI] [PubMed] [Google Scholar]
- 17.Dardas T, Mokadam NA, Pagani F, Aaronson K, Levy WC. Transplant registrants with implanted left ventricular assist devices have insufficient risk to justify elective organ procurement and transplantation network status 1A time. J Am Coll Cardiol. 2012;60:36–43. doi: 10.1016/j.jacc.2012.02.031. [DOI] [PubMed] [Google Scholar]
Associated Data
This section collects any data citations, data availability statements, or supplementary materials included in this article.