

Abstract
Characterizing brain changes in Alzheimer’s disease (AD) is important for patient prognosis, and for assessing brain deterioration in clinical trials. In this diffusion tensor imaging study, we used a new fiber-tract modeling method to investigate white matter integrity in 50 elderly controls (CTL), 113 people with mild cognitive impairment (MCI), and 37 AD patients. After clustering tractography using an ROI atlas, we used a shortest path graph search through each bundle’s fiber density map to derive maximum density paths (MDPs), which we registered across subjects. We calculated the fractional anisotropy (FA) and mean diffusivity (MD) along all MDPs and found significant MD and FA differences between AD patients and CTL subjects as well as MD differences between CTL and late MCI subjects. MD and FA were also associated with widely used clinical scores (MMSE). As an MDP is a compact, low-dimensional representation of white matter organization, we tested the utility of DTI measures along these MDPs as features for support vector machine (SVM) based classification of AD.
Keywords: ADNI, tractography, DTI, fiber tract modeling, white matter, connectivity, SVM, classification
1. Introduction
Alzheimer’s disease (AD) is the most common type of dementia, affecting around 1 in 8 people aged 65 or older in the U.S. alone (Alzheimer’s Association, 2011). AD is characterized by cortical and hippocampal neuronal loss and widespread gray matter atrophy, but there is also a progressive disconnection of cortical and subcortical regions due to white matter (WM) injury (Delbeuck et al., 2003). Changes in WM neuropathology include partial loss of axons and myelin sheaths (Brun and Englund, 1986; Sjobeck et al., 2005). AD patients s how significant WM atrophy (Hua et al., 2008, 2010; Migliaccio et al., 2012), as well as a gradual decrease in the integrity of WM commissures such as the corpus callosum, and key pathways such as the cingulum and superior longitudinal fasciculus (Rose et al., 2000; Medina et al., 2006; Stebbins and Murphy, 2009; Liu et al., 2011).
In addition to the more widely used measures from anatomical MRI, FDG- and amyloid- PET, and CSF based measures of pathology, the second phase of the Alzheimer’s Disease Neuroimaging Initiative (ADNI-2) includes additional neuroimaging measures including diffusion tensor imaging (DTI) in a subset of the imaged population. By tracking the highly anisotropic diffusion of water along axons, DTI can be used to evaluate the integrity and trajectory of the major white matter (WM) fiber bundles in the brain. DTI is sensitive to microscopic WM injury in these bundles, and may identify signs of impairment in anatomical connectivity that are not detectable with standard anatomical MRI.
Current methods for DTI analysis, including voxel-wise analysis, region-of-interest (ROI) analysis, tract-based spatial statistics (TBSS; Smith et al., 2006), and tractography, are limited, to some extent, by how well each method can identify comparable brain regions and tracts across subjects. Here, we used a new tract clustering and registration method that combines the strengths of voxel-wise and tractography-based methods, yielding a compact representation of fiber bundles. Like other cross-subject fiber-based methods (Colby et al., 2012), it also computes cross-subject correspondences for group comparisons. To compare tracts across subjects, tracts are often clustered into anatomical groups. Numerous clustering methods have been applied to tractography, including generalized Procrustes analysis (Corouge et al., 2006), spectral clustering (O’Donnell et al., 2006), Dirichlet distributions (Maddah et al., 2008), and a Gaussian process framework (Wassermann et al., 2010). This method uses maximum density paths (MDP) based on whole-brain tractography (Prasad et al., 2011a, 2011b, 2013a). Unlike some prior clustering methods, the large collection of tractography-generated 3D curves is first organized into bundles using prior anatomical landmarks to identify WM tracts based on a probabilistic WM atlas (Hua et al., 2008). These bundles are then reduced to a single maximum density path – MDP – by computing a path through the points of highest streamline density. The paths are then matched across subjects using geodesic curve registration (Joshi et al., 2007a, 2007b) for statistical comparison. This method avoids some of the pitfalls of methods that rely on traditional whole-brain non-linear registration, such as TBSS and voxel-based analysis, that arguably may introduce bias (Tustison et al., 2012; Schwarz et al., 2013). Additionally, many tract clustering methods ultimately collapse the DTI metrics along each tract into a single summary mean value for statistical analysis. By using along-tract point-wise statistics we can detect localized differences within a single tract. The use of point-wise statistics on 3D curves has been quite popular in the engineering literature, but papers using other methods (such as TBSS) far outnumber them in the neuroimaging literature. The use of point-wise statistics on tract curves is also mathematically related to work over the last two decades on the averaging and comparison of sulcal curves on the cortex, represented as 3D space curves or as parametric surfaces (Thompson et al., 1996a, 1996b; Zhou et al., 1999; Fillard et al., 2006; Shi et al., 2007).
In our current study, differences in WM microstructure were determined by comparing fractional anisotropy (FA) and mean diffusivity (MD) point-wise along each MDP, between normal control (CTL) subjects and either MCI or AD patients. We also examined associations between FA and MD along these paths with a widely used cognitive rating, the Mini-Mental State Exam (MMSE; Folstein et al., 1975). As an MDP is a low-dimensional representation of the white matter organization, we further assessed whether the DTI measures interpolated along the MDP were useful features for a support vector machine (SVM; Cortes and Vapnik, 1995) based classification of Alzheimer’s disease.
2. Methods
2.1 Image acquisition and subject information
Data collection for the ADNI-2 project is still in progress. Here we performed an initial analysis of data from 200 participants, of whom 50 were control subjects (CTL), 113 had mild cognitive impairment (MCI), and 37 were AD patients (Table 1). We note that in ADNI-2, MCI participants include the enrollment of a new early MCI (e-MCI) cohort, with milder episodic memory impairment than the MCI group of ADNI-1, now called late MCI (l-MCI) in ADNI-2. Each subject underwent a cognitive evaluation using the Mini-Mental State Exam (MMSE; scores of less than 24 out of 30 indicate impairment; Folstein et al., 1975). Detailed inclusion and exclusion criteria are found in the ADNI2 protocol (http://adni-info.org/Scientists/Pdfs/ADNI2_Protocol_FINAL_20100917.pdf).
Table 1.
Demographics and clinical scores for the participants
| CTL (n=50) | MCI (n=113) | e-MCI (n=74) | l-MCI (n=39) | AD (n=37) | p-value for group difference | |||
|---|---|---|---|---|---|---|---|---|
| CTLvsMCI | e-MCIvsl-MCI | CTLvsAD | ||||||
| Age | 72.1 +/− 5.9 | 72.6 +/− 7.4 | 72.8 +/− 8.1 | 72.4 +/− 5.8 | 75.7 +/− 9.3 | 0.66 | 0.75 | 0.05 |
| Sex | 22 M / 28 F | 70 M / 43 F | 46 M / 28 F | 24 M / 15 F | 21 M / 16 F | 0.04 | 0.95 | 0.24 |
| MMSE | 28.8 +/− 1.5 | 27.8 +/− 1.7 | 28.1 +/− 1.5 | 27.2 +/− 1.9 | 23.0 +/− 2.0 | 8.48E-5 | 0.01 | 2.44E-22 |
All subjects underwent whole-brain MRI scanning on 3-Tesla GE Medical Systems scanners at 14 acquisition sites across North America. T1-weighted IR-FSPGR (spoiled gradient echo) anatomical scans were collected (256×256 matrix; voxel size = 1.2×1.0×1.0 mm3; TI = 400 ms; TR = 6.98 ms; TE = 2.85 ms; flip angle = 11°), as well as diffusion-weighted images (DWI; 35 cm field of view, 128×128 acquired matrix, reconstructed to a 256×256 matrix; voxel size: 2.7×2.7×2.7mm3; scan time = 9 min; more imaging details may be found at http://adni.loni.usc.edu/wp-content/uploads/2010/05/ADNI2_GE_3T_22.0_T2.pdf). 46 separate images were acquired for each DTI scan: 5 T2-weighted images with no dedicated diffusion sensitization (b0 images) and 41 diffusion-weighted images (b=1000 s/mm2). This ADNI protocol was chosen after conducting a detailed comparison of several different DTI protocols, to optimize the signal-to-noise ratio in a fixed scan time (Jahanshad et al., 2010; Zhan et al., 2012). All T1-weighted MR and DWI images were visually checked for quality assurance to exclude scans with excessive motion and/or artifacts; all scans were included.
2.2 Image preprocessing
For each subject, all baseline raw DWI volumes were aligned with the FSL eddy-correct tool (www.fmrib.ox.ac.uk/fsl) to correct for head motion and eddy current distortions. All extra-cerebral tissue was subsequently removed from diffusion-weighted images using the Brain Extraction Tool (BET) from FSL (Smith, 2002). Non-brain tissue was also removed from T1- weighted anatomical scans using both ROBEX, a robust automated brain extraction program trained on manually “skull-stripped” MRI data (Iglesias et al., 2011) and FreeSurfer (Fischl et al., 2004). Skull-stripped volumes were visually inspected, and the best extraction selected, including both cerebellum and brain stem. Images were then further manually delineated by a trained anatomist to further remove any scalp, meninges, or neck not automatically removed. Anatomical scans subsequently underwent intensity inhomogeneity normalization using the MNI nu_correct tool (www.bic.mni.mcgill.ca/software/). To align data from different subjects into the same 3D coordinate space, each anatomical image was linearly aligned to a standard brain template (the downsampled Colin27: 110×110×110, with 2mm isotropic voxels; Holmes et al., 1998) using FSL flirt (Jenkinson et al., 2002) with 6 degrees of freedom to allow only translations and rotations in 3D.
To correct for echo-planar imaging (EPI) induced susceptibility artifacts, which can cause distortions at tissue-fluid interfaces, skull-stripped b0 (non-diffusion-weighted) images were linearly aligned and then elastically registered to their respective T1-weighted structural scans (in the Colin27 110×110×110 space) using an inverse-consistent registration algorithm with a mutual information cost function (Leow et al., 2007). The resulting linear 3D transformation matrices and 3D deformation fields were then applied to the remaining 41 DWI volumes, so that the DWIs and respective T1 images were in the same space.
A single diffusion tensor was fitted at each voxel in the brain from the eddy- and EPI- corrected DWI scans using FSL, and scalar anisotropy maps were obtained (Basser et al., 1994) from the resulting diffusion tensor eigenvalues (λ1, λ2, λ3). Fractional anisotropy (FA), a measure of the degree of diffusion anisotropy, was defined in the standard way as:
-where <λ> is equal to the mean diffusivity (MD) or average rate of diffusion in all directions. The resulting images were smoothed with a Gaussian kernel (5mm FWHM) to improve the signal to noise ratio and ensure a Gaussian distribution of the maps. Clearly, other smoothing filters could be used, or, at the expense of added complexity, the full diffusion image data could be filtered to preserve maximal information (Kim et al., 2009; Tong et al., 2012; Centigul et al., 2013).
2.3 Fiber tractography
At each voxel, constant solid angle orientation distribution functions (CSA-ODFs) were computed using the normalized and dimensionless ODF estimator, derived for Q-ball imaging (QBI) as in (Aganj et al., 2010). Tractography was performed on the linearly aligned sets of DWI volumes (in the Colin27 110×110×110 space) by probabilistically seeding voxels with a prior probability based on the FA value. Curves through a seed point receive a score estimating the probability of their following an axonal pathway, computed from the CSA-ODFs. We used a voting process provided by the Hough transform to determine the best fitting curves through each point, based on using a constant solid angle orientation density function to model the local diffusion propagator (Aganj et al., 2011); the resulting tractography is illustrated in Figure 1a. Elastic deformations obtained from EPI distortion correction, mapping the average b0 image to the T1-weighted image, were then applied to the resulting tracts’ 3D coordinates. Each subject’s dataset contained about 10,000 non-duplicated fibers (3D curves). In prior work, we have determined that this is a sufficient number of fibers to determine most of the common network topology measures accurately (Prasad et al., 2013b). We removed any erroneous fibers traced on the edge of the brain due to high intensity noise. To limit small noisy tracts, we filtered out fibers with less than 10 points.
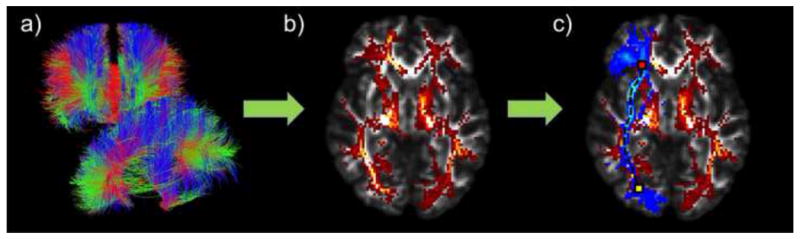
Figure 1.
(a) Whole-brain tractography fibers derived using the Hough transform method, based on DWI data from one individual in the study. (b) Whole-brain tractography was converted into a fiber density map, where each voxel in the volume represents the total number of streamlines that pass through it. (c) Probabilistic ROI (blue; right inferior fronto-occipital fasciculus) overlaid on the fiber density map (red/yellow). The MDP algorithm finds the shortest path through the fiber density map within the boundaries of the ROI from a start seed (yellow) to an end seed (red).
The angular resolution of the ADNI data is deliberately limited to avoid long scan times that increase patient attrition, but the use of an ODF model makes best use of the available angular resolution. The ODF-CSA model ensures high-quality tractography, which is the crux of the MDP methodology, but other validated methods could be used. Methods that can resolve more than one intravoxel dominant diffusion direction (ODFs, FODs, DSI) tend to perform better than DTI when used to reconstruct tracts and they may better reflect the underlying anatomy when more than one tract is present (Tuch, 2004; Daducci et al., 2013). Once the 3D geometry of the tracts has been extracted, any number of features can be interpolated onto the tract-derived MDPs.
2.4 Probabilistic white matter ROI atlas registration and fiber clustering
Fibers were clustered into 18 ROIs using the Johns Hopkins University (JHU) probabilistic WM tract atlas (Hua et al., 2008). A trained anatomist created up to 3 pairs of seed points (each pair consists of one start and one end seed; Figure 1c) for each ROI tract based on the anatomy and the highest probability at the extremities of each tract (Table 2). We linearly aligned (Jenkinson et al., 2002) and then elastically registered (Leow et al., 2007) the FA image from the JHU DTI atlas to each subject’s FA map. We then applied that deformation to both the WM atlas labels and the respective seed points, using nearest neighbor interpolation to avoid intermixing of labels. This placed the atlas ROIs and seeds in the same coordinate space as each subject’s tractography (all in the Colin27 110×110×110 space). The ROIs were then smoothed with a Gaussian kernel (2mm FWHM) to ensure the registered ROIs were contiguous. We were then able to select all fibers that intersected each ROI, forming an ROI fiber bundle (Figure 1c).
Table 2.
Index of ROIs from the probabilistic tract atlas (Hua et al., 2008) used for analysis, followed by their abbreviations, and the number of sets of seeds.
| Corpus Callosum through: | ||
| Cingulum | CC_Cing | 2 |
| Cuneus | CC_Cu | 1 |
| Lingual Gyrus | CC_LG | 1 |
| Middle Frontal Gyrus | CC_MFG | 1 |
| Middle Occipital Gyrus | CC_MOG | 1 |
| Postcentral Gyrus | CC_PoCG | 1 |
| Precentral Gyrus | CC_PrCG | 1 |
| Precuneus | CC_PrCu | 1 |
| Rectal Gyrus | CC_RG | 1 |
| Superior Frontal Gyrus | CC_SFG | 3 |
| Superior Occipital Gyrus | CC_SOG | 1 |
| Superior Parietal Gyrus | CC_SPG | 1 |
| Bilateral: | ||
| Cingulum at the Cingulate Gyrus | CGC | 1 |
| Cingulum at the Hippocampus | CGH | 1 |
| Inferior Fronto-Occipital Fasciculus | IFO | 1 |
| Inferior Longitudinal Fasciculus | ILF | 1 |
| Superior Longitudinal Fasciculus | SLF | 1 |
| Uncinate Fasciculus | UNC | 1 |
2.5 Maximum density path computation
As described in (Prasad et al., 2011a, 2011b, 2013a), each ROI fiber bundle for each subject was reduced to a compact, low-dimensional representation based on the maximum density path (MDP). Using each subject’s tractography, we generated a respective scalar fiber density map, where each voxel in the volume represents the total number of fibers that pass through it (Figure 1b). From this density map, we created a graph, where each density map voxel greater than 0 was represented as a node that is connected to its surrounding 26 neighbors by weighted undirected edges. To make the cost of traveling from one node to another inversely proportional to their density, each edge was weighted by taking the negative of the sum of the density values from the two voxels it connected, as follows:
Here di and dj denote node i and j’s corresponding voxel density. em is the maximum absolute value of the edge costs, added to ensure that the edges are positive.
Using each set of registered ROI seeds delineating a start and end location, we did a graph search using Dijkstra’s algorithm (1959) to find the shortest path (i.e., the maximum density path). However, in cases where the seeds did not correspond to a node (i.e., at a non-zero density voxel), we found the closest voxel to the ROI seeds as determined by the Euclidean distance. In situations where there was a ‘hole’ in the density map within an ROI due to the partial volume effect or the assignment of tracts into individual voxels, the algorithm could not create a connection between two nodes. We therefore added both nodes and edges, weighted with the smallest value possible, to the graph so all voxels within our ROI were fully connected (Jahanshad et al., 2012). This allowed gaps to be filled in, without biasing the resulting shortest path.
2.6 Maximum density path geodesic curve registration
As subjects were registered to the Colin27 template with a 6 parameter affine transform, the three-dimensional MDP curves of each subject are confounded by nuisance variables such as translation and orientation. However, to assess cross subject correspondences for group comparisons of the compact MDP representations, the MDPs must be registered to a common space, while maintaining, as much as possible, the particular characteristics of each subject’s anatomy. As in Joshi et al. (2007a, 2007b), we analyzed their geometry intrinsically, and represented the MDP curve β(s): [0,1] → ℜ3 by its invariant shape given by the square-root velocity function as
The q function is a parameterized function, and is invariant to translation and rotation. We also make it scale-invariant by dividing it by its magnitude. The set of MDPs are represented by their q function representations in an invariant shape space, given by an infinite-dimensional Hilbert sphere of functions. This shape space is equipped with an invariant Riemannian metric that allows us to compute distances between shapes via shortest paths, or geodesics between them. The geodesic framework also allows us to compute invariant, intrinsic statistics (Joshi et al., 2007a, 2007b; Prasad et al., 2011a) on the space of MDP paths. Importantly, we align the MDP representations elastically by a diffeomorphic matching of their shapes. The elastic MDP shape registration uses an efficient path-straightening method (Joshi et al., 2007b) that computes geodesics between two tract representations in a few milliseconds. For our data, we calculated mean MDPs across all 200 subjects and elastically registered all the respective MDPs to the mean. We can then calculate group statistics for cross subject comparisons of any number of scalar attributes along these paths. We chose to interpolate corresponding features from more traditional scalar FA and MD maps at each point in the registered paths, as these indices are perhaps most likely to be used in standardized multi-site DTI analyses. However, in future work we intend to also interpolate ODF based metrics, such as the TDF-derived FA (Leow et al., 2009; Zhan et al., 2009).
For each subject, their respective FA and MD values were interpolated at each point along the MDP via the linear interpolation function implemented in Matlab (http://www.mathworks.com/help/matlab/ref/interp3.html#bt2rbzl-2_1). We opted not to use cubic or spline interpolation that can sometimes result in negative values, as this would not make sense as FA values range from 0 to 1. Some other works that treat diffusion functions or diffusion tensors as elements of Riemannian manifolds, so many more elaborate interpolation choices are possible (Kim et al., 2009; Tong et al., 2012; Centigul et al., 2013).
2.8 Statistical analyses
We performed point-wise linear regressions along each MDP, adjusting for sex and age, to test for differences in FA and MD between CTL and MCI subjects (e-MCI and l-MCI separately and as a whole), and between CTL and AD patients. We additionally tested for associations between FA and MD along each MDP and MMSE scores in the entire population (n=200), again adjusting for sex and age. Computing multiple association tests along each (floating point) voxel of an MDP path can introduce a high false positive error rate. To control the expected rate of these errors across all points within all paths, we used the standard method for false discovery rate correction with the conventional q-value of 0.05 (FDR; Benjamini and Hochberg,1995).
2.6 Post-hoc classification
We used support vector machines (SVMs; Cortes and Vapnik, 1995), a supervised machine learning algorithm, to classify the DTI measures along the points of the mean MDPs to differentiate between diagnosis groups. SVMs classify two-class data by learning to find the best hyperplane to separate the two classes by maximizing the distance between the hyperplane and the closest data point. Each subject is represented as a d-dimensional vector, xi, and its category as yi = ±1, to find the hyperplane
such that w and b minimize ||w|| for all xi and yi. In addition, we used nonlinear SVM classification by applying a nonlinear transformation using Gaussian radial basis functions (RBF).
Using accuracy, sensitivity, and specificity, we tested the utility of different subsets of features to distinguish between the two pairs of diagnostic groups where significant group differences were detected: CTL and AD, CTL and l-MCI. In each fold of a 10 × 10-fold cross- validation, we randomly selected an equal number of subjects from each class to avoid the “unequal training class size bias” (Chew et al., 2001). We determined the subsets of features for each class-pair based on the DTI measures (FA and/or MD) that showed significant differences between the groups. To distinguish between CTL and AD groups, we tested the FA values and MD values along all the mean MDP points (1080 points; Table 3). We further tested only the subset of significant FA points (FAFDR CvA=214 points) and the subset of significant MD points (MDFDR CvA=641 points). To distinguish between CTL and l-MCI we tested all the MD values along all the MDP points (1080 points), as well the subset of significant MD points (MDFDR CvL=12 points).
Table 3.
Table of ROIs that exhibit FDR-significant (Benjamini and Hochberg, 1995) differences between CTL and either AD or l-MCI subjects, and associations with MMSE cognitive scores. Here we show the total length of each tract’s mean MDP, as well the number of points that are FDR-significant followed by the percentage of mean MDP tract points that show significant group differences.
| ROI | Length | AD vs CTL | CTL vs l-MCI | MMSE | |||
|---|---|---|---|---|---|---|---|
| FA | MD | FA | MD | FA | MD | ||
| p<0.010 | p<0.030 | -- | p<0.001 | p<0.003 | p<0.029 | ||
| CGC L | 59 | 23 (39.0 %) | 22 (37.3%) | -- | -- | 2 (3.4%) | 16 (27.1%) |
| CGC R | 64 | 11 (17.2 %) | 11 (17.2%) | -- | -- | 5 (7.8%) | 10 (15.6%) |
| CGH L | 25 | -- | 22 (88.0%) | -- | -- | -- | 21 (84.0%) |
| CGH R | 18 | 5 (27.8%) | 18 (100%) | -- | 2 (11.1%) | -- | 18 (100%) |
| IFO L | 67 | 12 (17.9 %) | 45 (67.2%) | -- | -- | 5 (7.5%) | 51 (76.1%) |
| IFO R | 60 | 2 (3.3%) | 45 (75.0%) | -- | -- | 10 (16.7%) | 44 (73.3%) |
| ILF L | 42 | 5 (11.9%) | 35 (83.3%) | -- | 3 (7.1%) | -- | 42 (100%) |
| ILF R | 42 | -- | 42 (100%) | -- | -- | -- | 38 (90.5%) |
| SLF L | 35 | -- | 18 (51.4%) | -- | -- | -- | 20 (57.1%) |
| SLF R | 33 | -- | 24 (72.7%) | -- | -- | -- | 29 (87.9%) |
| UNC L | 23 | 6 (26.1%) | 23 (100%) | -- | 2 (8.7%) | 3 (13.0%) | 22 (95.7%) |
| UNC R | 19 | -- | 15 (78.9%) | -- | -- | -- | 18 (94.7%) |
| CC_Cing | 71 | 10 (14.1%) | 21 (29.6%) | -- | -- | -- | 23 (32.4%) |
| CC_Cu | 31 | 5 (16.1%) | 13 (41.9%) | -- | -- | -- | 5 (16.1%) |
| CC_LG | 37 | 2 (5.4%) | 24 (64.9%) | -- | 3 (8.1%) | -- | 15 (40.5%) |
| CC_MFG | 25 | 5 (20.0 %) | 17 (68.0%) | -- | -- | 3 (12.0%) | 18 (72.0%) |
| CC_MOG | 58 | 11 (19.0%) | 20 (34.5%) | -- | -- | 2 (3.4%) | 29 (50.0%) |
| CC_PoCG | 42 | 21 (50.0%) | 30 (71.4%) | -- | -- | -- | 18 (42.9%) |
| CC_PrCG | 42 | 8 (19.0%) | 22 (52.4%) | -- | -- | -- | 15 (35.7%) |
| CC_PrCu | 41 | 25 (61.0%) | 30 (73.2%) | -- | 2 (4.9%) | 16 (39.0%) | 34 (82.9%) |
| CC_RG | 29 | 1 (3.4%) | 27 (93.1%) | -- | -- | -- | 29 (100%) |
| CC_SFG | 120 | 25 (20.8%) | 57 (47.5%) | -- | -- | 4 (3.3%) | 57 (47.5%) |
| CC_SOG | 58 | 14 (24.1%) | 32 (55.2%) | -- | -- | -- | 26 (44.8%) |
| CC_SPG | 39 | 23 (59.0%) | 28 (71.8%) | -- | -- | 15 (38.5%) | 27 (69.2%) |
3. Results
3.1 MDP analyses
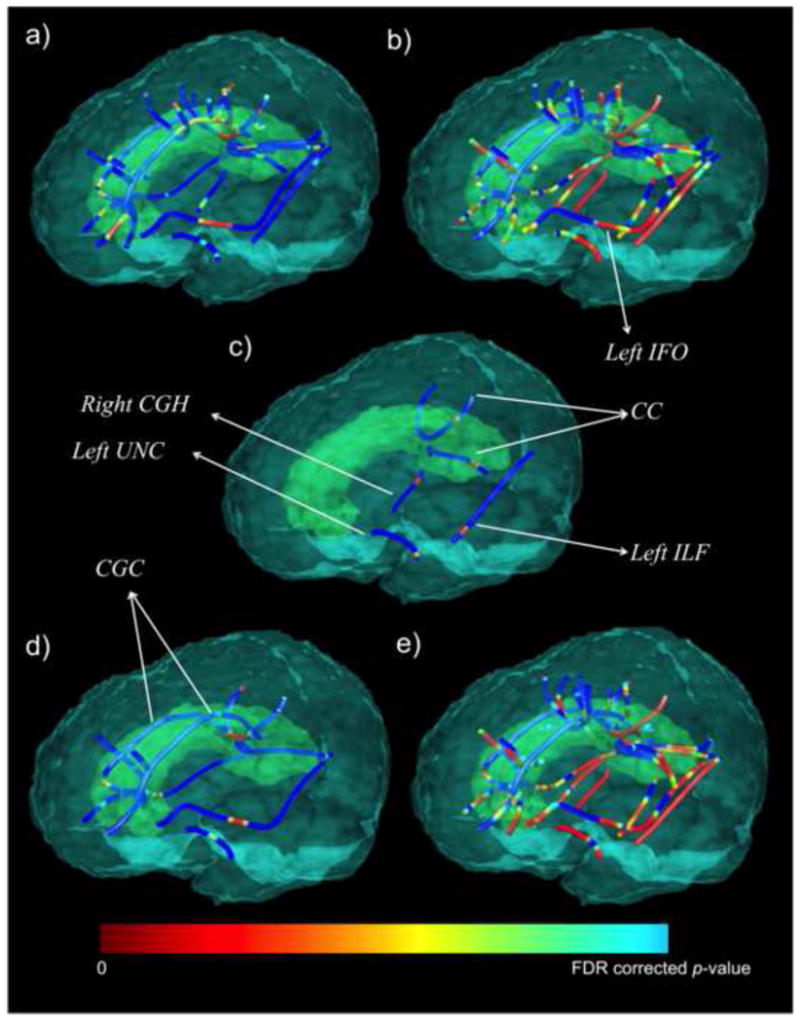
AD patients showed significantly lower FA (Figure 2a; critical p<0.01) and higher MD (Figure 2b; critical p<0.03) compared to cognitively healthy elderly CTL subjects, throughout the commissural and long association fibers (Table 3). We found significantly higher MD in l- MCI subjects compared to CTL subjects (Figure 2c; critical p<0.001) in posterior and temporal lobe tracts. We did not detect differences between e-MCI (or the full MCI group) relative to the group of CTL subjects. These results are in the expected direction, as deteriorations in fiber integrity are generally accompanied by higher values for diffusivity measures.
Figure 2.
Statistical maps show MDPs where (a) FA is significantly lower (critical p<0.01) and (b) MD is significantly higher (critical p<0.03) in AD patients compared to CTL subjects. (c) depicts the MDPs with significantly higher MD in l-MCI compared to CTL subjects (critical p<0.001). (d) MMSE was significantly positively associated with FA (critical p<0.003) and (e) significantly negatively associated with MD (critical p<0.029) in the entire population (n=200). In this figure color-bar upper value (i.e. blue FDR corrected p-value) corresponds to a different FDR critical p-value for each analysis (a–d). CGH=cingulum at the hippocampus, CGC=cingulum at the cingulate gyrus, UNC=uncinate fasciculus, CC=corpus callosum, IFO=inferior fronto-occipital fasciculus, ILF=inferior longitudinal fasciculus.
We further found a significant positive association between FA and MMSE (Figure 2d; critical p<0.003) and negative association between MMSE and MD (Figure 2e; critical p<0.029). That is, lower FA and higher diffusivity, which typically indicate greater WM deficits, were associated with lower MMSE scores, which are indicative of greater impairment.
3.2 SVM results
Table 4 shows the percent accuracy, sensitivity, and specificity of the two classifications using different subsets of features. Due to this randomized training, results could differ on each SVM run. We therefore report an average of 10 different runs. Overall, MD features performed better than FA features. Further reducing dimensionality - by only choosing the mean MDP points that passed FDR - increased the accuracy.
Table 4.
Average results from 10 runs of an SVM, 10×10-fold cross-validated classification, with different sets of features. Average accuracy, sensitivity, and specificity are shown as percentages followed by the maximum from the 10 runs.
| Classification | Features | %Accuracy (max.) | %Sensitivity (max.) | %Specificity (max.) |
|---|---|---|---|---|
| CTL/AD | FA (n=1080) | 74.5 +/− 1.3 (77.0) | 75.0 +/− 1.4 (78.0) | 73.9 +/− 2.2 (75.7) |
| MD (n=1080) | 80.6 +/− 2.3 (85.1) | 79.2 +/− 3.2 (86.0) | 82.4 +/− 3.4 (89.2) | |
| FAFDR CvA (n=214) | 77.8 +/− 1.3 (79.3) | 78.2 +/− 2.0 (80.0) | 77.3 +/− 1.4 (78.4) | |
| MDFDR CvA(n=641) | 84.9 +/− 0.8 (86.2) | 84.4 +/− 2.1 (88.0) | 85.7 +/− 1.8 (89.2) | |
| CTL/l-MCI | MD (n=1080) | 68.3 +/− 2.6 (70.8) | 69.8 +/− 3.8 (76.0) | 66.4 +/− 4.1 (74.4) |
| MDFDR CvL (n=12) | 79.0 +/− 1.3 (82.0) | 76.9 +/− 1.8 (80.0) | 81.5 +/− 2.9 (84.6) |
4. Discussion
In this paper, we apply a novel tract clustering and compact fiber representation method that may be a useful tool for understanding the effects of Alzheimer’s disease on the brain’s WM circuitry. It combines some of the benefits of tractography-based methods with those of voxel- based analyses, by providing spatial detail in defining statistical associations. It does not rely exclusively on global registration of the images into the same space, but it explicitly models white matter tracts based on anatomical prior information. We were able to compute tract- specific, mean shapes in a space that is invariant to scaling, translation and rotation. On the other hand, other methods for DTI analysis, such as TBSS (Smith et al., 2006), do not compute correspondences between explicit models of tracts, but rely on extrema in the FA maps to identify features across subjects, which may differ in their homology. In addition to this, unlike other WM tract clustering analyses registration methods that either use Procrustes fitting and mean shape (Corouge et al., 2006), not taking shape into account, or a linear matching (Colby et al., 2012), where the points in each curve may not correspond, our registration method optimally resamples each subject’s tract geometry by taking into account its geodesics when registering to the corresponding computed mean tract. This reduces the bias, and increases the accuracy. Each tract’s mean representation offers an efficient method to reduce the white matter map’s high voxel-wise dimensionality to a set of points that can capture relevant macro-anatomical and microstructural information.
In this method, we assess DTI metrics along tracts (Table 3; Figure 2), taking into account with-in tract variability to tease apart whole tract and more focal abnormalities. In many tractography analyses, the microstructural metrics (e.g., FA, MD, etc.) along one tract are collapsed down to a single mean scalar value for statistics, resulting in a loss of information and perhaps power to detect group differences if they are in fact more localized (of course, the tract mean may also be valuable and can be computed from our method). Using the MDP method, we detected significant WM deficits in AD patients and l-MCI subjects relative to cognitively healthy CTL subjects as might be expected from the DTI literature on AD (Braskie and Thompson, 2013; Nir et al., 2013). We found higher MD and lower FA along the MDPs of many WM tracts previously implicated in AD (Fellgiebel et al., 2008; Stebbins and Murphy, 2009), implying disrupted WM microstructure. More subtle l-MCI deficits were found in temporal (right cingulum of the hippocampus and the left uncinate fasciculus and inferior longitudinal fasciculus) and posterior (lingual gyrus and precuneus corpus callosum) tracts of the brain, corroborating a pattern of degeneration in the temporal lobe and posterior temporo-parietal circuitry found in many other DTI studies of MCI and AD (Head et al., 2004; Stahl et al., 2007; Chua et al., 2008; Stebbins and Murphy, 2009). These regions are consistent with regions showing earliest pathological changes (Braak and Braak, 1996; Thompson et al., 2007). Only MD measures were sensitive enough to detect l-MCI differences and revealed more profuse associations than FA in all analyses (Table 3). This is in line with many prior studies. A recent AD DTI review found that MD values have more discriminative power than FA values and higher effect sizes for detecting disease related effects - derived from 55 different studies - in the frontal, parietal, occipital and temporal lobes (Clerx et al., 2012; Nir et al., 2013). We also found significant associations between FA and MD MDP measures and cognitive deficits, as measured by MMSE scores, across all subjects. Overall, both FA and MD showed significant associations. While MD showed widespread significance (Figure 2), disease effects on FA were detected only in localized regions of tracts; these local could be lost with whole tract averages.
The detection of a disease effect in one part of a tract does not mean that the disease selectively affects that part of the tract – the biology of degenerative brain diseases such as Alzheimer’s disease suggests a relentless spread in which all parts of all fibers in the brain are progressively affected. However some neuroanatomical and technical factors may make disease effects (or any effects) harder to detect in some parts of tracts than others. For instance, some parts of the tracts have low SNR for the measures examined here, either due to imaging signal-to-noise or due to anatomical complexity such as fanning or fiber crossing. Some parts of the tracts may have fiber crossings, which can affect the SNR and mean values for the measures we examined. The power of localized analysis includes the ability to detect effects where there is greatest power to detect them, but does not necessarily mean the scope of pathology has been fully mapped or that it is as anatomically selective as the maps might imply.
As with any clinical data set, we must take into account the potential for increased noise and processing difficulties in pathological scans. In AD, reconstruction of the local intra-voxel fiber structure is more susceptible to error due to altered WM microstructure (demyelination, axonal injury, and cerebrovascular microinfarcts). This method relies on accurate tractography best achieved by using ODF based methods to reconstruct the diffusion signal in regions where WM morphology is highly altered. Additionally, the quality of registration between the JHU atlas and images with atrophied tissue (e.g., larger ventricles and sulci) may not be optimal.
A range of MRI modalities have been used in conjunction with machine learning techniques to track MCI and AD progression. Volumetric approaches, including hippocampal volume, gray matter volume from voxel based morphometry, and cortical thickness (Klöppel et al., 2008; Lerch et al., 2008; Desikan et al., 2009; Magnin et al., 2009) have effectively classified AD patients. Few studies have used DTI derived biomarkers for SVM classification purposes. In a sample of 27 subjects, tractography based connectivity metrics based on fiber count, anisotropy and diffusivity measures were used to classify AD with an accuracy of 88% (Wee et al., 2011). Some studies have also used features derived from full DTI maps and TBSS skeletons, employing methods like Pearson’s correlation and ReliefF (Robnik-Šikonja and Kononenko, 2003) to reduce the number of features (Haller at al., 2010; O’Dwyer et al., 2011; Graña et al., 2011), yielding accuracies of more than 90%. In this study, we evaluated 200 subjects and were able to reach relatively high accuracy despite the heterogeneity of our sample (more than 14 scanners across the country) and using the full set of features from the compact mean MDP representation. The features interpolated along our full mean MDPs are robust enough to reach high classification accuracies (~80%), so that reducing dimensionality by including only statistically significant MDP points did not dramatically increase classification accuracy (~85%).
Ultimately, this novel method may reduce bias and increase accuracy using optimal tract geometry resampling. It allows us to project and compare any number of novel measures on the MDPs. Furthermore, we were able train and classify SVMs successfully, based on features mapped onto these anatomically correct white matter tract representations. In the future, mapping other biomarkers, such as fiber density and novel HARDI-ODF derived biomarkers such as the TDF measures (Leow et al., 2009; Zhan et al., 2009) along the MDPs may further our ability to distinguish patients from controls based on diffusion-weighted imaging data. Furthermore, ADNI2 is a longitudinal study and, as it progresses, we will be able to investigate which subjects develop AD, and if these early WM aberrations help predict future deficits and conversion to AD. This study offers initial evidence that DTI-based measures along MDPs may be a novel biomarker of AD.
Acknowledgments
Algorithm development and image analysis for this study was funded, in part, by grants to PT from the NIBIB (R01 EB008281, R01 EB008432) and by the NIA, NIBIB, NIMH, the National Library of Medicine, and the National Center for Research Resources (AG016570, AG040060, EB01651, MH097268, LM05639, RR019771 to PT). Data collection and sharing for this project was funded by ADNI (NIH Grant U01 AG024904). ADNI is funded by the National Institute on Aging, the National Institute of Biomedical Imaging and Bioengineering, and through contributions from the following: Abbott; Alzheimer’s Association; Alzheimer’s Drug Discovery Foundation; Amorfix Life Sciences Ltd.; AstraZeneca; Bayer HealthCare; BioClinica, Inc.; Biogen Idec Inc.; Bristol-Myers Squibb Company; Eisai Inc.; Elan Pharmaceuticals Inc.; Eli Lilly and Company; F. Hoffmann-La Roche Ltd and its affiliated company Genentech, Inc.; GE Healthcare; Innogenetics, N.V.; IXICO Ltd.; Janssen Alzheimer Immunotherapy Research & Development, LLC.; Johnson & Johnson Pharmaceutical Research & Development LLC.; Medpace, Inc.; Merck & Co., Inc.; Meso Scale Diagnostics, LLC.; Novartis Pharmaceuticals Corporation; Pfizer Inc.; Servier; Synarc Inc.; and Takeda Pharmaceutical Company. The Canadian Institutes of Health Research is providing funds to support ADNI clinical sites in Canada. Private sector contributions are facilitated by the Foundation for the National Institutes of Health. The grantee organization is the Northern California Institute for Research and Education, and the study is coordinated by the Alzheimer’s Disease Cooperative Study at the University of California, San Diego. ADNI data are disseminated by the Laboratory for Neuro Imaging at the University of Southern California. This research was also supported by NIH grants P30 AG010129 and K01 AG030514 from the National Institute of General Medical Sciences.
Footnotes
Disclosure Statement
The authors have no potential financial or personal conflicts of interest including relationships with other people or organizations within three years of beginning the work submitted that could inappropriately influence this work. One of the authors, Michael Weiner, receives private funding unrelated to the content of this paper.
Many investigators within the ADNI contributed to the design and implementation of ADNI and/or provided data, but most of them did not participate in analysis or writing of this report. A complete list of ADNI investigators may be found at: http://adni.loni.usc.edu/wp-content/uploads/how_to_apply/ADNI_Acknowledgement_List.pdf
References
- Aganj I, Lenglet C, Sapiro G, Yacoub E, Ugurbil K, Harel N. Reconstruction of the orientation distribution function in single- and multiple-shell q-ball imaging within constant solid angle. Magn Reson Med. 2010;64(2):554–466. doi: 10.1002/mrm.22365. [DOI] [PMC free article] [PubMed] [Google Scholar]
- Aganj I, Lenglet C, Jahanshad N, Yacoub E, Thompson PM, Sapiro G. A Hough transform global probabilistic approach to multiple-subject diffusion MRI tractography. Med Image Anal. 2011;15(4):414–425. doi: 10.1016/j.media.2011.01.003. [DOI] [PMC free article] [PubMed] [Google Scholar]
- Alzheimer’s Association. Alzheimer’s disease facts and figures. Alzheimer’s & Dementia. 2011;8(2):1–72. doi: 10.1016/j.jalz.2012.02.001. [DOI] [PubMed] [Google Scholar]
- Basser PJ, Mattiello J, LeBihan D. MR diffusion tensor spectroscopy and imaging. Biophys Journal. 1994;66(1):259–267. doi: 10.1016/S0006-3495(94)80775-1. [DOI] [PMC free article] [PubMed] [Google Scholar]
- Benjamini Y, Hochberg Y. Controlling the false discovery rate - a practical and powerful approach to multiple testing. Journal of the Royal Statistical Society Series B- Methodological. 1995;57:289–300. [Google Scholar]
- Braak H, Braak E. Development of Alzheimer-related neurofibrillary changes in the neocortex inversely recapitulates cortical myelogenesis. Acta Neuropathol. 1996;92(2):197–201. doi: 10.1007/s004010050508. [DOI] [PubMed] [Google Scholar]
- Braskie MN, Thompson PM. A focus on structural brain imaging in the Alzheimer’s Disease Neuroimaging Initiative. Biol Psychiatry. 2013 doi: 10.1016/j.biopsych.2013.11.020. Epub ahead of print. [DOI] [PMC free article] [PubMed] [Google Scholar]
- Brun A, Englund E. White matter disorder in dementia of the Alzheimer type: a pathoanatomical study. Ann Neurol. 1986;19(3):253–262. doi: 10.1002/ana.410190306. [DOI] [PubMed] [Google Scholar]
- Cetingul HE, Wright MJ, Thompson PM, Vidal R. Segmentation of high angular resolution diffusion MRI using sparse Riemannian manifold clustering. IEEE Trans Med Imaging. 2013 doi: 10.1109/TMI.2013.2284360. Epub ahead of print. [DOI] [PMC free article] [PubMed] [Google Scholar]
- Chew H, Bogner R, Lim C. Dual v-support vector machine with error rate and training size biasing. IEEE Int Conf on Acoustics, Speech, and Signal Processing. 2001;2:1269–1272. [Google Scholar]
- Chua TC, Wen W, Slavin MJ, Sachdev PS. Diffusion tensor imaging in mild cognitive impairment and Alzheimer’s disease: a review. Curr Opin Neurol. 2008;21(1):83–92. doi: 10.1097/WCO.0b013e3282f4594b. [DOI] [PubMed] [Google Scholar]
- Clerx L, Visser PJ, Verhey F, Aalten P. New MRI markers for Alzheimer’s disease: A meta-analysis of diffusion tensor imaging and a comparison with medial temporal lobe measurements. Journal of Alzheimer’s Disease. 2012;29:405–429. doi: 10.3233/JAD-2011-110797. [DOI] [PubMed] [Google Scholar]
- Colby J, Soderberg L, Lebel C, Dinov ID, Thompson PM, Sowell ER. Along- tract statistics allow for enhanced tractography analysis. NeuroImage. 2012;59(4):3227–3242. doi: 10.1016/j.neuroimage.2011.11.004. [DOI] [PMC free article] [PubMed] [Google Scholar]
- Cortes C, Vapnik V. Support-vector networks. Machine Learning. 1995;20(3):273–297. [Google Scholar]
- Corouge I, Fletcher PT, Joshi S, Gouttard S, Gerig G. Fiber tract-oriented statistics for quantitative diffusion tensor MRI analysis. Med Image Analysis. 2006;10(5):786–798. doi: 10.1016/j.media.2006.07.003. [DOI] [PubMed] [Google Scholar]
- Daducci A, Canales-Rodriguez E, Descoteaux M, Gur Y, Mani M, Merlet S, Ramirez-Manzanares A, Rodrigues P, Reisert M, Sepehrband F. Quantitative comparison of reconstruction methods for intra-voxel fiber recovery from diffusion MRI. IEEE Trans Med Imaging. 2013 doi: 10.1109/TMI.2013.2285500. Epub ahead of print. [DOI] [PubMed] [Google Scholar]
- Delbeuck X, Van der Linden M, Collette F. Alzheimer’s disease as a disconnection syndrome? Neuropsychol Rev. 2003;13:79–92. doi: 10.1023/a:1023832305702. [DOI] [PubMed] [Google Scholar]
- De Lacoste MC, White CL. The role of cortical connectivity in Alzheimer’s disease pathogenesis: A review and model system. Neurobiol Aging. 1993;14:1–16. doi: 10.1016/0197-4580(93)90015-4. [DOI] [PubMed] [Google Scholar]
- Desikan RS, Cabral HJ, Hess CP, Dillon WP, Glastonbury CM, Weiner MW, Schmansky NJ, Greve DN, Salat DH, Buckner RL, Fischl B ADNI. Automated MRI measures identify individuals with mild cognitive impairment and Alzheimer’s disease. Brain. 2009;132:2048–2057. doi: 10.1093/brain/awp123. [DOI] [PMC free article] [PubMed] [Google Scholar]
- Dijkstra EW. A note on two problems in connexion with graphs. Numerische Mathematik. 1959;1(1):269–271. [Google Scholar]
- Fellgiebel A, Schermuly I, Gerhard A, Keller I, Albrecht J, Weibrich C, Müller MJ, Stoeter P. Functional relevant loss of long association fibre tracts integrity in early Alzheimer’s disease. Neuropsychologia. 2008;46(6):1698–1706. doi: 10.1016/j.neuropsychologia.2007.12.010. [DOI] [PubMed] [Google Scholar]
- Fischl B, van der Kouwe A, Destrieux C, Halgren E, Segonne F, Salat DH, Busa E, Seidman LJ, Goldstein J, Kennedy D, Caviness V, Makris N, Rosen B, Dale AM. Automatically parcellating the human cerebral cortex. Cereb Cortex. 2004;14(1):11–22. doi: 10.1093/cercor/bhg087. [DOI] [PubMed] [Google Scholar]
- Folstein MF, Folstein SE, McHugh PR. “Mini-mental state” A practical method for grading the cognitive state of patients for the clinician. Journal of Psychiatric Research. 1975;12(3):189–198. doi: 10.1016/0022-3956(75)90026-6. [DOI] [PubMed] [Google Scholar]
- Graña M, Termenon M, Savio A, Gonzalez-Pinto A, Echeveste J, Pérez JM, Besga A. Computer aided diagnosis system for Alzheimer disease using brain diffusion tensor imaging features selected by Pearson’s correlation. Neurosci Lett. 2011;502(3):225–229. doi: 10.1016/j.neulet.2011.07.049. [DOI] [PubMed] [Google Scholar]
- Haller S, Nguyen D, Rodriguez C, Emch J, Gold G, Bartsch A, Lovblad KO, Giannakopoulos P. Individual prediction of cognitive decline in mild cognitive impairment using support vector machine-based analysis of diffusion tensor imaging data. J Alzheimers Dis. 2010;22(1):315–327. doi: 10.3233/JAD-2010-100840. [DOI] [PubMed] [Google Scholar]
- Head D, Buckner RL, Shimony JS, Williams LE, Akbudak E, Conturo TE, McAvoy M, Morris JC, Snyder AZ. Differential vulnerability of anterior white matter in nondemented aging with minimal acceleration in dementia of the Alzheimer type: evidence from diffusion tensor imaging. Cereb Cortex. 2004;14(4):410–423. doi: 10.1093/cercor/bhh003. [DOI] [PubMed] [Google Scholar]
- Holmes CJ, Hoge R, Collins L, Woods R, Toga AW, Eva AC. Enhancement of MR images using registration for signal averaging. J Comput Assist Tomogr. 1998;22(2):324–333. doi: 10.1097/00004728-199803000-00032. [DOI] [PubMed] [Google Scholar]
- Hua KJ, Zhang J, Wakana S, Jiang H, Li X, Reich DS, Calabresi PA, Pekar JJ, van Zijl PC, Mori S. Tract probability maps in stereotaxic spaces: Analyses of white matter anatomy and tract-specific quantification. Neuroimage. 2008;39(1):336–47. doi: 10.1016/j.neuroimage.2007.07.053. [DOI] [PMC free article] [PubMed] [Google Scholar]
- Hua X, Leow AD, Lee S, Klunder AD, Toga AW, Lepore N, Chou YY, Brun C, Chiang MC, Barysheva M, Jack CR, Jr, Bernstein MA, Britson PJ, Ward CP, Whitwell JL, Borowski B, Fleisher AS, Fox NC, Boyes RG, Barnes J, Harvey D, Kornak J, Schuff N, Boreta L, Alexander GE, Weiner MW, Thompson PM ADNI. 3D characterization of brain atrophy in Alzheimer’s disease and mild cognitive impairment using tensor-based morphometry. Neuroimage. 2008;41(1):19–34. doi: 10.1016/j.neuroimage.2008.02.010. [DOI] [PMC free article] [PubMed] [Google Scholar]
- Hua X, Lee S, Hibar DP, Yanovsky I, Leow AD, Toga AW, Jack CR, Jr, Bernstein MA, Reiman EM, Harvey DJ, Kornak J, Schuff N, Alexander GE, Weiner MW, Thompson PM. Mapping Alzheimer’s disease progression in 1309 MRI scans: power estimates for different inter-scan intervals. Neuroimage. 2010;51(1):63–75. doi: 10.1016/j.neuroimage.2010.01.104. [DOI] [PMC free article] [PubMed] [Google Scholar]
- Iglesias JE, Liu CY, Thompson PM, Tu Z. Robust brain extraction across datasets and comparison with publicly available methods. IEEE Trans Med Imaging. 2011;30(9):1617–1634. doi: 10.1109/TMI.2011.2138152. [DOI] [PubMed] [Google Scholar]
- Jahanshad N, Zhan L, Bernstein MA, Borowski B, Jack CR, Toga AW, Thompson PM. Diffusion tensor imaging in seven minutes: Determining trade-offs between spatial and directional resolution. Proc IEEE Int Symp Biomed Imaging. 2010;2010:1161–1164. [Google Scholar]
- Jahanshad N, Prasad G, Toga AW, McMahon KL, de Zubicaray GI, Martin NG, Wright MJ, Thompson PM. Genetics of path lengths in brain connectivity networks: HARDI-based maps in 457 adults. MICCAI MBIA. 2012;2012:29–40. doi: 10.1007/978-3-642-33530-3_3. [DOI] [PMC free article] [PubMed] [Google Scholar]
- Jenkinson M, Bannister P, Brady J, Smith S. Improved optimisation for the robust and accurate linear registration and motion correction of brain images. NeuroImage. 2002;17(2):825–841. doi: 10.1016/s1053-8119(02)91132-8. [DOI] [PubMed] [Google Scholar]
- Joshi SH, Klassen E, Srivastava A, Jermyn I. Removing shape-preserving transformations in square-root elastic (SRE) framework for shape analysis of curves. IEEE Comput Vis Pattern Recognit. 2007a;4679:387–398. doi: 10.1007/978-3-540-74198-5_30. [DOI] [PMC free article] [PubMed] [Google Scholar]
- Joshi SH, Klassen E, Srivastava A, Jermyn I. A novel representation for Riemannian analysis of elastic curves in Rn. IEEE Comput Vis Pattern Recognit. 2007b;2007:1–7. doi: 10.1109/CVPR.2007.383185. [DOI] [PMC free article] [PubMed] [Google Scholar]
- Kim Y, Thompson PM, Toga AW, Vese L, Zhan L. HARDI denoising: variational regularization of spherical apparent diffusion coefficient sADC. Inf Process Med Imaging. 2009;21:515–27. doi: 10.1007/978-3-642-02498-6_43. [DOI] [PubMed] [Google Scholar]
- Klöppel S, Stonnington CM, Chu C, Draganski B, Scahill RI, Fox NC, Jack CR, Ashburner J, Frackowiak RSJ. Automatic classification of MR scans in Alzheimer’s disease. Brain. 2008;131:681–689. doi: 10.1093/brain/awm319. [DOI] [PMC free article] [PubMed] [Google Scholar]
- Leow AD, Yanovsk I, Chiang MC, Lee AD, Klunder A, Lu A, Becker J, Davis S, Toga AW, Thompson PM. Statistical properties of Jacobian maps and the realization of unbiased large-deformation nonlinear image registration. IEEE Trans on Medical Imaging. 2007;26(6):822–832. doi: 10.1109/TMI.2007.892646. [DOI] [PubMed] [Google Scholar]
- Leow AD, Zhu S, Zhan L, McMahon K, de Zubicaray GI, Meredith M, Wright MJ, Toga AW, Thompson PM. The tensor distribution function. Magn Reson Med. 2009;61(1):205–214. doi: 10.1002/mrm.21852. [DOI] [PMC free article] [PubMed] [Google Scholar]
- Lerch JP, Pruessner J, Zijdenbos AP, Collins DL, Teipel SJ, Hampel H, Evans AC. Automated cortical thickness measurements from MRI can accurately separate Alzheimer’s patients from normal elderly controls. Neurobiol Aging. 2008;29(1):23–30. doi: 10.1016/j.neurobiolaging.2006.09.013. [DOI] [PubMed] [Google Scholar]
- Liu Y, Spulber G, Lehtimäki KK, Könönen M, Hallikainen I, Gröhn H, Kivipelto M, Hallikainen M, Vanninen R, Soininen H. Diffusion tensor imaging and tract-based spatial statistics in Alzheimer’s disease and mild cognitive impairment. Neurobiol Aging. 2011;32(9):1558–1571. doi: 10.1016/j.neurobiolaging.2009.10.006. [DOI] [PubMed] [Google Scholar]
- Maddah M, Zollei L, Grimson WEL, Wells WM. Modeling of anatomical information in clustering of white matter fiber trajectories using Dirichlet distribution. IEEE Proc CVPR. 2008:1–7. doi: 10.1109/CVPRW.2008.4563003. [DOI] [PMC free article] [PubMed] [Google Scholar]
- Medina D, DeToledo-Morrell L, Urresta F, Gabrieli JD, Moseley M, Fleischman D, Bennett DA, Leurgans S, Turner DA, Stebbins GT. White matter changes in mild cognitive impairment and AD: A diffusion tensor imaging study. Neurobiol Aging. 2006;27(5):663–672. doi: 10.1016/j.neurobiolaging.2005.03.026. [DOI] [PubMed] [Google Scholar]
- Magnin B, Mesrob L, Kinkingnéhun S, Pélégrini-Issac M, Colliot O, Sarazin M, Dubois B, Lehéricy S, Benali H. Support vector machine-based classification of Alzheimer’s disease from whole-brain anatomical MRI. Neuroradiology. 2009;51(2):73–83. doi: 10.1007/s00234-008-0463-x. [DOI] [PubMed] [Google Scholar]
- Migliaccio R, Agosta F, Possin KL, Rabinovici GD, Miller BL, Gorno-Tempini ML. White matter atrophy in Alzheimer’s disease variants. Alzheimers Dement. 2012;8(5 Suppl):S78–87. e71–72. doi: 10.1016/j.jalz.2012.04.010. [DOI] [PMC free article] [PubMed] [Google Scholar]
- Nir TM, Jahanshad N, Villalon-Reina JE, Toga AW, Jack CR, Weiner MW, Thompson PM ADNI. Effectiveness of regional DTI measures in distinguishing Alzheimer’s disease, MCI, and normal aging. Neuroimage Clin. 2013;3:180–195. doi: 10.1016/j.nicl.2013.07.006. [DOI] [PMC free article] [PubMed] [Google Scholar]
- O’Donnell L, Kubicki M, Shenton ME, Dreusicke MH, Grimson WE, Westin CF. A method for clustering white matter fiber tracts. American Journal of Neuroradiology. 2006;27(5):1032–1036. [PMC free article] [PubMed] [Google Scholar]
- O’Dwyer L, Lamberton F, Bokde ALW, Ewers M, Faluyi YO, Tanner C, Mazoyer B, O’Neill D, Bartley M, Collins DR, Coughlan T, Prvulovic D, Hampel H. Using support vector machines with multiple indices of diffusion for automated Cclassification of mild cognitive impairment. PLoS ONE. 2012;7(2):e32441. doi: 10.1371/journal.pone.0032441. [DOI] [PMC free article] [PubMed] [Google Scholar]
- Pearson RCA, Esiri MM, Hiorns RW, Wilcock GK, Powell TP. Anatomical correlates of the distribution of the pathological changes in the neocortex in Alzheimer’s disease. Proc Natl Acad Sci USA. 1985;82(13):4531–4534. doi: 10.1073/pnas.82.13.4531. [DOI] [PMC free article] [PubMed] [Google Scholar]
- Prasad G, Jahanshad N, Aganj I, Lenglet C, Sapiro G, Toga AW, Thompson PM. Atlas-based fiber clustering for multi-subject analysis of high angular resolution diffusion imaging tractography. IEEE Int Symp Biomed Imaging. 2011a;2011:276–280. doi: 10.1109/ISBI.2011.5872405. [DOI] [PMC free article] [PubMed] [Google Scholar]
- Prasad G, Joshi SH, Jahanshad N, Villalon J, Aganj I, Lenglet C, Sapiro G, McMahon KL, de Zubicaray GI, Martin NG, Wright MJ, Toga AW, Thompson PM. White matter tract analysis in 454 adults using maximum density paths. MICCAI CDMRI. 2011b:2011. doi: 10.1016/j.neuroimage.2014.04.033. [DOI] [PMC free article] [PubMed] [Google Scholar]
- Prasad G, Joshi SH, Jahanshad N, Villalon J, Aganj I, Lenglet C, Sapiro G, McMahon KL, de Zubicaray GI, Martin NG, Wright MJ, Toga AW, Thompson PM. Shape analysis of white matter tracts via maximum density paths. NeuroImage. 2013a doi: 10.1016/j.neuroimage.2014.04.033. Accepted. [DOI] [PMC free article] [PubMed] [Google Scholar]
- Prasad G, Nir TM, Toga AW, Thompson PM ADNI. Tractography density and network measures in Alzheimer’s disease. Int Symp Biomed Imaging. 2013b doi: 10.1109/ISBI.2013.6556569. Accepted. [DOI] [PMC free article] [PubMed] [Google Scholar]
- Robnik-Šikonja M, Kononenko I. Theoretical and empirical analysis of ReliefF and RReliefF. Mach Learn. 2003;5:23–69. [Google Scholar]
- Rose SE, Chen F, Chalk JB, Zelaya FO, Strugnell WE, Benson M, Semple J, Doddrell DM. Loss of connectivity in Alzheimer’s disease: an evaluation of white matter tract integrity with colour coded MR diffusion tensor imaging. J Neurol Neurosurg Psychiatry. 2000;69(4):528–530. doi: 10.1136/jnnp.69.4.528. [DOI] [PMC free article] [PubMed] [Google Scholar]
- Schwarz CG, Reid RI, Gunter JL, Senjem ML, Przybelski SA, Zuk SM, Whitwell JL, Vemuri P, Josephs KA, Kantarci K, Thompson PM, Weiner MW, Petersen RC, Jack CR, Jr ADNI. Improved DTI registration allows voxel-based analysis that outperforms Tract-Based Spatial Statistics. Submitted to NeuroImage. 2013 Oct; doi: 10.1016/j.neuroimage.2014.03.026. [DOI] [PMC free article] [PubMed] [Google Scholar]
- Sjobeck M, Haglund M, Englund E. Decreasing myelin density reflected increasing white matter pathology in Alzheimer’s disease-a neuropathological study. Int J Geriatr Psychiatry. 2005;20(10):919–926. doi: 10.1002/gps.1384. [DOI] [PubMed] [Google Scholar]
- Smith SM. Fast robust automated brain extraction. Hum Brain Mapp. 2002;17(3):143–155. doi: 10.1002/hbm.10062. [DOI] [PMC free article] [PubMed] [Google Scholar]
- Smith SM, Jenkinson M, Johansen-Berg H, Rueckert D, Nichols TE, Mackay CE, Watkins KE, Ciccarelli O, Cader MZ, Matthews PM, Behrens TE. Tract-based spatial statistics: voxelwise analysis of multi-subject diffusion data. Neuroimage. 2006;31(4):1487–1505. doi: 10.1016/j.neuroimage.2006.02.024. [DOI] [PubMed] [Google Scholar]
- Stebbins GT, Murphy CM. Diffusion tensor imaging in Alzheimer’s disease and mild cognitive impairment. Behav Neurol. 2009;21(1):39–49. doi: 10.3233/BEN-2009-0234. [DOI] [PMC free article] [PubMed] [Google Scholar]
- Stahl R, Dietrich O, Teipel SJ, Hampel H, Reiser MF, Schoenberg SO. White matter damage in Alzheimer disease and mild cognitive impairment: assessment with diffusion- tensor MR imaging and parallel imaging techniques. Radiology. 2007;243(2):483–492. doi: 10.1148/radiol.2432051714. [DOI] [PubMed] [Google Scholar]
- Thompson PM, Hayashi KM, Dutton RA, Chiang MC, Leow AD, Sowell ER, de Zubicaray G, Becker JT, Lopez OL, Aizenstein HJ, Toga AW. Tracking Alzheimer’s disease. Ann N Y Acad Sci. 2007;1097:183–214. doi: 10.1196/annals.1379.017. [DOI] [PMC free article] [PubMed] [Google Scholar]
- Tong M, Kim Y, Zhan L, Sapiro G, Lenglet C, Mueller B, Thompson PM, Vese L. A variational model for denoising high angular resolution diffusion imaging data. Proc IEEE Int Symp Biomed Imaging. 2012;2012:530–533. doi: 10.1109/ISBI.2012.6235602. [DOI] [PMC free article] [PubMed] [Google Scholar]
- Tuch DS. Q-ball imaging. Magn Reson Med. 2004;52(6):1358–1372. doi: 10.1002/mrm.20279. [DOI] [PubMed] [Google Scholar]
- Tustison N, Avants B, Cook P, Kim J, Whyte J, Gee J, Stone J. Logical circularity in voxel-based analysis: Normalization strategy may induce statistical bias. Human Brain Mapping. 2012 doi: 10.1002/hbm.22211. Epub ahead of print. [DOI] [PMC free article] [PubMed] [Google Scholar]
- Wassermann D, Kanterakis E, Gur RC, Deriche R, Verma R. Diffusion-based population statistics using tract probability maps. Med Image Comput Comput Assist Interv. 2010;13(1):631–639. doi: 10.1007/978-3-642-15705-9_77. [DOI] [PubMed] [Google Scholar]
- Wee CY, Yap PT, Li W, Denny K, Browndyke JN, Potter GG, Welsh-Bohmer KA, Wang L, Shen D. Enriched white matter connectivity networks for accurate identification of MCI patients. Neuroimage. 2011;54(3):1812–1822. doi: 10.1016/j.neuroimage.2010.10.026. [DOI] [PMC free article] [PubMed] [Google Scholar]
- Zhan L, Leow AD, Zhu S, Barysheva M, Toga AW, McMahon KL, de Zubicaray GI, Wright MJ, Thompson PM. A novel measure of fractional anisotropy based on the tensor distribution function. Med Image Comput Comput Assist Interv. 2009;12(Pt 1):845–852. doi: 10.1007/978-3-642-04268-3_104. [DOI] [PubMed] [Google Scholar]
- Zhan L, Jahanshad N, Ennis DB, Jin Y, Bernstein MA, Borowski BJ, Jack CR, Jr, Toga AW, Leow AD, Thompson PM. Angular versus spatial resolution trade-offs for diffusion imaging under time constraints. Hum Brain Mapp. 2012 doi: 10.1002/hbm.22094. Accepted. [DOI] [PMC free article] [PubMed] [Google Scholar]