Monitoring of patients with critical neurologic illness has expanded significantly over the past several decades. Prior to the advent and application of technologies such as continuous EEG (electroencephalogram), intracranial pressure monitoring, brain tissue oxygenation and multimodal monitoring, the care of these critically ill patients relied on frequent clinical examinations to detect subtle changes that may signal an acute neurologic deterioration. This type of monitoring was limited by the availability of highly trained clinicians and nursing staff. The severity of the patient’s illness can also obscure clinical changes, and then the interventions taken in order to treat the illness, such as induced coma for status epilepticus or intracranial hypertension, could further mask the clinical signs that would be necessary for detection of an acute change. As the field of neuromonitoring advances, there is mounting evidence to show that we can predict subtle changes that will allow for timely intervention and treatment that can prevent deterioration and secondary injury.
Continuous Video EEG Monitoring
There are numerous applications for monitoring with electroencephalography (EEG) in the neurologic ICU, making it a standard component of any unit. Digital recording has been in practice since the 1970s1. As software and networking capabilities have advanced, a standard approach to the technical considerations and staffing requirements have been described. Reliable networks, connectivity between the ICU and other locations, EEG technologists and reviewers are all an essential part of ICU EEG monitoring2. The applications for EEG monitoring include: ruling out subclinical or nonconvulsive seizures, characterizing paroxysmal clinical events, detecting cerebral ischemia, guiding medication titration and quantifying seizure frequency in patients with status epilepticus3.
Seizures and Status Epilepticus
The indication for monitoring with continuous EEG (cEEG) for status epilepticus (SE) is well established. The mortality following SE has been listed as high as 22% at hospital discharge. Additionally, the incidence of nonconvulsive status epilepticus (NCSE) after an episode of convulsive status is as high as 48%4–6. Status epilepticus is defined as 5 or more minutes of continuous clinical and/or electrographic seizure activity, or as recurrent seizure activity without recovery in between. It is important to distinguish between convulsive status epilepticus (associated with rhythmic jerking of the extremities) and non-convulsive status epilepticus (seizure activity on EEG without associated clinical findings)6. This distinction is important when establishing treatment protocols, as debate still exists about how aggressively NCSE should be treated. The approach is largely guided by balancing the morbidity and mortality associated with status epilepticus and the potential for morbidity and mortality associated with aggressive treatment7.
The most common and well-recognized etiologies of convulsive status epilepticus are cerebrovascular disorders, brain trauma, infections, low anti-epileptic drug levels in patients with epilepsy, and inflammatory processes8. Early treatment of convulsive status is critical in preventing a continuation of seizures and the longer it takes to provide treatment, the more refractory the seizures become9. Given the high frequency of NCSE following convulsive status, the use of cEEG is strongly recommended6.
Nonconvulsive status is seen more frequently in ICU settings as cEEG monitoring has increased. Numerous reports show the frequency of NCSE is dependent on the etiology. The incidence of NCSE has been found to be as high as 37% in those admitted with altered mental status10,11. The importance of aggressive treatment of nonconvulsive seizures typically depends on the type of seizures. Animal models of absence status epilepticus, would suggest that there is minimal pathological damage from prolonged seizures12. There is a significant amount of evidence to suggest that severe neuronal damage from complex partial status epilepticus occurs and should therefore be treated more aggressively13.
The duration of cEEG monitoring for suspicion of convulsive or nonconvulsive seizures has been examined by Claasen et al. and shows that continuous monitoring has a sensitivity of approximately 80% after 24 hours of monitoring in comatose patients with increasing sensitivity after longer periods of monitoring14. The process of seizure detection is complicated and most frequently performed by a trained neurophysiologist. A detailed review of 24 hours of continuous video-EEG by direct observation has limitations. The availability of trained neurophysiologists is limited, but is essential to accurately interpret findings and exclude artifact. An extensive review of this nature can be time-consuming, with some estimates for an initial screening as high as 20 minutes, with a more detailed analysis taking much longer11. This type of review often cannot take place in real-time and significant delays from event to interpretation make responsive and expeditious treatment difficult.
With the advances in quantitative EEG monitoring, it becomes easier for the neurophysiologist or trained intensivist to visualize the frequency and duration of a patient’s seizures. Quantitative EEG is the application of mathematical and analytical techniques to analyze EEG frequencies11. Once verified with the raw EEG, these quantitative tools can be used to determine the frequency of seizures and to monitor the effects of anti-epileptic medications. When ICU nursing staff is properly trained to recognize these patterns, they can be used as an alerting mechanism for the intensivist in goal-directed therapy.
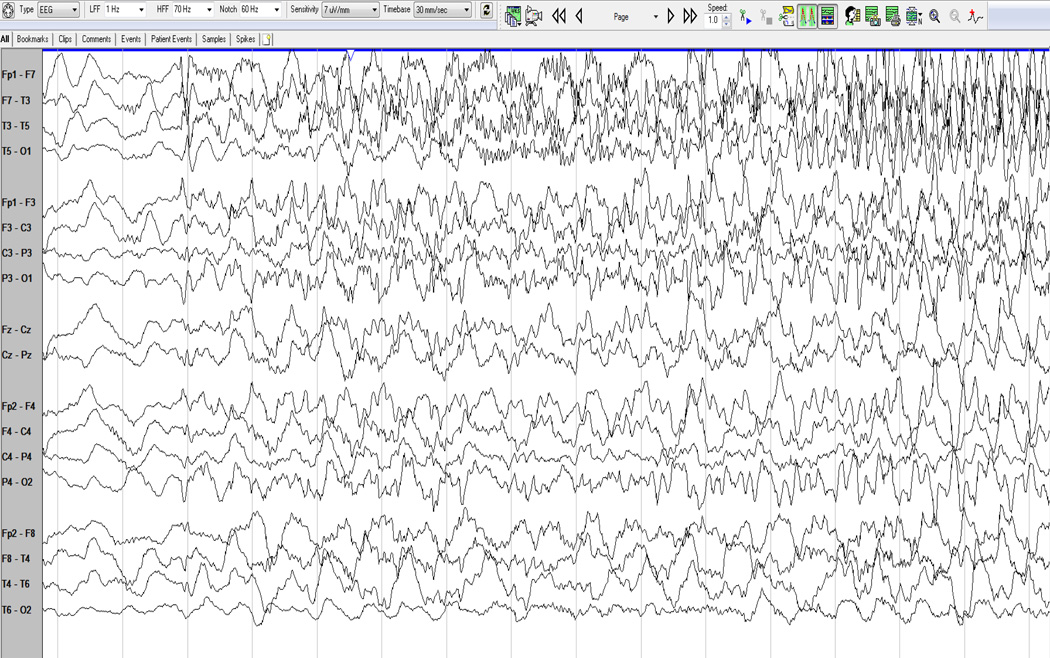
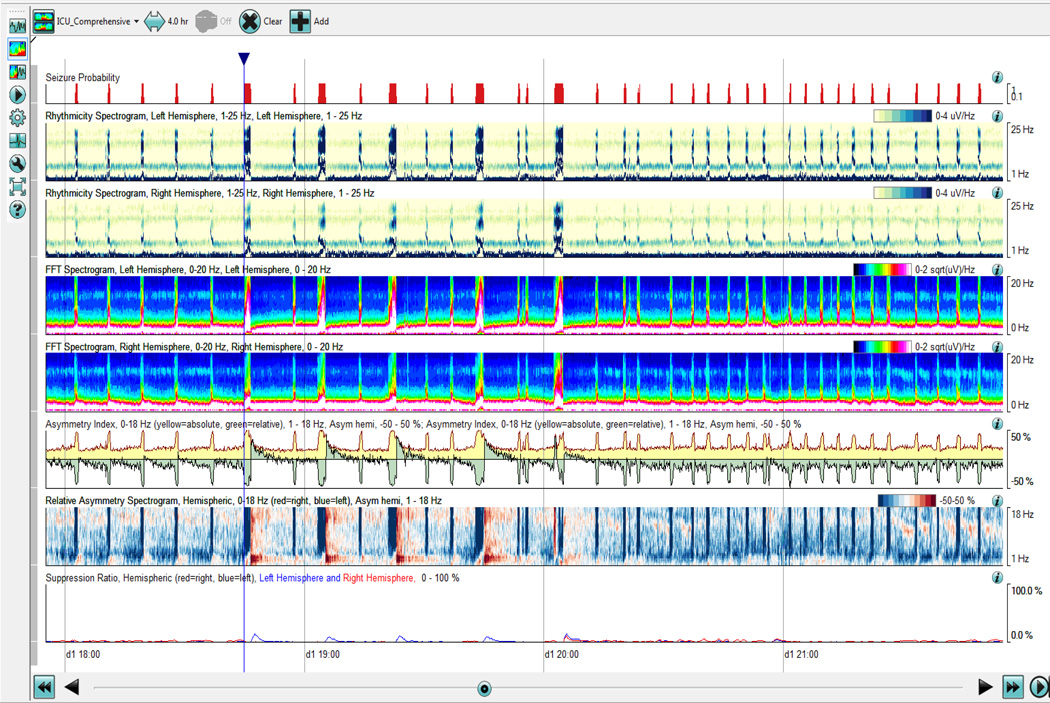
Several analytic tools have become available through commercial software to allow for visualizing compressed EEG over longer periods of time. When analyzing seizures, the analysis of rhythmicity with time along the x-axis and frequency along the y-axis are useful markers. Color scales are used as a measure of rhythmicity. (Fig 1 and Fig. 2, a proprietary algorithm from Persyst, Prescott, AZ) Seizure probability is derived from a seizure detection algorithm that makes a more complex integration of rhythmic patterns based on typical models on how seizures evolve. It is important to recognize that there are limitations to these computational models, especially in the ICU when rhythmic patterns can develop from ventilators, oral care and bed percussion, and may be false positives. It is still important to have verification by a trained neurophysiologist comparing the automated detections to the raw EEG recordings.
Fig. 1.
EEG (a 10–20 system with 21 electrodes) and displaying in an anatomical bipolar montage, the study above shows the onset of a seizure from the left hemisphere, initially characterized by fast activity which then spreads more broadly and slows as it increases in amplitude.
Fig. 2.
Quantitative EEG of a patient in status epilepticus. There are approximately 8–12 electrographic seizures that occur per hour as detected through the seizure probability algorithm (Persyst, Prescott, AZ).
In cases where seizures are difficult to control, EEG becomes essential in monitoring the level of sedation and effect of medication. It is strongly recommended that the cEEG findings guide therapy in patients with refractory status epilepticus6. During the initial phase of treatment, the frequency of seizures is used as a marker for efficacy of 1st and 2nd-line agents. If initial therapy has failed, the use of anesthetic agents is typically started, with medications titrated to the EEG findings. Typically the patient is placed into a burst suppression pattern with electrographic (cEEG) control for 24–48 hours with intermittent withdrawal of anesthetic agents. With the use of quantitative EEG tools, monitoring the depth of burst suppression has also become easier and trained personnel can perform bedside analysis.
Prognosis and Treatment of Seizures following Cardiac Arrest
Continuous EEG monitoring is used both to monitor for seizures and as a prognostic indicator in patients following cardiac arrest. Following several landmark studies on the use of hypothermia after cardiac arrest (HACA), many institutions developed advanced protocols for treatment, which included the use of paralytics in order to minimize shivering15–17. Shivering increases the metabolic rate and can be counterproductive to hypothermia18. The use of paralytics to control shivering can often mask the clinical signs of seizures in this population, which is at high risk. The frequency of seizures and nonconvulsive status epilepticus following cardiac arrest, and has been measured as high as 10–12%19,20. It has also been shown that status epilepticus following cardiac arrest is an independent predictor of poor outcome21. This finding may support the benefit of treating seizures in this population, however no controlled trials have validated this theory.
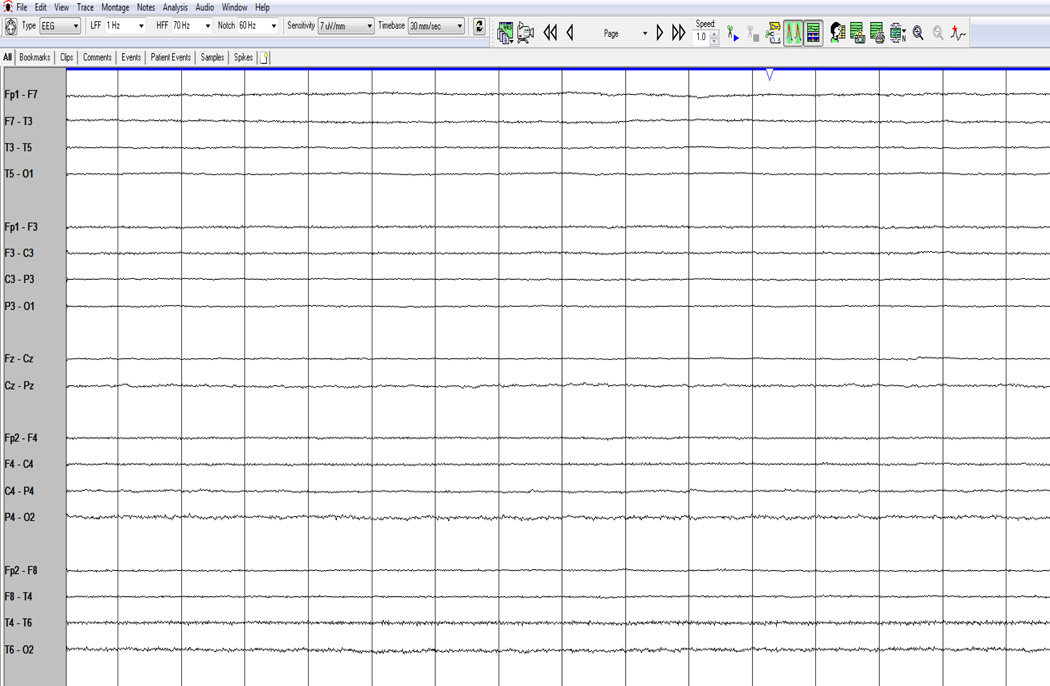
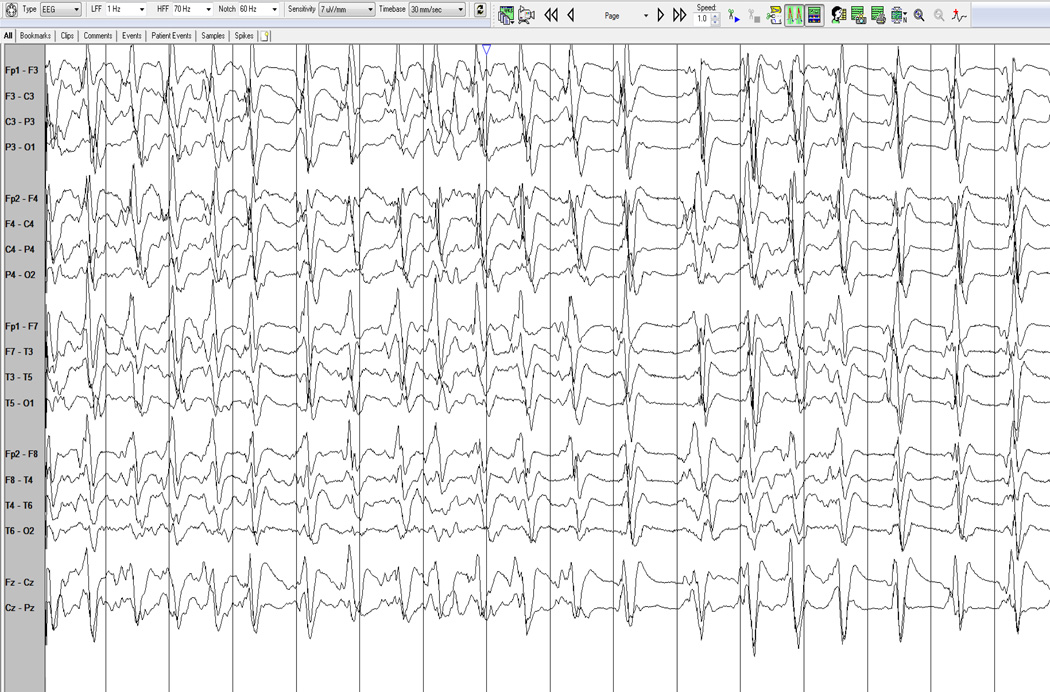
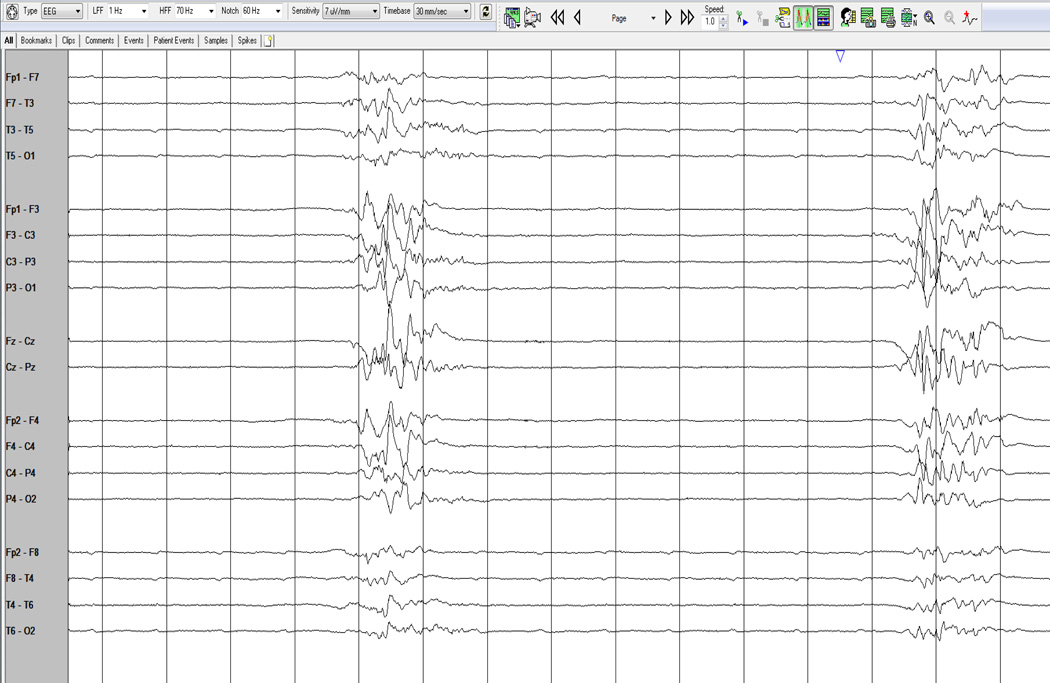
The evidence for the use of EEG for the purposes of prognosis following cardiac arrest has unfortunately been confounded by the use of different classification systems and timing of the EEG. Initial attempts classified EEG patterns into benign, undetermined and malignant22,23. The more malignant patterns of EEG are considered to be isoelectric and non-reactive, a burst suppression pattern and a pattern of generalized periodic discharges. (Fig 3–5)
Fig. 3.
An isoelectric, severely suppressed and nonreactive EEG.
Fig. 5.
Generalized periodic discharges.
In a recent practice parameter published by the American Academy of Neurology on the use of various markers to predict outcome following cardiac arrest, meta-analysis showed that these malignant patterns were associated with a poor outcome with a false-positive rate of 3%24. With the advent of hypothermia, much of the prognostic value of these malignant patterns is considered controversial, and determination of whether the EEG is reactive has been thought to be of more utility. The reactivity is defined as a “clear, reproducible change in background frequency (and mostly amplitude) following auditory or noxious stimulation, regardless of the appearance of epileptiform transients (stimulus-induced rhythmic, periodic, or ictal discharges), and categorized as present or absent.”25
Use of EEG for Detection of Ischemia and Vasospasm Monitoring
EEG has been studied as an intraoperative method to prevent neurologic morbidity during carotid endarterectomy (CEA) since the 1970s26. The utility of using EEG during CEA has been shown to decrease neurologic morbidity and mortality (2.3 to 1.1 %), as well as a reduce the frequency of carotid shunts27,28. EEG markers such as an increased in slow (delta) activity and decreases in amplitude can be seen as early predictors of ischemia that can then be reversed, preventing ischemic sequelae. The same concept has been transferred to the neurologic intensive care unit for monitoring vasospasm following subarachnoid hemorrhage.
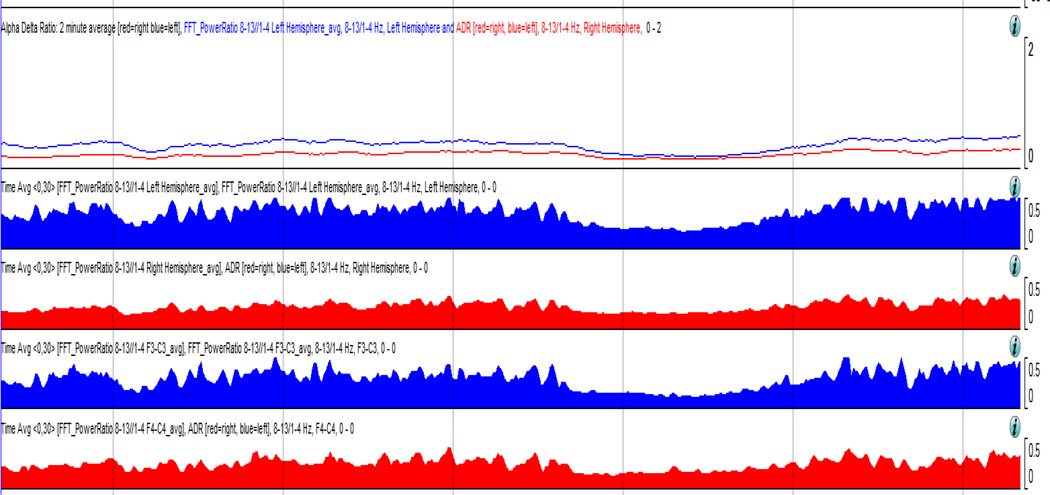
Patients with aneurysmal subarachnoid hemorrhage are at risk for significant secondary injury and experience symptomatic vasospasm and delayed cerebral ischemia in 20 to 40 % of cases29. In cases where clinical examination is limited, it can be challenging to detect a change and intervene in order to prevent infarction. Reductions in relative alpha variability on cEEG have also been shown to be an early marker of brain dysfunction which preceded the diagnosis of angiographically documented vasospasm by a mean of 2.9 days (SD 1.73)30. Claassen et al. examined the most sensitive EEG predictors for vasospasm in patients with poor grade (Hunt-Hess grade 4 or 5) subarachnoid hemorrhage. The alpha power/delta power, or alpha/delta ratio (ADR) is a quantitative EEG measure that looks at the absolute power of a respective frequency range on the EEG. An increase in delta frequency power becomes a sensitive indicator for the potential for cerebral ischemia31. (Fig 6)
Fig 6.
The alpha/delta ratio difference in cerebral ischemia seen over the right hemisphere.
Intracranial pressure monitoring
The basic principle of intracranial pressure (ICP) is based on the Monro-Kellie doctrine that there is a fixed volume within the enclosed skull that determines the pressure. The components that make up the volume are the parenchyma (80%), the cerebrospinal fluid (10%), and blood (10%). The individual components may change in various disease states (a hematoma, obstructive hydrocephalus), but without adequate compensation, there will be changes in intracranial pressure. One of the first and most critical considerations in monitoring intracranial pressure is recognizing what indications warrant placement of a device for this type of monitoring. Making the decision based purely on clinical grounds is typically not advised, and although the classically recognized Cushing’s triad (hypertension, bradycardia and apnea) is an indicator of intracranial hypertension, it is thought that this is likely a pre-terminal event32. An approach to deciding which disorders should be evaluated with intracranial pressure monitors is based on the conditions which typically result in ICP elevations (traumatic brain injury, aneurysmal subarachnoid hemorrhage, cerebellar strokes, encephalitis, and fulminant hepatic failure), a depressed level of consciousness, and evidence that aggressive treatment would result in an improved outcome.
Monitoring Devices
The standard ICP monitoring device is the external ventricular drainage (EVD) catheter, which is connected to a pressure-transducer. This is placed through a burr hole into the lateral ventricle. The device allows for both monitoring as well as drainage of CSF, which can be set at a determined level. This device has drawbacks, such as a high rate of infection (10 – 15% of patients)33. Placement of the device is typically done by a neurosurgeon. It is placed 1 cm anterior to the coronal suture in the midpupillary line with the drain directed towards the nose 5–7 cm deep on the nondominant side. The transducer is then set to a stopcock placed at the level of the patient’s ear.
Intraparenchymal monitors have some advantages in that they are easier to place, require minimal maintenance, and often have reliable waveforms. The drawbacks include the lack of ability to withdraw CSF, and increased cost34.
ICP Values and Waveforms
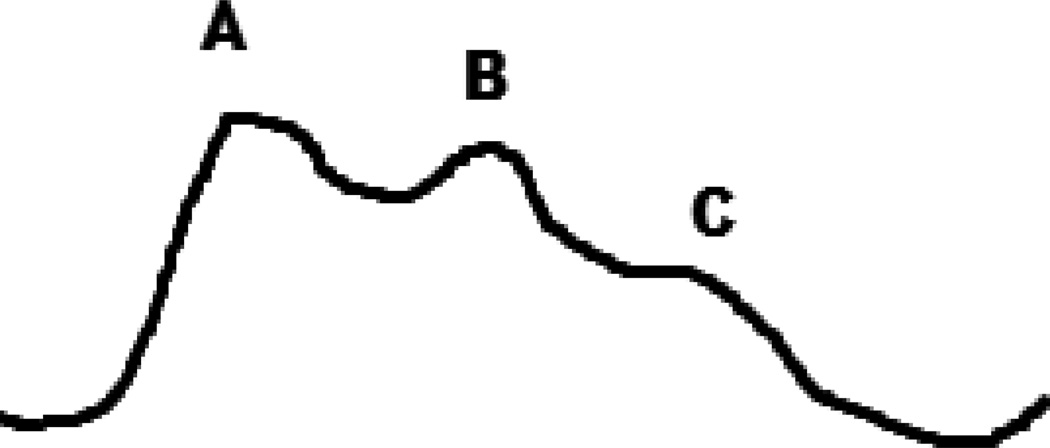
Elevated intracranial pressure (ICP) is defined as a sustained elevation greater than 20 mm Hg, however there are several variables including age, body posture and clinical conditions that can have effect on that range. Aggressive treatment is often started at 25 mm Hg35. During periods of ICP monitoring, there are patterns that can be seen within the waveform as trends over a longer period of time. The percussion wave is thought to originate from pulsations in the choroid plexus. The dicrotic wave is thought to be a reflection of pulsations from the major cerebral arteries followed by a tidal wave. (Fig 7) Following increases in intracranial pressure, there is an increase in the dicrotic and tidal waves beyond the percussion wave, which gives a more a rounded appearance. (Fig 8)
Fig 7.
A normal ICP waveform; A – percussion wave, B – dicrotic wave, C – tidal wave.
Fig 8.
Elevations in ICP produce reduced compliance.
Plateau waves (also known as Lundberg A waves) are the result of sudden increases in ICP by 50–100 mm Hg that can last for up to 20 minutes. These sudden and sustained increases can often be triggered by manipulations of the patient, and often reflect a deterioration in cerebral compliance34. The pathophysiology behind the etiology of plateau waves is thought to be related to autoregulation in response to elevations of cerebral perfusion pressure36.
Brain Tissue Oxygenation
Brain tissue oxygen tension (PbtO2) is a marker of the balance between oxygen delivery and oxygen consumption in the brain cells. Using a small electrode, the extracellular fluid is measured with normal values ranging from 25 – 35 mm Hg. Completed infarction or dead brain tissue typically has a value less than 5 mm Hg. It is the range between 5 and 25 mm Hg, which is thought to reflect possible regions that are at risk. Once determining regions at risk, there is a push to apply appropriate treatments to improve outcome. In a systematic review of the use of PbtO2 monitoring in traumatic brain injury, hypoxia (as defined as < 10 mm Hg) was associated with worse clinical outcomes and showed that the use of the devices was safe37. In studies of subarachnoid patients who had frequent decreases in the partial pressure of oxygen, their outcomes were worse38. Due to these findings, there is a recommendation from the Brain Trauma Foundation that PbtO2 is monitored, and that appropriate treatment strategies be instituted if the oxygen tension levels fall below 15 mm Hg39.
Cerebral Microdialysis
The placement of a miniature microdialysis catheter in the brain parenchyma can offer additional insight into the microenvironment and cellular metabolism. The commercial assays that are available include glucose, lactate, pyruvate, glycerol and glutamate, however multiple other substrates can be examined. Analysis is typically done in the parenchymal region that is considered to be at risk. Much of the literature to this point has been focused on looking at patients with subarachnoid hemorrhage and traumatic brain injury. Typical patterns which are consistent with ischemia would be diminished glucose and an increase in the lactate:pyruvate ratio40,41.
Multimodal Monitoring
Combining the methods discussed above could have potential to reveal even more clinical information about the brain injured patient and is being used to attempt to detect subtle changes that may occur prior to injury. This information may prove to have significant treatment implications. An example would be in the detection of patterns on cEEG monitoring which may or may not be electrographic seizures. With changes in oxygen tension and elevations in the lactate:pyruvate ratio, what may have been considered poorly defined EEG patterns with undetermined clinical significance could now correlate with evidence of tissue at risk42. Another clear example would be a pattern consistent with ischemia in a patient with subarachnoid hemorrhage. cEEG would show a decrease in the alpha/delta ratio (ADR) while brain tissue oxygenation would go down and the lactate:pyruvate ratio would increase43. Some centers are now using a combination of transcranial doppler (TCD) and cerebral perfusion pressure to extrapolate individualized cerebral autoregulation. These data could potentially help find individualized therapeutic targets for arterial blood pressure in the brain-injured patient44. The large amounts of data generated from this multimodal monitoring may reveal patterns consistent with tissue at risk that were previously undetected, and may result in bedside alerts that allow for more timely intervention.
Conclusions
The detection of clinical changes in the patient in the neurologic ICU has evolved over the past few decades to the point where we can now detect acute processes and potentially intervene prior to further deterioration. There is still a significant institutional difference in how monitoring applications can be used in the neuro-ICU. The use of continuous EEG for status epilepticus is considered the standard of care, whereas more experimental techniques such as vasospasm monitoring with cEEG and cerebral microdialysis are still considered experimental, but may provide further insight into tissue at risk for further injury in the future. Development of specialized neurologic intensive care units has propelled the field of neuromonitoring, which will likely continue to grow over the next few decades.
Fig. 4.
A burst-suppression pattern seen on EEG.
Contributor Information
Andrew C. Schomer, Neurocritical Care, Department of Neurology, University of Virginia, Charlottesville, VA, acs8bd@virginia.edu, Phone/Fax: 434-924-2706.
Khalid Hanafy, Harvard Medical School, Department of Neurology, Beth Israel Deaconess Medical Center, Harvard Medical, School, Boston, MA, khanafy@bidmc.harvard.edu, Phone/Fax: 617-667-5853/617-667-2987.
REFERENCES
- 1.Ives J, Thompson C, Gloor P. Seizure monitoring: A new tool in electroencephalography. Electroencephalogr. Clin. Neurophysiol. 1976;41:422–427. doi: 10.1016/0013-4694(76)90106-1. [DOI] [PubMed] [Google Scholar]
- 2.Kull LL, Emerson RG. Continuous EEG monitoring in the intensive care unit: technical and staffing considerations. J. Clin. Neurophysiol. 2005;22:107–118. doi: 10.1097/01.wnp.0000158361.24544.2d. [DOI] [PubMed] [Google Scholar]
- 3.Lee Kiwon M, Shweihat Yousef M, Abouzgheib Wissam M, Pratter Melvin RM, Bartter Thaddeus M. The NeuroICU Book. McGraw-Hill; 2012. pp. 743–745. [Google Scholar]
- 4.Treiman DM, et al. A comparison of four treatments for generalized convulsive status epilepticus. Veterans Affairs Status Epilepticus Cooperative Study Group. N. Engl. J. Med. 1998;339:792–798. doi: 10.1056/NEJM199809173391202. [DOI] [PubMed] [Google Scholar]
- 5.DeLorenzo RJ, et al. Persistent nonconvulsive status epilepticus after the control of convulsive status epilepticus. Epilepsia. 1998;39:833–840. doi: 10.1111/j.1528-1157.1998.tb01177.x. [DOI] [PubMed] [Google Scholar]
- 6.Brophy GM, et al. Guidelines for the evaluation and management of status epilepticus. Neurocrit Care. 2012;17:3–23. doi: 10.1007/s12028-012-9695-z. [DOI] [PubMed] [Google Scholar]
- 7.Drislane F, Kaplan P. Nonconvulsive Status Epilepticus. Demos Medical Publishing, LLC; 2009. [Google Scholar]
- 8.Trinka E, Hofler J, Zerbs A. Causes of status epilepticus. Epilepsia. 2012;53:127–138. doi: 10.1111/j.1528-1167.2012.03622.x. [DOI] [PubMed] [Google Scholar]
- 9.Goodkin H, Sun C, Yeh J, Mangan P, Kapur J. GABAA receptor internalization during seizures. Epilepsia. 2007;48:109–113. doi: 10.1111/j.1528-1167.2007.01297.x. [DOI] [PubMed] [Google Scholar]
- 10.Friedman D, Claassen J, Hirsch LJ. Continuous electroencephalogram monitoring in the intensive care unit. Anesth. Analg. 2009;109:506–523. doi: 10.1213/ane.0b013e3181a9d8b5. [DOI] [PubMed] [Google Scholar]
- 11.Laroche SM. Handbook of ICU EEG Monitoring. Demos Medical Publishing, LLC; 2013. [Google Scholar]
- 12.Wong M, Wozniak DF, Yamada KA. An animal model of generalized nonconvulsive status epilepticus: Immediate characteristics and long-term effects. Exp. Neurol. 2003;183:87–99. doi: 10.1016/s0014-4886(03)00099-2. [DOI] [PubMed] [Google Scholar]
- 13.Walker MC, White HS, Sander JWAS. Disease modification in partial epilepsy. Brain. 2002;125:1937–1950. doi: 10.1093/brain/awf203. [DOI] [PubMed] [Google Scholar]
- 14.Claassen J, Mayer Sa, Kowalski RG, Emerson RG, Hirsch LJ. Detection of electrographic seizures with continuous EEG monitoring in critically ill patients. Neurology. 2004;62:1743–1748. doi: 10.1212/01.wnl.0000125184.88797.62. [DOI] [PubMed] [Google Scholar]
- 15.Bernard SA, Jones BM, Horne MK. Clinical trial of induced hypothermia in comatose survivors of out-of-hospital cardiac arrest. Ann. Emerg. Med. 1997;30:146–153. doi: 10.1016/s0196-0644(97)70133-1. [DOI] [PubMed] [Google Scholar]
- 16.Yanagawa Y, et al. Preliminary clinical outcome study of mild resuscitative hypothermia after out-of-hospital cardiopulmonary arrest. Resuscitation. 1998;39:61–66. doi: 10.1016/s0300-9572(98)00118-x. [DOI] [PubMed] [Google Scholar]
- 17.Zeiner A, et al. Mild resuscitative hypothermia to improve neurological outcome after cardiac arrest. A clinical feasibility trial. Hypothermia After Cardiac Arrest (HACA) Study Group. Stroke. 2000;31:86–94. doi: 10.1161/01.str.31.1.86. [DOI] [PubMed] [Google Scholar]
- 18.Badjatia N, et al. Predictors and clinical implications of shivering during therapeutic normothermia. Neurocrit. Care. 2007;6:186–191. doi: 10.1007/s12028-007-0011-2. [DOI] [PubMed] [Google Scholar]
- 19.Legriel S, et al. Early EEG monitoring for detecting postanoxic status epilepticus during therapeutic hypothermia: A pilot study. Neurocrit. Care. 2009;11:338–344. doi: 10.1007/s12028-009-9246-4. [DOI] [PubMed] [Google Scholar]
- 20.Rittenberger JC, Popescu A, Brenner RP, Guyette FX, Callaway CW. Frequency and timing of nonconvulsive status epilepticus in comatose post-cardiac arrest subjects treated with hypothermia. Neurocrit. Care. 2012;16:114–122. doi: 10.1007/s12028-011-9565-0. [DOI] [PMC free article] [PubMed] [Google Scholar]
- 21.Rossetti aO, et al. Status epilepticus: an independent outcome predictor after cerebral anoxia. Neurology. 2007;69:255–260. doi: 10.1212/01.wnl.0000265819.36639.e0. [DOI] [PubMed] [Google Scholar]
- 22.Synek VM. Prognostically important EEG coma patterns in diffuse anoxic and traumatic encephalopathies in adults. J. Clin. Neurophysiol. 1988;5:161–174. doi: 10.1097/00004691-198804000-00003. [DOI] [PubMed] [Google Scholar]
- 23.Scollo-Lavizzari G, Bassetti C. Prognostic value of EEG in post-anoxic coma after cardiac arrest. Eur. Neurol. 1987;26:161–170. doi: 10.1159/000116329. [DOI] [PubMed] [Google Scholar]
- 24.Wijdicks EFM, Hijdra a, Young GB, Bassetti CL, Wiebe S. Practice parameter: prediction of outcome in comatose survivors after cardiopulmonary resuscitation (an evidence-based review): report of the Quality Standards Subcommittee of the American Academy of Neurology. Neurology. 2006;67:203–210. doi: 10.1212/01.wnl.0000227183.21314.cd. [DOI] [PubMed] [Google Scholar]
- 25.Rossetti AO, Oddo M, Logroscino G, Kaplan PW. Prognostication after cardiac arrest and hypothermia: a prospective study. Ann. Neurol. 2010;67:301–307. doi: 10.1002/ana.21984. [DOI] [PubMed] [Google Scholar]
- 26.Chiappa KH, Burke SR, Young RR. Results of electroencephalographic monitoring during 367 carotid endarterectomies. Use of a dedicated minicomputer. Stroke. 1979;10:381–388. doi: 10.1161/01.str.10.4.381. [DOI] [PubMed] [Google Scholar]
- 27.Cho I, Smullens SN, Streletz LJ, Fariello RG. The value of intraoperative monitoring during carotid endarterectomy: a comment. Ann. Neurol. 1987;22:283–284. doi: 10.1002/ana.410200411. [DOI] [PubMed] [Google Scholar]
- 28.Plestis KA, et al. Continuous electroencephalographic monitoring and selective shunting reduces neurologic morbidity rates in carotid endarterectomy. J. Vasc. Surg. Off. Publ. Soc. Vasc. Surg. [and] Int. Soc. Cardiovasc. Surgery, North Am. 1997;Chapter 25:620–628. doi: 10.1016/s0741-5214(97)70287-8. [DOI] [PubMed] [Google Scholar]
- 29.Frontera JA, et al. Prediction of symptomatic vasospasm after subarachnoid hemorrhage: The modified fisher scale. Neurosurgery. 2006;59:21–26. doi: 10.1227/01.neu.0000243277.86222.6c. [DOI] [PubMed] [Google Scholar]
- 30.Vespa PM, et al. Early detection of vasospasm after acute subarachnoid hemorrhage using continuous EEG ICU monitoring. Electroencephalogr. Clin. Neurophysiol. 1997;103:607–615. doi: 10.1016/s0013-4694(97)00071-0. [DOI] [PubMed] [Google Scholar]
- 31.Claassen J, et al. Quantitative continuous EEG for detecting delayed cerebral ischemia in patients with poor-grade subarachnoid hemorrhage. Clin. Neurophysiol. 2004;115:2699–2710. doi: 10.1016/j.clinph.2004.06.017. [DOI] [PubMed] [Google Scholar]
- 32.Fitch W, McDowall DG, Keaney NP, Pickerodt VWA. Systemic vascular responses to increased intracranial pressure. J. Neurol. Neurosurg. Psychiatry. 1977:843–852. doi: 10.1136/jnnp.40.9.843. [DOI] [PMC free article] [PubMed] [Google Scholar]
- 33.Mayhall CG, et al. Ventriculostomy-related infections. A prospective epidemiologic study. N. Engl. J. Med. 1984;310:553–559. doi: 10.1056/NEJM198403013100903. [DOI] [PubMed] [Google Scholar]
- 34.Wijdicks EF. The Practice of Emergency and Critical Care Neurology. Oxford University Press, Inc; 2010. [Google Scholar]
- 35.Czosnyka M. Monitoring and interpretation of intracranial pressure. J. Neurol. Neurosurg. Psychiatry. 2004;75:813–821. doi: 10.1136/jnnp.2003.033126. [DOI] [PMC free article] [PubMed] [Google Scholar]
- 36.Rosner MJ, Becker DP. Origin and evolution of plateau waves. Experimental observations and a theoretical model. J. Neurosurg. 1984;60:312–324. doi: 10.3171/jns.1984.60.2.0312. [DOI] [PubMed] [Google Scholar]
- 37.Maloney-Wilensky E, et al. Brain tissue oxygen and outcome after severe traumatic brain injury: a systematic review. Crit. Care Med. 2009;37:2057–2063. doi: 10.1097/CCM.0b013e3181a009f8. [DOI] [PubMed] [Google Scholar]
- 38.Kett-White R, et al. Adverse cerebral events detected after subarachnoid hemorrhage using brain oxygen and microdialysis probes. Neurosurgery. 2002;50:1213–1221. doi: 10.1097/00006123-200206000-00008. discussion 1221–2. [DOI] [PubMed] [Google Scholar]
- 39.Bratton SL, et al. Guidelines for the management of severe traumatic brain injury. XIV. Hyperventilation. J. Neurotrauma. 2007;24(Suppl 1):S87–S90. doi: 10.1089/neu.2007.9982. [DOI] [PubMed] [Google Scholar]
- 40.Zauner A, et al. Continuous monitoring of cerebral substrate delivery and clearance: initial experience in 24 patients with severe acute brain injuries. Neurosurgery. 1997;41:1082–1091. doi: 10.1097/00006123-199711000-00011. discussion 1091–1093. [DOI] [PubMed] [Google Scholar]
- 41.Hillered L, Vespa PM, Hovda DA. Translational neurochemical research in acute human brain injury: the current status and potential future for cerebral microdialysis. J. Neurotrauma. 2005;22:3–41. doi: 10.1089/neu.2005.22.3. [DOI] [PubMed] [Google Scholar]
- 42.Claassen J. How I treat patients with EEG patterns on the ictal-interictal continuum in the neuro ICU. Neurocrit. Care. 2009;11:437–444. doi: 10.1007/s12028-009-9295-8. [DOI] [PubMed] [Google Scholar]
- 43.Hlatky R, Valadka AB, Goodman JC, Contant CF, Robertson CS. Patterns of energy substrates during ischemia measured in the brain by microdialysis. J. Neurotrauma. 2004;21:894–906. doi: 10.1089/0897715041526195. [DOI] [PubMed] [Google Scholar]
- 44.Budohoski KP, et al. Monitoring cerebral autoregulation after head injury. Which component of transcranial Doppler flow velocity is optimal? Neurocrit. Care. 2012;17:211–218. doi: 10.1007/s12028-011-9572-1. [DOI] [PubMed] [Google Scholar]


