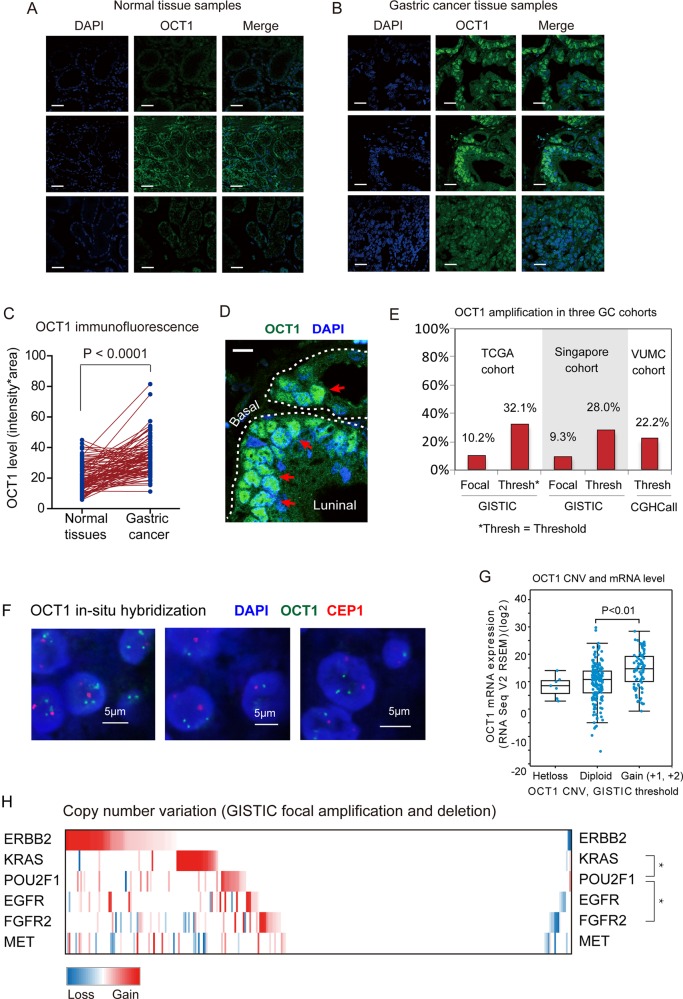
Figure 1.
Amplification and overexpression of octamer transcription factor 1 (OCT1) gene in gastric cancer (GC). (A) Expression of OCT1 in normal gastric tissues as determined by immunofluorescence. Scale bars indicate 10µm in all panels. (B) Immunostain of OCT1 in gastric cancer tissues. (C) Statistical analysis of OCT1 expression in normal and GC tissues (P<0.0001, Mann Whitney test). (D) The immunofluorescent image shows OCT1 (in green) and cell nucleus (in blue)OCT1 is strongly expressed in the cell nucleus (red arrows). (E) The frequency of OCT1 amplification in three independent GC cohorts as indicated. (F) OCT1 genomic amplification confirmed by fluorescence in-situ hybridization (FISH) assay. Green signals indicate the OCT1 FISH probe, and red signals probe to centremore 1. Scale bars indicate 5µm in all panels. (G) OCT1 mRNA levels were significantly higher in samples with OCT1 gained CNA compared with the samples without CNV in the TCGA dataset (P<0.01, 2-sided t-test). (H) Relationship between the CNVs of OCT1 and frequently altered genes in Receptor tyrosine kinase (RTK) pathway. The mutual exclusivity between the CNVs of OCT1 (POU2F1) and other genes was determined by dimension reduction permutation (DRP) algorithm (*P<0.05).

