

Abstract
People who are food and nutrition insecure largely reside in Asia and Sub-Saharan Africa and for many, fish represents a rich source of protein, micronutrients and essential fatty acids. The contribution of fish to household food and nutrition security depends upon availability, access and cultural and personal preferences. Access is largely determined by location, seasonality and price but at the individual level it also depends upon a person's physiological and health status and how fish is prepared, cooked and shared among household members. The sustained and rapid expansion of aquaculture over the past 30 years has resulted in >40% of all fish now consumed being derived from farming. While aquaculture produce increasingly features in the diets of many Asians, it is much less apparent among those living in Sub-Saharan Africa. Here, per capita fish consumption has grown little and despite the apparently strong markets and adequate biophysical conditions, aquaculture has yet to develop. The contribution of aquaculture to food and nutrition security is not only just an issue of where aquaculture occurs but also of what is being produced and how and whether the produce is as accessible as that from capture fisheries. The range of fish species produced by an increasingly globalized aquaculture industry differs from that derived from capture fisheries. Farmed fishes are also different in terms of their nutrient content, a result of the species being grown and of rearing methods. Farmed fish price affects access by poor consumers while the size at which fish is harvested influences both access and use. This paper explores these issues with particular reference to Asia and Africa and the technical and policy innovations needed to ensure that fish farming is able to fulfil its potential to meet the global population's food and nutrition needs.
Keywords: fish farming, food security, poverty and hunger
Introduction
On the somewhat nominal date of 31 October 2011, the world human population was deemed to have reached 7 billion (7 × 10⁹), prompting speculation as to whether everyone on the planet can be adequately fed. That currently a poor job of it is being made is not in dispute: the number of people estimated to be undernourished in 2010 was close to 1 billion (FAO, 2011a). The most obvious signs of undernutrition are mortality, morbidity, stunting, underweight and wasting. Less immediately apparent are the effects on immune function, cognitive ability and work productivity, with profound effects at individual, family and societal levels (Underwood, 2000; Caulfield et al., 2006; Grantham-McGregor, 2007; Ruel et al., 2008). It is estimated that maternal and child undernutrition accounts for 11% of total global disability-adjusted life years (DALY; a measure of overall disease burden, expressed as the numbers of years lost due to ill-health, disability or early death), with dire consequences for development (Black et al., 2008).
Without action, the situation can only worsen. By 2050, it is anticipated that the global population will rise to 9 billion (UN Department of Economic and Social Affairs, Population Division, 2011). Satisfying the food and nutrition needs of the growing population, let alone its demands, is likely to require a profound change in what and how much is eaten, and where and how food is produced. Failure to do so could profoundly affect the biosphere in ways that further erode the life-support system through biodiversity loss, changes in ecosystem services supply and exacerbated global warming (Battisti & Naylor, 2009; Foley et al., 2011; Phalan et al., 2011; Royal Society, 2012).
In 2009, c. 95 × 106 t of fishes were consumed by humans (FAO, 2012b; FAO–FISHSTAT, 2012). More than 1 billion poor people obtain most of their average per capita intake of animal protein from fish (Tacon & Metian, 2009). The importance of fish is highlighted by a consideration of Africa. FAO data for 2009 (updated with data from Tacon & Metian, 2009) show that Africa has the lowest average per capita supply of total energy (10 711 kJ day−1), protein (66·6 g day−1), non-fish animal protein (15·1 g day−1) and fish protein (9·2 kg year−1) of any region (FAO–FAOSTAT, 2013). Nevertheless, fish contributed 9% of total animal energy intake here, the highest of any region, and 18% of total animal protein consumption (second only to Asia at 19%).
Global wild fish catches have for some time been at or near the limits of what aquatic ecosystems can be expected to naturally provide (FAO, 2012a; UNHRC, 2012). Meeting the world's demand for fish has thus depended on the spectacular growth of aquaculture. In 2011, c. 41% of fish consumed came from farming (FAO, 2012b; FAO–FISHSTAT, 2012). A growing body of research studies shows the importance of fish in the supply of not only protein but also more importantly of essential fatty acids and micronutrients (Kawarazuka & Béné, 2011). The importance of fish as a rich source of essential fats, crucial for brain development and cognition, is highlighted in the implementation of the scaling up nutrition framework and roadmap [a private and public sector and civil society partnership that seeks to better understand the crisis of undernutrition in early life (first 1000 days) and elevate nutrition on the global agenda; http://www.scalingupnutrition.org].
Discussion of the rise of aquaculture has largely focused on its contribution to global aquatic animal food supplies, largely ignoring the resultant changes in species composition of the fishes consumed or how it is farmed and the consequences for food and nutrition security (Kawarazuka & Béné, 2010; UNHRC, 2012). This paper sets out to redress the situation and considers the technological and policy innovations needed to ensure that fish cultivation fulfils its potential to meet the global population's food and nutrition needs. This paper focuses on fishes that account for two-thirds of gross global aquatic animal source food supplies, and make particular reference to Africa and Asia.
Fish, food and nutrition security
Fish is an excellent source of high quality animal protein and essential fatty acids, especially long-chain polyunsaturated fatty acids (LCPUFA) and micronutrients, which are much greater in fishes than in terrestrial animal-source foods (Table 1). Drawing on such evidence, a recent FAO–WHO expert consultation group concluded that among the general population, fish consumption is beneficial for individual growth and development, while consumption of certain amount of fish (fatty fishes in particular) is associated with reduced risk of coronary heart disease and stroke (FAO–WHO, 2011). People are generally encouraged to increase consumption of fatty fishes two to three-fold in order to obtain sufficient quantities of LCPUFAs (Surette, 2008; Jenkins et al., 2009; FAO–WHO, 2011). Food-safety concerns about fish have centred on methylmercury and dioxin levels. There is no convincing evidence, however, for increased risk of heart disease linked with methylmercury while the potential cancer risks from dioxins are concluded to be well below coronary heart disease benefits associated with fish consumption (FAO–WHO, 2011).
Table 1.
Nutrient content of selected fishes and other foods (modified from Kawarazuka & Béné, 2011). Where no figure is given, no analysis was carried out
| Common name and species | Protein (g) | Fat | Ca (mg) | Fe (mg) | Zn (mg) | Vitamin A (RAE)* | Notes | ||||
|---|---|---|---|---|---|---|---|---|---|---|---|
| Total lipid (g) | Total saturated fat (g) | Total PUFA (g) | EPA (g) | DHA (g) | |||||||
| Large freshwater fishes | |||||||||||
| Common carp Cyprinus carpio | 17.83 | 5.60 | 1.08 | 1.43 | 0.24 | 0.11 | 41 | 1.24 | 1.48 | 9 | Raw, edible |
| Tilapia Oreochromis spp. | 20.80 | 1.70 | 0.77 | 0.48 | 0.01 | 0.11 | 10 | 0.56 | 0.33 | 0 | Raw, edible |
| Small freshwater fishes | |||||||||||
| Climbing perch Anabas testudineus | 0.99 | 0.34 | 0.38 | 0 | 0.09 | Raw, whole, Thailand | |||||
| Kanthtrawb Helostoma temmincki | 432 | 5.30 | 6.5 | 100–500 | Raw, edible, cleaned parts, Cambodia | ||||||
| Mola Amblypharyngodon mola | 776 | 5.70 | 3.20 | >2680 | Raw, edible, Bangladesh | ||||||
| Marine fishes | |||||||||||
| Anchovy Engraulis spp. | 20.35 | 4.84 | 1.28 | 1.64 | 0.54 | 0.91 | 147 | 3.25 | 1.72 | 15 | Raw, edible, Europe |
| Mackerel Scomber scombrus | 18.60 | 13.89 | 3.26 | 3.35 | 0.90 | 1.40 | 12 | 1.63 | 0.63 | 50 | Raw, edible |
| Milkfish Chanos chanos | 20.53 | 6.73 | 1.67 | 1.84 | 51 | 0.32 | 0.82 | 30 | Raw, edible, Philippines | ||
| Other animal source foods | |||||||||||
| Beef | 14.30 | 30.00 | 11.29 | 0.70 | 24 | 1.64 | 3.57 | 0 | Raw, ground, 70% lean meat, 30% fat | ||
| Chicken | 14.7 | 15.75 | 3.26 | 3.34 | 19 | 1.11 | 0.78 | 0 | Uncooked breast fillet | ||
| Cow's milk | 3.28 | 3.66 | 2.28 | 0.14 | 119 | 0.05 | 0.37 | 33 | 3.7% milk fat | ||
| Plant source foods | |||||||||||
| Cassava | 1.40 | 0.28 | 0.28 | 0.05 | 16 | 0.27 | 0.34 | 1 | Raw | ||
| Kidney beans | 8.67 | 0.09 | 0.09 | 0.28 | 35 | 2.22 | 0.86 | 0 | Mature, cooked | ||
| Rice | 2.69 | 0.28 | 0.28 | 0.32 | 10 | 1.20 | 0.49 | 0 | White, long-grained, regular, cooked | ||
| Spinach | 2.86 | 0.39 | 0.39 | 0.17 | 99 | 2.71 | 0.53 | 469 | Raw | ||
PUFA, polyunsaturated fatty acid; EPA, eicosapentaenoic acid; DHA, docosahexaenoic acid.
Retinol activity equivalent.
The benefits of fish consumption for vulnerable groups are also increasingly recognized and there is a growing interest in its potential to better contribute to food and nutrition security objectives through supplemental feeding and other food-based strategies (Roos et al., 2002, 2007c; Gibson et al., 2003). A controlled study in Malawi, for example, showed that individuals fed intervention diets containing significantly more soft-boned fishes had lower incidences of anaemia and common infections than those in the control group (Gibson et al., 2003).
Recognizing that eating fish is beneficial and encouraging people to do so are clearly insufficient to overcome undernutrition; issues of food availability, food access and food utilization must also be addressed. These imperatives are codified in the definition of food security adopted by the World Food Summit in 1996, which states that food security exists when ‘all people, at all times, have physical and economic access to sufficient, safe and nutritious food to meet their dietary needs and food preferences for an active and healthy life’. The term ‘food and nutrition security’ incorporates the other pillars of good nutrition: care, health, hygiene water and sanitation (Klennert, 2009).
A conceptual model showing how nutritional status is determined by these various causal factors is presented in Fig. 1. Individual nutritional status can be seen as an immediate outcome of nutrient intake, care and health. Nutrient intake is, in turn, governed by use and utilization, the former being dependent upon the food that is purchased by and shared within households, while the latter refers to the body's ability to utilize the nutrients consumed. The underlying causes of health status are in part not only environmental, determined by factors such as air quality, but also related to health care, housing, sanitation and access to clean water, sometimes worsened by inadequate nutrition, which predisposes individuals to disease. Availability and access to food and nutrients, however, change over time and adequacy of dietary intake is affected by critical life stages such as pregnancy, lactation and early childhood.
Fig 1.

Determinants of nutritional status (modified from UNICEF, 1991; Kawarazuka & Béné, 2010).
For a comprehensive analysis of food and nutrition security, all of the contributory factors shown in Fig. 1 must be considered. In the context of the implications of increasing aquaculture production, however, it is its potential as a driver of change in availability (abundance), access and the nutritional quality of fish being produced that warrants particular attention.
Availability, access, use and utilization
Availability
The availability of food-fish is a function of production and trade, less that used for non-food purposes. The term food-fish is applied here exclusively to fish and does not include shellfish, as is usually the case, used directly for human consumption. Unless otherwise stated, FAO data for 2009 (FAO–FAOSTAT, 2013) is used as the most recent set of figures that allows calculation of regional per capita food-fish supplies (excluding molluscs and crustaceans) in which fish imports and exports can also be taken into account.
Global fish supplies continue to expand, primarily as a result of the sustained, rapid growth in aquaculture production. Supplies of food-fish from capture and farming increased by c. 62%, from 8·6 to 13·9 kg year−1, between 1961 and 2009 (Fig. 2). Increases during the 1960s–1980s were largely due to increased capture fisheries landings while those since are largely attributable to aquaculture.
Fig 2.
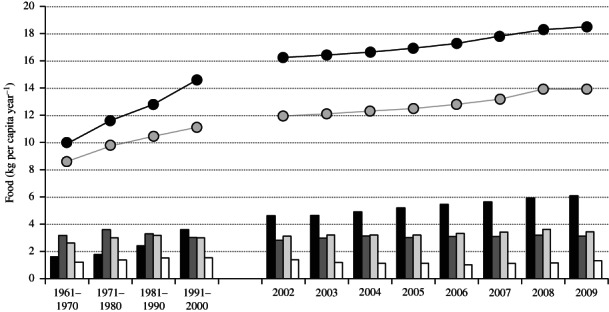
Per capita aquatic food ( , total fish and aquatic resources;
  , total fish) and fishes by species group (
 , freshwater and diadromous fishes;
  , demersal fishes;
  , pelagic fishes;
  , marine fishes) by decade (1961–2001) and by year (2002–2009). Data from FAO (2011b) and FAO–FAOSTAT (2013).
The statistics, however, mask enormous inter-regional differences in production and trade (Table 2). Asia, including China, accounts for c. 90% of global aquaculture production while production in least developed countries is <1% (FAO, 2012a). Seafood is the most highly traded food commodity internationally and exports of seafood from developing countries exceed the total value of coffee, cocoa, tea, tobacco, meat and rice combined (Smith et al., 2010; Deutsch et al., 2011). Trade increased in value by an average of nearly 11% per annum between 1976 and 2009 (FAO, 2012b). The effect of trade on food-fish availability at regional level can be assessed from the FAO food-fish balance statistics that account for production plus imports, minus fish used for non-food uses (e.g. fishmeal) and exports (FAO–FISHSTAT, 2012). The data for 2009 show that regional per capita food-fish supplies are greatest in Oceania (18·9 kg year−1), followed by Europe (17·4 kg year−1) and Asia (15·0 kg year−1), with Africa (9·2 kg year−1) trailing last (Table 2). High food-fish availability in North America and Europe is in part sustained by net imports from Asian countries such as China and Vietnam, accounting for >20 and 26% of supplies in North America and Europe, respectively (FAO–FISHSTAT, 2012). Low production costs and relatively high international prices, combined with liberal trade policies, have increased exports of farmed white-fleshed fishes such as tilapia Oreochromis spp. and catfishes Pangasius spp., substituting for dwindling supplies from domestic white-fish fisheries (Norman-López & Bjorndal, 2009; Beveridge et al., 2010; Little et al., 2012). Even Africa is a net food-fish importer, imports of mainly cheap, oily pelagic fishes increasing net food-fish availability by 14%.
Table 2.
Total and per capita food-fish supplies by region and economic grouping, 2009 (from FAO, 2011b; FAO–FISHSTAT, 2012)
| Total food-fish supply (×106 t live mass equivalent) | Per capita food-fish supply (kg year−1) | |
|---|---|---|
| World | 92·1 | 13·9 |
| Asia | 60·7 | 15·0 |
| World (excluding China) | 66·1 | 12·5 |
| Africa | 8·6 | 9·2 |
| North America | 4·9 | 14·4 |
| Latin America and the Caribbean* | 4·6 | 8·0 |
| Europe | 12·8 | 17·4 |
| Oceania | 0·5 | 18·9 |
| Least developed countries | 8·5 | 11·9 |
| Low-income food-deficit countries | 27·7 | 10·5 |
Data for Central and South America and Caribbean combined.
While trade data do not indicate whether the fish is of farmed origin, with key commodities such as Oreochromis spp. and Pangasius spp. it is possible to be fairly certain. Allison (2011) found that effects of fish trade on poverty and food and nutrition security ranged from large and positive to negative and small. With the exception of tuna (Thunnini), increases in both per capita food-fish supplies and the value of trade only occurred when there was strong growth in aquaculture (e.g. in Bangladesh, Indonesia and Vietnam).
Increases in aquaculture enhance food-fish availability in countries where sector growth is strong. Although annual per capita food-fish availability in low-income food-deficit countries (LIFDCs) grew from 4·5 kg in 1961 to 10·5 kg in 2009, it remains comparatively low (FAO, 2011b; FAO–FISHSTAT 2012) (Table 2). Moreover, in Africa, where fish constitutes a particularly large proportion of animal-source foods, per capita food availability of fish has increased little over the past 20 years, in large measure due to the limited growth of aquaculture.
It is not just the availability of food-fish per se that is of concern, however, rather the nutrients that fish provide. Qualitatively, fish supplies have changed markedly over the past 50 years. In 1961, 32% of food fishes were of demersal origin, 26% were pelagic, 16% were fresh water and diadromous and 12% comprised other (i.e. non-demersal and pelagic) marine fishes (Fig. 2). By 2009, the availability of demersal and other marine fishes had fallen in both absolute and relative terms, that of pelagic fishes had increased in terms of biomass but had fallen as a proportion of total food-fish supplies, while that of freshwater and diadromous fishes had increased by c. 250%. Annual per capita freshwater and diadromous food-fish supplies in 2009 were 6·1 kg, equivalent to one-third of supplies (Fig. 2) (FAO, 2011b). The changes largely result from stagnation in capture fisheries production and the large rise in carps (Cypriniformes), Oreochromis spp. and salmonid aquaculture. The species being farmed are largely determined by ease of culture and profitability.
While changes in the fishes eaten are likely to have some effect on protein and energy supplies, they may have an even greater effect on the availability of dietary lipids (see Table 1). Demersal white fishes (gadoids) typically have low levels (<2%) of fat. Pelagic herring, anchovies and sardines (clupeids), as well as salmonids, mackerels (scombrids) and eel (Anguilla spp.), are oily fishes (>2% oil content), with levels in mackerel Scomber scombrus L. 1758 seasonally exceeding 20% (Wallace, 1991).
While species is a major determinant of farmed fish nutrient content, nutrient composition is also influenced by how the animal is farmed. Farm environmental conditions, especially water temperature, quantitatively and qualitatively influence lipid deposition (Haard, 1992). More important, however, is the role of food. While the majority of farmed fishes are freshwater omnivores and herbivores, there has nonetheless been a trend towards intensification of production methods, involving increasing reliance on nutritionally complete feeds (Tacon & Metian, 2008). Traditional pond-based fish farming methods use inorganic and organic fertilizers to stimulate autotrophic and heterotrophic production (Hepher, 1988). Production is further enhanced by the administration of small quantities of supplemental feeds, generally derived from long-chain carbohydrate-based agricultural by-products (e.g. rice and wheat bran) (Hepher, 1988; Avinmelech, 1999). The intensification of rearing methods responsible for increasing production per unit land and water is primarily driven by economics: the growing scarcity and thus value of land and fresh water, together with the price of feed and the strong market for fish (van der Zijpp et al., 2007).
The nutrient composition of wild and farmed fishes of the same species differs considerably. Total lipid content of farmed fishes is typically higher due to differences between wild and farmed environments in terms of feed availability and composition and animal activity (Vliet & Katan, 1990; Haard, 1992; Grigorakis et al., 2002; Palstra & Planas, 2011). Farmed white-fleshed fishes (e.g. Oreochromis spp.) also have lower ω-3:ω-6 fatty acids, the intensity of production methods (i.e. the amount and composition of external feed used) having a particularly important influence on fish lipid levels and composition (Grigorakis et al., 2002; Karapanagiotidis et al., 2006; Weaver et al., 2008).
In short, while aquaculture has increased global food-fish supplies, it has also radically changed the availability of certain food-fish types, species and nutrients consumed via fishes. Freshwater species, in particular cyprinids and tilapines, increasingly dominate food-fish supplies. While this may have marginal effects on protein supplies per unit food-fish, it changes the quantities and types of lipid. Farming methods have a further effect on fish lipid content and composition: intensification of production methods tends to increase fat levels and, where plant-based diets in particular are used, alter fat composition. The significance of these changes for food and nutrition security can only be determined in the context of individual food consumption and health.
Access
Availability alone is insufficient to ensure household food security: access to food, determined by power relations, poverty, lack of assets and prices that are increasingly governed by globalized markets, is also critical (Fig. 1). Although global food supplies undoubtedly have been improving, growing competition for use of farm land for biofuels, lack of key inputs in some places, natural disasters and increasing dependence of food production systems on energy have, since 2006, resulted in high and volatile food prices, a situation that is likely to continue for some time (FAO, 2011a). Poor, food import-dependent countries, with inadequate resources and capacity to put into practice policies targeted at incomes and expenditure, markets and prices or implement food safety nets, will continue to be disproportionally affected (FAO, 2011a).
Fisheries and aquaculture can improve household food security (Prein & Ahmed, 2000; Dey et al., 2006; Thilsted, 2012). The pathways by which this occurs have been elaborated by Kawarazuka & Béné (2010): directly through consumption of fish and indirectly through increased purchasing power from the sale of fish (i.e. increased access) (Fig. 1). The latter was found to be especially true when women engage in aquaculture and fisheries-related activities such as processing and trading, which results in a greater proportion of income being spent on food (i.e. improved use) (Kawarazuka & Béné, 2010).
Worldwide, an estimated 120 × 106 people are engaged in fishing (World Bank, 2010) and 23 × 106 in aquaculture (Valderrama et al., 2010), increasing their physical access to and, it is hypothesized, consumption of fish. The great majority of people in developing countries do not of course produce their own fish and physical access is largely determined by distance from source. Drying, salting and smoking extend the life of this highly perishable commodity, enabling distribution over far greater areas, albeit at some deterioration in nutritional quality (Roos et al., 2002). There have been few specific studies and no comprehensive review of how increases in farmed-fish availability affect access and use by poor consumers (Kawarazuka & Béné, 2010; Allison, 2011). The growth of aquaculture has undoubtedly increased access in production hotspots such as the Nile Delta, Egypt, but despite the volumes produced, physical access in distant Upper Egypt remains poor (Macfadyen et al., 2012). Moreover, in subsaharan Africa, the fish aquaculture sector remains dominated by smallholder, subsistence-type operations and physical access to the relatively small amounts of fish produced is largely limited to producer households and neighbours (Dey et al., 2006; Brummett et al., 2008; Kawarazuka & Béné, 2010).
The effect of prices
The greatest influence on access to food is prices, which are largely determined by markets and incomes (Fig. 1). The consumption of meat and fish, which are expensive compared to starchy staples such as rice or maize, is highly linked to wealth (Speedy, 2003). Low-income consumers therefore preferentially purchase less expensive fishes, such as small pelagic species, high in LCPUFAs (Tacon & Metian, 2009; Kabahenda et al., 2012). In southern Africa, for example, the cheapest fishes are the universally available small, dried kapenta Limnothrissa spp. and other associated freshwater pelagic species. Quantities as little as a few tens of grams are purchased and used with vegetables to prepare relishes that accompany the staple maize porridge.
A review of studies of fish price elasticities of demand in western markets concluded that demand responds closely to price (Gallet, 2009). In developing countries, price is likely to be an even greater determinant of whether poor consumers buy fish or not. Where aquaculture production dominates the market, farmed fish tends to be cheaper, increasing economic access. In Egypt, for example, farmed fish now account for two-thirds of all fish consumed and is considerably less expensive than most wild-caught fish (GAFRD, 2010). In Bangladesh, a decade ago, farmed fish was more expensive than wild-caught fish (Thompson et al., 2002). Today, due to a doubling of farmed-fish production, however, farmed fish is generally less expensive than wild-caught fish (B. Belton, pers. comm.).
Although unsupported by rigorous study, it is hypothesized that aquaculture producers in developing countries tend to target the production of larger-sized fish, aimed at middle-class urban regional and international markets (UNHRC, 2012), presumably in the expectation that the higher absolute and relative prices such fish command increase profits. It is proposed here that there is a largely unarticulated and increasingly unmet demand for economically accessible fish by poor consumers, who are in the majority in developing countries. Given any particular species, and irrespective of whether fresh or frozen, smaller fish are generally less expensive. In a study conducted in Bangladesh throughout 2011, for example, market prices of farmed 250 g Oreochromis spp. were 20–30% less per kg than that of 500 g fish (B. Belton, unpubl. data).
While production of smaller, less expensive fish undoubtedly increases access of poor consumers, from a food and nutrition security perspective the point is not how much fish is eaten but that fish consumption fulfils its potential to help meet nutritional needs, especially of poor and vulnerable consumers. The most important role that fish plays in diets dominated by starchy staples is the provision of essential fatty acids and highly bioavailable micronutrients (Gibson et al., 2003; Roos et al., 2003, 2007a, b, c, d; Hambraeus, 2009; Kawarazuka & Béné, 2010, 2011). From this perspective, oily fishes and small fishes that are eaten whole are superior. Small fish species, however, are generally not farmed, an exception being in Bangladesh, where small species, e.g. mola Amblypharyngodon mola (Hamilton 1822) and chanda Parambassis baculis (Hamilton 1822), are allowed to enter freshwater fish ponds from adjacent water bodies (Roos et al., 2002). While incorporation of small fish species into cyprinid-based pond polycultures increases overall production and revenues, seed remains unavailable from commercial hatcheries (Alim et al., 2004; Kadir et al., 2006). The absence of obvious candidate small fish species for aquaculture and the likely high associated seed costs may make their culture unprofitable, except where self-recruitment occurs. There also seems to be little market for very small-sized (i.e. that can be eaten whole) commonly farmed fishes, such as Oreochromis spp. or cyprinids.
Use and utilization
A healthy diet depends on the consumption and absorption of the appropriate amounts of energy in the form of carbohydrate, fats and protein, as well as essential fatty acids, amino acids, minerals and vitamins (Fig. 1). Inadequate food intake, compounded by the body's inability to utilize needed nutrients, results in undernutrition. Nutritional requirements are determined by genetic makeup, sex, age and health status, as well as physiological demands associated with factors such as pregnancy and physical labour.
What individuals choose to eat has always been determined not only by availability and access but also by taste, nutritional value, culture and religion. Personal perspectives and social contexts (life experiences, reliance on foods away from home, food advertising, marketing and promotion) are increasingly influential. The result is that a complex mix of product attributes such as convenience, quality, freshness, health and nutrition beliefs, environmental and animal welfare concerns and social relationships now determines western consumer food choices (Furst et al., 1996; Lennernäs et al., 1997).
It is no surprise then that the importance of fish in household food baskets varies enormously geographically and temporally. So how has the rise of aquaculture influenced consumption patterns? Demographic characteristics, education, place of purchase and generic advertising have been found to determine beliefs and attitudes about aquaculture production (Fernández-Polanco & Lunes, 2012). A survey of women consumers in Belgium, for example, found that consumption of wild-caught fish was influenced by sustainability and ethical considerations whilst that of farmed fish by perceptions of quality (Verbeke et al., 2007). In Bangladesh, much of the increase in aquaculture production has been of exotic species, such as Oreochromis spp., which are less preferred than the increasingly scarce indigenous wild fishes (B. Belton, pers. comm.). It seems, therefore, that there can be consumer resistance to farmed fish, especially unfamiliar exotic species. Use may change over time, especially where availability and economic access increase.
At the household level, how food is handled, prepared and cooked influences the nutritional value of what is consumed (Kabahenda et al., 2012). The quantities of food distributed among family members depend on cultural and power determined norms with respect to sex and age in particular (Wheeler, 1991). Traditional products such as dried, smoked, salted and fermented small fishes are usually cooked as a mixed curry or stew dish, with a little oil, vegetables and spices. Such dishes, as well as fish paste and fish sauces, are more readily shared among family members than larger farmed fishes. Individual health status determines how effectively the body utilizes what is consumed (Caulfield et al., 2006). The institutions and policies that regulate air quality, adequacy of housing (especially in relation to provision of clean water and sanitation) and access to health care influence the prevalence of infectious, diarrhoeal and acute respiratory diseases among the poor in developing countries (Cairncross & Valdmanis, 2006).
While only the flesh and sometimes the skin or heads of larger fishes tend to be consumed, small fishes are often eaten whole. The micronutrient content of small fishes is often high (see Table 1) but the micronutrients are concentrated in the bones, heads and gut, and these fishes must be eaten whole to derive full nutritional benefit (Steiner-Asiedu et al., 1993; Larsen et al., 2000; Roos et al., 2002, 2003, 2007d,). The contribution of fish as rich sources of vitamins and minerals is poorly documented and often overlooked. Studies from rural Bangladesh have shown that a number of widely occurring small tropical freshwater fish species, such as A. mola, P. baculis, dhela Osteobrama cotio cotio (Hamilton 1822) and darkina Esomus danricus (Hamilton 1822), have high contents of pre-formed vitamin A (Thilsted et al., 1997; Roos et al., 2007a). Because most of the small fish species are eaten whole, they are also a very rich source of highly bioavailable calcium (Hansen et al., 1998; Larsen et al., 2000). Esomus danricus and trey changwa plieng Esomus longimanus (Lunel 1882) from Cambodia have a high iron and zinc content (Roos et al., 2007c). A traditional daily meal of rice and sour soup made with E. longimanus can meet 45% of the daily iron requirement of a Cambodian woman (Roos et al., 2007b). Table 1 shows the vitamin A, calcium, iron and zinc content of some selected common small fishes, as well as two commonly farmed large freshwater fishes.
Cooking affects the macro and micronutrient content of fish (Kabahenda et al., 2012). Proteins change structure, generally becoming more utilizable by the body. Fat content alters according to cooking method and LCPUFAs can be lost. Minerals are generally conserved during cooking but vitamins such as thiamine, cobalamine and niacin are often lost or denatured (Holland et al., 1991). Consuming fish as part of a meal also confers additional benefits in terms of increasing the bioavailability of iron and zinc from other foods in a meal (Aung-Than-Batu et al., 1976).
Vulnerability, a product of exposure to risk factors such as seasonality in supply, conflict, rising prices and disease, and the ability to cope with such shocks, as established by assets (physical and educational) and degree of social marginalization, determines the stability of food and nutrition security (Fig. 1) (Klennert, 2009). Inadequate food access and utilization on a periodic basis, especially during key life stages such as the first 1000 days of life, can have long-term consequences for an active and healthy life (Caulfield et al., 2006; Ruel et al., 2008). Farming improves the continuity of global fish supplies, but locally, export-oriented aquaculture increasingly falls into a ‘gilded trap’ in focusing on economic rather than socio-ecological aspects (Steneck et al., 2011), which can undermine rather than improve local access to fish food.
Discussion
Fish is a preferred food item in the diets of many, especially poor, consumers. Fish provides energy and is a superior source of protein to other animal source foods in terms of total protein and essential amino acid content and digestibility (Kawarazuka & Béné, 2011). It is as a source of essential fatty acids and micronutrients, superior in both qualitative and quantitative terms to other animal-source foods (Table 1), that may be of greatest importance in food and nutrition security terms.
Aquaculture accounts for an increasing proportion of global food-fish supplies and, indeed, has increased global per capita food-fish supplies. Market demand, resulting more from urbanization and increasing wealth than from population growth, is likely to continue to drive expansion of global aquaculture production, albeit that the rate of increase is reducing as constraints on and costs of resources and essential ecosystem services (feedstuffs, space and capacity to disseminate and assimilate wastes) increasingly affect the sector (Hall et al., 2011; Merino et al., 2012).
Fish farming is largely absent from those parts of the world where it is most needed, especially Sub-Saharan Africa, however, despite favourable soils and climate. Here, arguably, there has been an over-emphasis on promotion of subsistence aquaculture, which, while improving resilience of poor smallholders to external shocks (Dey et al., 2006), has proved costly to implement and has had limited effect on incomes or food and nutrition security (Brummett et al., 2008). There is, however, an increasing focus on market-based aquaculture that is resulting in marked increases in aquaculture production (Beveridge et al., 2010), although whether this will suffice to meet growing demand is a moot point. In much of Sub-Saharan Africa, growth in demand between 2007 and 2015 is expected to be 25–50% (Cai, 2011). Assuming little change in capture fisheries or import supplies, demand must be met by aquaculture, but the required rates of sector growth, in the order of 40–140% (Cai, 2011), are much higher than are taking place.
In addition to increasing availability, especially in those parts of the world where fish is most needed, aquaculture must also increase access. A number of economists have identified low-income markets as potential growth areas (Prahalad, 2004; Diamandis & Kotler, 2012). There are many good economic and environmental reasons to produce smaller-sized herbivorous and omnivorous fishes or fish products for poorer consumers. In addition to increased economic access, production per unit land use (productivity) is higher and it is more energy efficient and cheaper per unit biomass to produce smaller-sized fishes, a result of better food conversion ratios (FCR) and lower production costs (Robinson & Li, 2010; Tlusty et al., 2011). Because it takes less time to produce smaller fishes, farmers may be able to produce several harvests per season. Moreover, risks (mortality, price changes and natural disasters) are lower (Pascoe et al., 2002; Bauer & Schlott, 2009) and the cost of any borrowing is also reduced. Surprisingly, little research has been done on production economics and on these so-called bottom-of-the-pyramid markets. Access to food can also be increased by greater policy focus on incomes and expenditure, markets and prices (FAO, 2011a). While such instruments are often used to increase access to starchy staples, more evidence is needed to show why increasing access to fish is an effective and cost-efficient way to improve food and nutrition security (Allison, 2011; Kawarazuka & Béné, 2011).
While production of smaller, less expensive fishes may increase access by poor consumers, from a food and nutrition security perspective (UNHRC, 2012) the point is not how much fish is eaten but that the farmed fish meets the nutrition needs of poor and vulnerable consumers. Farmed fish is an excellent source of animal protein but because of species, size and method of rearing it is often inferior to small wild fish species as a source of essential fatty acids and micronutrients. Research is needed to identify small species that might be suitable for culture.
Inclusion of fish-derived products, especially fish oil, in aquaculture diets can help improve the nutritional value of the finished product. Given the importance of wild pelagic fishes in the diets of poor consumers, however, it is important that the growth of aquaculture does not increase the amount of fish of low economic value converted into fish meal and fish oil. There are strong economic drivers to reduce dietary fish oil content and over the past decade, much has been replaced by plant (soy, flax and corn) oils (Olsen, 2011). These, however, do not contain LCPUFAs. Judicious use of diets with higher fish oil inclusion rates in the weeks prior to harvesting can change fish fat content and fatty acid profile (Young, 2009). The feed sector must continue to seek alternative feedstuffs that do not compromise the nutritional quality of farmed fishes. Recent studies have also increased the understanding of fish lipid metabolism, indicating the possibility of selecting for strains of some species of farmed fishes with improved LCPUFA biosynthesis capabilities (Leaver et al., 2008).
Acknowledgments
Thanks to B. Belton, WorldFish, Bangladesh, for sharing unpublished data and critiquing various ideas central to the arguments in this paper. Thanks too to E. Allison, WorldFish and University of East Anglia, for discussions that influenced the direction of the paper. The views expressed here, however, do not necessarily reflect theirs. The authors also acknowledge the kind invitation of the organizers of the 6th World Fisheries Congress, Edinburgh, to present a keynote address, which was a key factor in writing this paper. The paper is a contribution to the CGIAR Research Programmes: Aquatic Agricultural Systems and Livestock and Fish. M.M. is a Nippon Foundation Senior Nereus Fellow (funded by NF Nereus Programme) and M.T. benefited from SIDA funding (Swedish International Development Cooperation Agency).
References
- Alim MA, Wahab MA. Milstein A. Effects of adding the small fish punti (Puntius sophore) and mola (Ambylpharyngodon mola) to a polycultures of large carp. Aquaculture Research. 2004;35:124–133. [Google Scholar]
- Aung-Than-Batu Thein-Than Thane-Toe Iron absorption from Southeast Asian rice-based meals. American Journal of Clinical Nutrition. 1976;29:219–225. doi: 10.1093/ajcn/29.2.219. [DOI] [PubMed] [Google Scholar]
- Avinmelech Y. Feeding with microbial flocs by tilapia in minimal discharge bio-flocs technology ponds. Aquaculture. 1999;264:140–147. [Google Scholar]
- Battisti DS. Naylor RL. Historical warnings of future food insecurity with unprecedented seasonal heat. Science. 2009;323:240–244. doi: 10.1126/science.1164363. [DOI] [PubMed] [Google Scholar]
- Bauer C. Schlott G. Fillet yield and fat content in common carp (Cyprinus carpio) produced in three Austrian carp farms with different culture methodologies. Journal of Applied Ichthyology. 2009;25:591–594. [Google Scholar]
- Beveridge MCM, Phillips MJ, Dugan P. Brummett R. Barriers to aquaculture development as a pathway to poverty alleviation and food security. In: Strange T, editor; Andrews-Couicha E, Franz N, Ravet K, Schmidt CC, Strange T, editors. Advancing the Aquaculture Agenda: Workshop Proceedings. Paris: OECD Publishing; 2010. pp. 345–359. [Google Scholar]
- Black RE, Allen LH, Bhutta ZA, Caulfiel L, De Onis M, Ezzati M, Mathers C. Rivera J. Maternal and child undernutrition: global and regional exposures and health consequences. Lancet. 2008;371:243–260. doi: 10.1016/S0140-6736(07)61690-0. [DOI] [PubMed] [Google Scholar]
- Brummett RE, Lazard J. Moehl J. African aquaculture; realizing the potential. Food Policy. 2008;33:371–385. [Google Scholar]
- Cai J. Preliminary notes on forecasting country's future demand for fish. FAO Aquaculture Newsletter. 2011;47:16–17. [Google Scholar]
- Cairncross S. Valdmanis V. Jamison DT. Breman JG. Measham AR. Alleyne G. Claeson M. Evans DB. Jha P. Mills A. Musgrove P. Disease Control Priorities in Developing Countries. 2. New York, NY: Oxford University Press and Washington, DC: World Bank; 2006. Water supply, sanitation and hygiene promotion; pp. 771–792. [Google Scholar]
- Caulfield LE, Richard SA, Rivera JA, Musgrove P. Black RE. Jamison DT. Breman JG. Measham AR. Alleyne G. Claeson M. Evans DB. Jha P. Mills A. Musgrove P. Disease Control Priorities in Developing Countries. 2. New York, NY: Oxford University Press and Washington, DC: World Bank; 2006. Stunting, wasting and micronutrient related disorders; pp. 551–567. [PubMed] [Google Scholar]
- Deutsch L, Troell M, Limburg K. Huitric M. Global trade of fisheries products: implications for marine ecosystems and their services. In: Koellner T, editor; Ecosystem Services and Global Trade of Natural Resources. London: Routledge; 2011. pp. 120–147. [Google Scholar]
- Dey MM, Kambewa P, Prein M, Jamu D, Paraguas FJ, Pemsl DE. Briones RM. Waibel H. Zilberman D. International Research on Natural Resource Management. Rome: FAO and Cambridge: CAB International; 2006. WorldFish Center. Impact of the development and dissemination of integrated aquaculture technologies in Malawi; pp. 118–140. [Google Scholar]
- Diamandis PM. Kotler S. Abundance. The Future is Better than You Think. New York, NY: Free Press; 2012. [Google Scholar]
- FAO. The State of Food Insecurity in the World. Rome: FAO; 2011a. [Google Scholar]
- FAO. FAO Yearbook. Fishery and Aquaculture Statistics. Rome: FAO; 2011b. [Google Scholar]
- FAO. The State of World Fisheries and Aquaculture 2010. Rome: FAO; 2012a. [Google Scholar]
- FAO–FISHSTAT. FAO Fisheries Department, Fishery Information, Data and Statistics Unit. FishstatJ, a Tool for Fishery Statistical Analysis, Release 2.0.0. Global Capture Fisheries Production 1950–2010, Global Aquaculture Production 1950–2010, Global Commodities Production and Trade 1978–2009. Rome: FAO; 2012. [Google Scholar]
- FAO–WHO. FAO Fisheries and Aquaculture Technical Paper; Report of the Joint FAO–WHO Expert Consultation on the Risks and Benefits Associated with Fish Consumption; 2011. p. 978. [Google Scholar]
- Fernández-Polanco J. Lunes L. Factors affecting consumers' beliefs about aquaculture. Aquaculture Economics and Management. 2012;16:22–39. [Google Scholar]
- Foley JA, Ramankutty N, Brauman KA, Cassidy ES, Gerber JS, Johnston M, Mueller ND, O′Connell C, Ray DK, West PC, Balzer C, Bennett EM, Carpenter SR, Hill J, Monfreda C, Polasky S, Rockström J, Sheehan J, Siebert S, Tilman D. Zaks DPM. Solutions for a cultivated planet. Nature. 2011;478:337–342. doi: 10.1038/nature10452. doi: 10.1038/nature10452. [DOI] [PubMed] [Google Scholar]
- Furst T, Connors M, Bisogni CA, Sobal J. Falk LW. Food choice: a conceptual model of the process. Appetite. 1996;26:247–266. doi: 10.1006/appe.1996.0019. [DOI] [PubMed] [Google Scholar]
- GAFRD. Fisheries Statistics Year Book. Cairo: General Authority for Fisheries Resources Development; 2010. [Google Scholar]
- Gallet GA. The demand for fish: a meta-analysis of the own-price elasticity. Aquaculture Economics and Management. 2009;13:235–245. doi: 10.1080/13657300903123985. [Google Scholar]
- Gibson RS, Yeudall F, Drost N, Mtitimuni BM. Cullinan TR. Experiences of a community-based dietary intervention to enhance micronutrient adequacy of diets low in animal source foods and high in phytate: a case study in rural Malawian children. Journal of Nutrition. 2003;133:3992S–3999S. doi: 10.1093/jn/133.11.3992S. [DOI] [PubMed] [Google Scholar]
- Grantham-McGregor S. Development potential in the first 5 years for children in developing countries. Lancet. 2007;369:60–70. doi: 10.1016/S0140-6736(07)60032-4. [DOI] [PMC free article] [PubMed] [Google Scholar]
- Grigorakis K, Alexis MN, Taylor KDA. Hole M. Comparison of wild and cultured gilthead sea bream (Sparus aurata); composition, appearance and seasonal variations. International Journal of Food Science and Technology. 2002;37:477–484. [Google Scholar]
- Haard NF. Control of chemical composition and food quality attributes of cultured fish. Food Research International. 1992;25:289–307. [Google Scholar]
- Hall SJ, Delaporte A, Phillips MJ, Beveridge MCM. O'Keefe M. Blue Frontiers: Managing the Environmental Costs of Aquaculture. Penang: WorldFish Center; 2011. [Google Scholar]
- Hambraeus L. Seafood in human nutrition. In: Ackefors H, editor; Wramner P, Cullberg M, editors. Fish, Trade and Development. Stockholm: Royal Swedish Academy of Agriculture and Forestry; 2009. pp. 325–340. [Google Scholar]
- Hansen M, Thilsted SH, Sandström B, Kongsbak K, Larsen T, Jensen M. Sørensen SS. Calcium absorption from small soft-boned fish. Journal of Trace Elements in Medicine and Biology. 1998;12:148–154. doi: 10.1016/S0946-672X(98)80003-5. [DOI] [PubMed] [Google Scholar]
- Hepher B. Nutrition of Pond Fishes. Cambridge: Cambridge University Press; 1988. [Google Scholar]
- Holland B, Welch AA, Unwin ID, Buss DH, Paul AA. Southgate DAT. The Composition of Foods. Cambridge: Royal Society of Chemistry; 1991. [Google Scholar]
- Jenkins DJA, Sievenpiper JL, Pauly D, Sumaila UR, Kendall CWC. Mowat FM. Are dietary recommendations for the use of fish oils sustainable? Canadian Medical Association Journal. 2009;180:633–637. doi: 10.1503/cmaj.081274. [DOI] [PMC free article] [PubMed] [Google Scholar]
- Kabahenda MK, Amega R, Okalany E, Husken SMC. Heck S. Protein and micronutrient composition of low-value fish products commonly marketed in the Lake Victoria region. World Journal of Agricultural Sciences. 2012;7:521–526. [Google Scholar]
- Kadir A, Kundu RS, Milstein A. Wahab MA. Effects of silver carp and small indigenous species on pond ecology and carp polycultures in Bangladesh. Aquaculture. 2006;261:1065–1076. [Google Scholar]
- Karapanagiotidis IT, Bell MV, Little DC, Yakupitiyage A. Rakshit SK. Polyunsaturated fatty acid content of wild and farmed tilapias in Thailand: effect of aquaculture practices and implications for human nutrition. Journal of Agricultural and Food Chemistry. 2006;54:4304–4310. doi: 10.1021/jf0581877. [DOI] [PubMed] [Google Scholar]
- Kawarazuka N. Béné C. Linking small-scale fisheries and aquaculture to household nutritional security: an overview. Food Security. 2010;2:343–357. [Google Scholar]
- Kawarazuka N. Béné C. The potential role of small fish species in improving micronutrient deficiencies in developing countries: building evidence. Public Health Nutrition. 2011;14:1927–1938. doi: 10.1017/S1368980011000814. doi: 10.1017/S1368980011000814. [DOI] [PubMed] [Google Scholar]
- Klennert M, editor. Achieving Food and Nutrition Security. 3. Feldafing: InWEnt; 2009. [Google Scholar]
- Larsen T, Thilsted SH, Kongsbak K. Hansen M. Whole small fish as a rich calcium source. British Journal of Nutrition. 2000;83:191–196. [PubMed] [Google Scholar]
- Leaver MJ, Bautista JM, Björnsson BT, Jönsson E, Krey G, Tocher DR. Torstensen BE. Towards fish lipid nutrigenomics: current state and prospects for fin-fish aquaculture. Reviews in Fish and Fisheries Science. 2008;16:73–94. Available at doi: 10.1080/10641260802325278/ [Google Scholar]
- Lennernäs M, Fjellström C, Becker W, Giachetti I, Schmitt A, Remaut de Winter A. Kearney M. Influence of food choice perceived to be important by national representative samples of adults in the European Union. European Journal of Clinical Nutrition. 1997;51(Suppl. 2):S8–S15. [PubMed] [Google Scholar]
- Little DC, Bush SR, Belton B, Phuong NT, Young JA. Murray FJ. Whitefish wars: Pangasius, politics and consumer confusion in Europe. Marine Policy. 2012;36:738–745. [Google Scholar]
- Macfadyen G, Nasr Allah AM, Kenawy DAR, Ahmed MFM, Hebicha H, Diab A, Hussein SM, Abouzeid RM. El Naggar G. Value Chain Analysis of Egyptian Aquaculture. Project Report 2011-54. Penang: WorldFish Center; 2012. [Google Scholar]
- Merino G, Barange M, Blanchard J, Harle J, Holmes R, Allen I, Allison EH, Badjeck MC, Dulvy NK, Holt J, Jennings S, Mullon C. Rodwell LD. Can marine fisheries and aquaculture meet fish demand from a growing human population in a changing climate? Global Environmental Change. 2012;22:795–806. doi: org/10.1016/j.gloenvcha.2012.03.003. [Google Scholar]
- Norman-López A. Bjorndal T. Is tilapia the same product worldwide or are markets segmented? Aquaculture Economics and Management. 2009;13:138–154. [Google Scholar]
- Olsen Y. Resources for fish feed in future mariculture. Aquaculture Environment Interactions. 2011;1:187–200. [Google Scholar]
- Palstra AP. Planas JV. Fish under exercise. Fish Physiology and Biochemistry. 2011;37:259–287. doi: 10.1007/s10695-011-9505-0. [DOI] [PMC free article] [PubMed] [Google Scholar]
- Pascoe S, Wattage P. Naik D. Optimum harvest strategies: practice versus theory. Aquaculture Economics and Management. 2002;6:295–308. Available at doi: 10.1080/13657300209380320/ [Google Scholar]
- Phalan B, Onial M, Balmford A. Green RE. Reconciling food production and biodiversity conservation: land sharing and land sparing compared. Science. 2011;333:1289–1291. doi: 10.1126/science.1208742. [DOI] [PubMed] [Google Scholar]
- Prein M. Ahmed M. Integration of aquaculture into smallholder farming systems for increased food security and household nutrition. Food and Nutrition Bulletin. 2000;21:466–471. [Google Scholar]
- Prahalad CK. The Fortune at the Bottom of the Pyramid. Upper Saddle River, NJ: Wharton School Publishing; 2004. [Google Scholar]
- Robinson EH. Li MH. Channel catfish, Ictalurus punctatus, size and feed conversion ratio. Journal of the World Aquaculture Society. 2010;41:829–833. [Google Scholar]
- Roos N, Leth T, Jacobsen J. Thilsted S. High vitamin A content in some small indigenous fish species in Bangladesh: perspectives for food-based strategies to reduce vitamin A deficiency. International Journal of Food Sciences and Nutrition. 2002;53:425–437. doi: 10.1080/0963748021000044778. [DOI] [PubMed] [Google Scholar]
- Roos N, Islam M. Thilsted SH. Small fish is an important dietary source of vitamin A and calcium in rural Bangladesh. International Journal of Food Sciences and Nutrition. 2003;54:329–339. doi: 10.1080/09637480120092125. [DOI] [PubMed] [Google Scholar]
- Roos N, Wahab MA, Chamnan C. Thilsted SH. The role of fish in food-based strategies to combat vitamin A and mineral deficiencies in developing countries. Journal of Nutrition. 2007a;137:1106–1109. doi: 10.1093/jn/137.4.1106. [DOI] [PubMed] [Google Scholar]
- Roos N, Thorseng H, Chamnan C, Larsen T, Gondolf UH, Bukhave K. Thilsted SH. Iron content in common Cambodian fish species: perspectives for dietary iron intake in poor, rural households. Food Chemistry. 2007b;104:1226–1235. [Google Scholar]
- Roos N, Chamnan C, Loeung D, Jakobsen J. Thilsted SH. Freshwater fish as a dietary source of vitamin A in Cambodia. Food Chemistry. 2007c;103:1104–1111. [Google Scholar]
- Roos N, Wahab MA, Hossain MAR, Thilsted SH. Linking human nutrition and fisheries: incorporating micronutrient dense, small indigenous fish species in carp polyculture production in Bangladesh. dFood and Nutrition Bulletin. 2007d;28((Suppl.)):S280–S293. doi: 10.1177/15648265070282S207. [DOI] [PubMed] [Google Scholar]
- The Royal Society. People and the Planet. The Royal Society Policy Center Report 12/1. London: The Royal Society; 2012. [Google Scholar]
- Ruel MT, Menon P, Habicht J-P, Loechel C, Bergeron B, Pelto G, Arimond M, Maluccio J, Michaud L. Hankebo B. Age-based preventative targeting of food assistance and behaviour change and communication for reduction of childhood undernutrition in Haiti: a cluster randomized trial. Lancet. 2008;371:588–595. doi: 10.1016/S0140-6736(08)60271-8. [DOI] [PubMed] [Google Scholar]
- Smith MD, Roheim CA, Crowder LB, Halpern BS, Turnipseed M, Anderson JL, Asche F, Bourillón F, Guttormsen AG, Khan A, Liguori LA, McNevin A, O'Connor MI, Squires D, Tyedmers P, Brownstein C, Carden K, Klinger DH, Sagarin R. Selkoe KA. Sustainability and global seafood. Science. 2010;327:784–786. doi: 10.1126/science.1185345. [DOI] [PubMed] [Google Scholar]
- Speedy AW. Global production and consumption of animal source foods. Journal of Nutrition. 2003;133:4048S–4053S. doi: 10.1093/jn/133.11.4048S. [DOI] [PubMed] [Google Scholar]
- Steiner-Asiedu M, Lied E, Lie O, Nilsen R. Julshamn K. The nutritive value of sun-dried pelagic fish from the Rift Valley in Africa. Journal of Science and Agriculture and Food. 1993;63:439–443. [Google Scholar]
- Steneck RS, Hughes TP, Cinner JE, Adger WN, Arnold SN, Berkes F, Boudreau SA, Brown K, Folke C, Gunderson L, Olsson P, Scheffer M, Stephenson E, Walker B, Wilson J. Worm B. Creation of a gilded trap by the high economic value of the Maine lobster fishery. Conservation Biology. 2011;25:904–912. doi: 10.1111/j.1523-1739.2011.01717.x. [DOI] [PubMed] [Google Scholar]
- Surette ME. The science behind dietary omega-3 fatty acids. Canadian Medical Association Journal. 2008;178:177–180. doi: 10.1503/cmaj.071356. [DOI] [PMC free article] [PubMed] [Google Scholar]
- Tacon AGJ. Metian M. Global overview on the use of fish meal and fish oil in industrially compounded aquafeeds: trends and future prospects. Aquaculture. 2008;285:146–158. [Google Scholar]
- Tacon AGJ. Metian M. Fishing for feed or fishing for food: increasing global competition for small pelagic forage fish. Ambio. 2009;38:294–302. doi: 10.1579/08-a-574.1. [DOI] [PubMed] [Google Scholar]
- Thilsted SH. The potential of nutrient-rich small fish species in aquaculture to improve human nutrition and health. In: Sorgeloos P, editor; Subasinghe RP, Arthur JR, Bartley DM, De Silva SS, Halwart M, Hishamunda N, Mohan CV, editors. Farming the Waters for People and Food. Proceedings of the Global Conference on Aquaculture 2010, Phuket, Thailand. 22–25 September 2010. Bangkok: NACA and Rome: FAO; 2012. pp. 57–73. [Google Scholar]
- Thilsted SH, Roos N. Hassan N. The role of small indigenous fish species in food and nutrition security in Bangladesh. Naga, ICLARM Quarterly. 1997;20:82–84. [Google Scholar]
- Thompson P, Roos N, Sultana P. Thilsted SH. Changing significance of inland fisheries for livelihoods and nutrition in Bangladesh. Journal of Crop Production. 2002;6:249–317. [Google Scholar]
- Tlusty MF, Hardy R. Cross SF. Limiting size of fish fillets at the center of the plate improves the sustainability of aquaculture production. Sustainability. 2011;3:957–964. [Google Scholar]
- Underwood BA. Overcoming micronutrient deficiencies in developing countries: is there a role for agriculture. Food and Nutrition Bulletin. 2000;21:356–360. [Google Scholar]
- Valderrama D, Hishamunda N. Zhou XW. Estimating employment in world aquaculture. FAO Fisheries and Aquaculture Newsletter. 2010;45:24–25. [Google Scholar]
- Verbeke W, Vanhonacker F, Sioen I, van Camp J. Henauw S. Perceived importance of sustainability and ethics related to fish: a consumer behaviour perspective. Ambio. 2007;36:580–585. doi: 10.1579/0044-7447(2007)36[580:piosae]2.0.co;2. [DOI] [PubMed] [Google Scholar]
- Vliet TV. Katan MB. Lower ratios of ω-3 to ω-6 fatty acids in cultured than in wild fish. American Journal of Clinical Nutrition. 1990;51:1–2. doi: 10.1093/ajcn/51.1.1. [DOI] [PubMed] [Google Scholar]
- Wallace PD. Seasonal variation in fat content of mackerel (Scomber scombrus L.) caught in the western English Channel. Fisheries Research Technical Report. 1991;91 . Lowestoft: Directorate of Fisheries Research. Available at http://cefas.defra.gov.uk/publications/techrep/tech91.pdfhttp://cefas.defra.gov.uk/publications/techrep/tech91.pdf. [Google Scholar]
- Weaver KL, Ivester P, Chilton JA, Wilson MD, Pandey P. Chilton FH. The content of favorable and unfavorable polyunsaturated fatty acids found in commonly eaten fish. Journal of the American Dietetic Association. 2008;108:1178–1185. doi: 10.1016/j.jada.2008.04.023. [DOI] [PubMed] [Google Scholar]
- Wheeler EF. Intra-household food and nutrient allocation. Nutrition Research Reviews. 1991;4:69–81. doi: 10.1079/NRR19910008. [DOI] [PubMed] [Google Scholar]
- World Bank. The Hidden Harvests: the Global Contribution of Capture Fisheries. Washington, DC: World Bank, Agriculture and Rural Development Department, Sustainable Development Network; 2010. [Google Scholar]
- Young K. Omega-6 (n-6) and omega-3 (n-3) fatty acids in tilapia and human health: a review. International Journal of Food Sciences and Nutrition. 2009;60:203–211. doi: 10.1080/09637480903140503. [DOI] [PubMed] [Google Scholar]
- van der Zijpp AJ, Verreth JAJ, Tri LQ, van Mensvoort MEF, Bosma RH, editors; Beveridge MCM, editor. Fishponds in Farming Systems. Wageningen: Wageningen Academic Publishers; 2007. [Google Scholar]
Electronic References
- Allison EA. Aquaculture, Fisheries, Poverty and Food Security. Working Paper 2011-65. Penang: WorldFish Center; 2011. Available at http://www.worldfishcenter.org/resource_centre/WF_2971.pdf/ (last accessed 11 June 2013) [Google Scholar]
- FAO. Food Outlook—Global Market Analysis. Rome: FAO Trade and Markets Division; 2012b. Available at http://www.fao.org/giews/english/fo/index.htm/ [Google Scholar]
- FAO–FAOSTAT. FAO Agriculture Department, Agricultural Production, Livestock Primary. Total world meat 1970–2010, Food Balance Sheets. Rome: FAO; 2013. Available at http://faostat.fao.org/site/610/default.aspx#ancor/ (last accessed 9 April 2013) [Google Scholar]
- UN Department of Economic and Social Affairs, Population Division. World Population Prospects: The 2010 Revision, Highlights and Advance Tables. Working Paper No. ESA/P/WP.220. 2011. Available at http://esa.un.org/wpp/documentation/pdf/WPP2010_Highlights.pdf/
- UNHRC. The Rights to Fish for Food. New York, NY: United Nations Human Rights Commission; 2012. Available at http://www.srfood.org/images/stories/pdf/officialreports/20121030_fish_en.pdf/ [Google Scholar]