

Abstract
Background
We previously reported that induced Pluripotent Stem Cell-derived cardiomyocytes (iPSC-CM) manifest beat rate variability (BRV) resembling heart rate variability (HRV) in human sinoatrial node (SAN). We now hypothesized the BRV-HRV continuum originates in pacemaker cells.
Objective
To investigate whether cellular BRV is a source of HRV dynamics, we hypothesized three-levels of interaction among different cardiomyocyte entities: (1) single pacemaker cells, (2) networks of electrically coupled pacemaker cells and (3) in situ SAN.
Methods
We measured BRV/HRV properties in single pacemaker cells, iPSC-derived contracting embryoid bodies (EBs) and electrocardiograms from the same individual.
Results
Pronounced BRV/HRV were present at all three levels. Coefficient of variance (COV) of inter-beat intervals (IBI) and Poincaré plot SD1 and SD2 in single cells were 20x > EBs (P<0.05) and in situ heart (the latter two were similar, P>0.05). We also compared BRV magnitude among single cells, small (~5-10 cells) and larger EBs (>10 cells): BRV indices progressively increased (P<0.05) as cell number decreased. Disrupting intracellular Ca2+ handling markedly augmented BRV magnitude, revealing a unique bi-modal firing pattern, suggesting intracellular mechanisms contribute to BRV/HRV and the fractal behavior of heart rhythm.
Conclusions
The decreased BRV magnitude in transitioning from single cell to EB suggests HRV of hearts in situ originates from summation and integration of multiple cell-based oscillators. Hence, complex interactions among multiple pacemaker cells and intracellular Ca2+ handling determine HRV in humans and isolated cardiomyocyte networks.
Keywords: Electrophysiology, Heart rate, Induced Pluripotent Stem Cells, Heart Rate Variability, Cardiac Myocytes
Introduction
Numerous studies have shown normal heart rate fluctuates around a mean, a phenomenon termed heart rate variability (HRV).1, 2 A key feature of the human heart is that HRV exhibits self-similar fractal-like oscillations contributing to its complex firing pattern.3, 4 The common notion is that HRV reflects the opposing effects of the autonomic nervous system branches, as well as other extra- and intra-cardiac inputs; e.g. intracellular, chemical, hormonal and metabolic. Yet, HRV persists in denervated hearts (albeit differently than innervated hearts), suggesting it derives from other extra-cardiac factors affecting heart rate dynamics, as well as from intrinsic cardiac regulatory mechanisms.5
We recently reported that networks (clusters) of human embryonic stem cell (hESC)-derived cardiomyocytes (hESC-CM) and induced pluripotent stem cell (iPSC)-derived cardiomyocytes (iPSCCM) completely lacking extra-cardiac inputs, exhibit beat rate variability (BRV), fractality and power-law behavior resembling HRV in human sinoatrial node (SAN).4, 6 This was consistent with studies of ventricular cells of newborn rat (both isolated cells and cell networks), which found fractal and power-law behavior here, as well.7, 8 Collectively, our findings suggest these BRV properties are intrinsic to pacemaker cells. A key question arising from the resemblance of BRV in cardiomyocyte-coupled networks to HRV in situ is whether BRV is a fundamental source of HRV. Hence, the sources of HRV in situ can be considered in terms of non-steady state firing patterns of individual cardiac pacemaker cells, interactions among neighboring pacemaker cells in a coupled network and extra-cardiac influences on these components. To investigate whether cellular BRV is a source of HRV dynamics, we hypothesized three-levels of interaction among different cardiomyocyte entities: (1) single pacemaker cell, (2) networks of electrically coupled pacemaker cells and (3) in situ SAN. To test this hypothesis, we analyzed HRV in electrocardiograms (ECGs) of healthy volunteers, and BRV in extracellular electrograms and action potentials (AP) recorded from spontaneously contracting embryoid bodies (EBs) and iPSC-CM, respectively, both fabricated from volunteers’ keratinocytes. We also hypothesized that disrupting intracellular Ca2+ handling would impact on BRV magnitude. If validated, this would suggest intracellular mechanisms contribute to BRV/HRV and the fractal behavior of cardiac rhythm.
Methods
ECGs were recorded from 5 healthy females, ages 25-to-54, taking no medication. We plucked 10 scalp hairs/subject from two of them and prepared iPSC-CM from keratinocytes as previously described9 (see on-line Supplement). The study was approved by the local Ethics Committee and all subjects gave informed consent. Our previous publication reported a normal karyotype and electrogram properties recorded from EBs generated from one volunteer (#201201) included in the present work.6, 9 iPSC and iPSC-CM from the second volunteer (#201202) in this study have a normal karyotype and comparable electrophysiological data (data not shown).
Data recording and processing
Extracellular electrograms were recorded for 30 minutes from spontaneously contracting 18-39 day-old EBs using the Micro-Electrode-Array (MEA) apparatus (Multi Channels Systems, Reutlingen, Germany).6 Recordings were at sampling frequency = 1000 Hz, down-sampled to 200 Hz, and analyzed to detect peaks of the signal from which R–R intervals were calculated using MATLAB software. Action potentials were recorded from single cardiomyocytes or small EBs containing few cells, as described below. ECGs were recorded from five healthy individuals and analyzed as described in the on-line Supplement.
Action potential recordings
For action potentials recordings, spontaneously contracting areas of EBs were mechanically dissociated and enzymatically dispersed (collagenase II 1 mg/ml; Worthington, Lakewood, New Jersey, USA, http://www.worthington-biochem.com). This dispersion resulted in single cells, small contracting clusters (5-10 cells) and larger contracting clusters (>10 cells). Single cardiomyocytes as well as small and large clusters were then plated on gelatin-coated glass coverslips (13 mm diameter) in 24-well plates. The coverslips were incubated at 37°C, and a recovery period of two days was allowed before the electrophysiological experiment was performed.10 In all experiments, the coverslips were perfused at 37°C with an external solution containing (in mM): 140 NaCl, 5.4 KCl, 1.8 CaCl2, 1 MgCl2, 10 glucose and 10 HEPES titrated to pH 7.4 with NaOH (310 mOsm). The patch pipette solution contained (mM): 120 KCl, 1 MgCl2, 3 Mg-ATP, 10 HEPES, and 10 EGTA titrated to pH 7.2 with KOH and adjusted at 290 mOsm with saccharose (all materials were purchased from Sigma-Aldrich). Axopatch 200B, Digidata 1322 and pClamp10 (Molecular Devices, Sunnyvale, CA) were used for data amplification, acquisition and analysis. Signals were digitized at 10 kHz and filtered at 2 kHz. Microelectrodes with resistances of 4-7 MΩ were pulled from borosilicate glass capillaries (Harvard Apparatus, Holliston, USA). The electrical signal obtained from the contracting cardiomyocyte was sampled at 10000 Hz and down-sampled to 200 Hz. The recordings were analyzed for detection of peaks of the recorded signal from which inter-beat-intervals were calculated using dedicated MATLAB software.
Data analysis
We used three different means to analyze BRV/HRV (see on-line Supplement): (1) The detrended fluctuation analysis (DFA) quantifies the intrinsic fractal-like behavior of non-stationary time series (Fig. 1A, on-line Supplemental).6, 11 (2) Poincaré plot, in which each inter-beat interval (IBI) (IBIn+1) is plotted against its predecessor (IBIn), reflecting the dynamics of the systm.12 (3) Power-law analysis (see Supplement) which determines the scaling relationships of the process.13
Statistical analysis
See on-line supplement.
Results
IBI variability occurs at the three levels
Fig. 1 demonstrates the ECG of a 39-year old healthy female volunteer #201201 from whom iPSC were generated, EB electrogram and single cardiomyocyte action potentials. Pronounced BRV/HRV at all three levels is illustrated by the IBI versus time plot, and by the IBI histograms. Similar findings from the second volunteer (#201202) are shown in Supplementary Fig. 2. That the cells within the entire EB network beat in synchrony and are electrically coupled, is shown in Supplementary Fig. 3: here, electrograms recorded from 3 sites in the cluster exhibit identical beat rate (43.5 beats/min), IBIs versus time plots, IBIs histograms and Poincaré plots.
Figure 1.
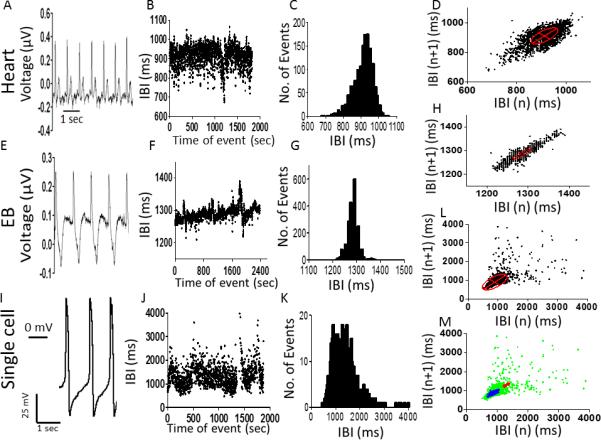
Electrical activity, inter-beat intervals (IBIs) and Poincaré plots analysis at three levels: [A-D] in situ heart; [E-H] spontaneously contracting embryoid body (EB); [I-L] single cardiomyocyte. [A], [E], [I]: Representative electrocardiogram, extracellular electrogram and action potentials, respectively. [B], [F], [J]: IBIs time series. [C], [G], [K]: Histogram distribution of IBIs. [D], [H], [L]: Poincaré plots of IBI. [M]: Combined Poincaré plots. The minor axis (SD1) of the ellipse represents the standard deviation (SD) of short-term IBI variability; the major axis (SD2) represents the standard deviation of long-term IBI variability. Recordings from volunteer #201201.
Overall, 12 EBs were examined for BRV analysis: 7 of them covered 2-3 electrodes; 2 covered 8 electrodes, and 3 covered 15-16 electrodes. The EB presented in Supplemental Fig. 3 covered 16 electrodes and was beating synchronously. The electrodes selected for analysis were not adjacent to one another and had a consistent, strong signal. We accepted that cardiomyocytes within the network having identical rhythm characteristics were coupled to one another.
Collectively, these results demonstrate: (1) In addition to in situ heart and the network, BRV is a key feature of single cardiomyocytes, thus supporting our hypothesis. (2) As shown in Fig. 1 (and Supplementary Fig. 2, panels C, G, K), the range of IBIs is broader in single cardiomyocytes than in EB and in situ heart (further details regarding these observations follow). In Poincaré plots generated for volunteer #201201 (similar results are shown for volunteer #201202, Supplementary Fig. 2), horizontal and vertical dispersions are larger in single cell than EB and in situ heart (Figs. 1D, 1H, 1L). To better compare Poincaré plots at all levels, we superimposed their corresponding plots on the same X- and Y-axes (Fig. 1M), demonstrating that IBIs of single cell action potentials display prominent dispersion in X- and Y-axes, compared to heart and EB recordings.
Self-similarity, fractality and power law behavior of BRV/HRV at the three levels
To test for self-similarity and fractality, IBIs were analyzed using DFA, which quantifies intrinsic fractal-like correlation properties of dynamic systems.11 As depicted in Supplementary Fig. 1, slope values (α) of all DFA plots were in the range of 0.9, and similar (P>0.05) in the three levels, demonstrating that single pacemaker cells exhibit self-similar and fractal behavior, indicating these properties are fundamental features of a single pacemaker cell. Respecting the power law analysis of the IBIs, as shown in Supplementary Fig. 4, a similar power law behavior is seen in the three levels.
The magnitude of BRV/HRV at the three levels
The quantitative measures of BRV/HRV at the three levels provides further evidence that the IBIs dispersion is larger in single cells than EBs and hearts. The hypothesis that BRV magnitude is larger in single cells than the network and in situ heart derives from two assumptions: (1) the larger the number of opposing effectors of pacemaker activity, the smaller the IBIs dispersion; (2) In the single cell the number of rate generators/modulators (e.g., Ca2+ and voltage clocks14) is smaller than the number at the tissue level or the in situ heart. Supporting this hypothesis, the IBIs coefficient of variance (IBI COV) (Fig. 2B), and SD1 (Fig. 2C) and SD2 (Fig. 2D) (the Poincaré plot measures) are larger in the single cardiomyocyte than in network or the heart, suggesting the marked increase in BRV occurs in transitioning from interconnected network to single cardiomyocyte. We tested the hypothesis that the largest BRV and IBIs dispersion is at the single cell level in experiments showing the IBIs range during 1800 sec recording session is progressively smaller when shifting from single cell, through small cluster to large cluster (Figs. 3A, 3B, 3C, respectively). The hypothesis is further corroborated by comparing action potentials IBI COV (Fig. 3D), SD1 (Fig. 3E) and SD2 (Fig. 3F) of a single cell, a small cluster and a larger cluster (see Methods). These findings illustrate that as more cells are included in the network, BRV parameters decrease sharply, suggesting the higher the number of interactions among the potential pacemakers, the smaller the variability around the mean beat rate. Finally, Fig. 3G demonstrates that IBI COV is similar within the group including the heart, EB and the large cluster (similar results were obtained for SD1 and SD2, data not shown), but is significantly (P<0.05) larger upon transiting to the small cluster and single cell.
Figure 2.
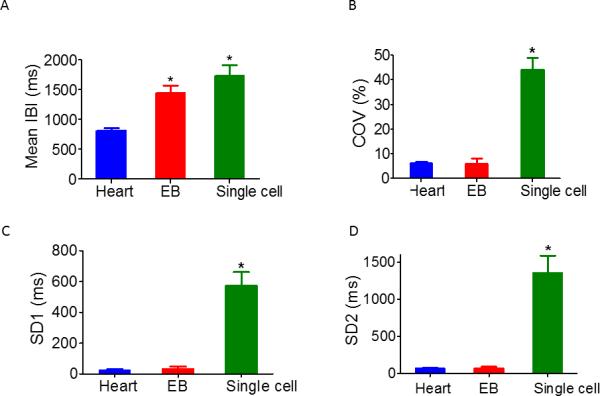
Comparisons of BRV/HRV magnitude at the three levels. Summary of Mean IBI [A], Coefficient of variance (COV) of IBIs (IBI COV) [B], SD1 [C] and SD2 [D] of Poincaré plots in heart in situ (n=5 individuals), contracting EBs (n=11), and single cardiomyocytes (n=22). In [A] *P <0.05, heart versus EB and single cell. In [B-D] *P <0.05, single cell versus EB and heart.
Figure 3.
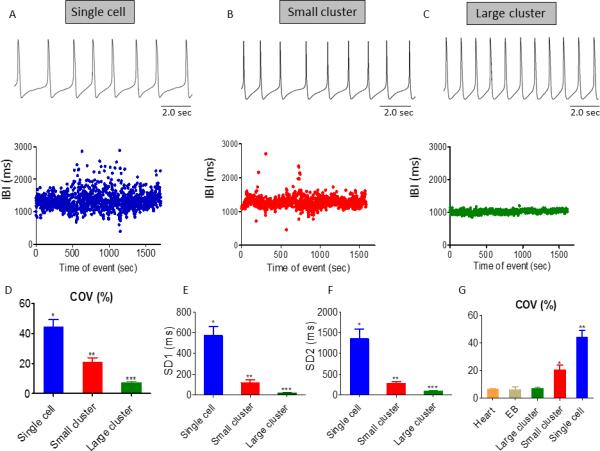
Comparisons of BRV/HRV magnitude among single cardiomyocytes, a small (5-10 cells) and a larger cluster (>10 cells). [A-C] Representative experiments depicting action potential (AP) recordings and their corresponding IBIs versus time plot in single cardiomyocyte, small and larger cluster, respectively. [D-F] Summary of IBI COV [D], SD1 [E] and SD2 [F] of Poincaré plots in single cardiomyocytes (n=28 individuals), small cluster (n=22) and larger cluster (n=13). In [D-F], *P <0.05, single cardiomyocytes versus small clusters versus large clusters. [G]: Summary of IBI COV in ECG (n=5), electrograms (n=11), and AP of large (n=13) and small (n=22) cardiomyocyte clusters, and single cardiomyocytes (n=28). In [G], *P <0.05, single cardiomyocyte versus small contracting EBs versus large contracting EBs, EB and Heart.
Mechanisms contributing to single cell BRV and fractal-like behavior
To study intracellular mechanisms contributing to BRV, we determined the effects of RU360 (mitochondrial Ca2+ uptake blocker15), GCP-37157 (mitochondrial Na+-Ca2+ exchanger antagonist16) and ryanodine (sarcoplasmic reticulum Ca2+-induced Ca2+-release channel blocker17), on firing pattern and BRV characteristics. As shown by the representative action potentials (Fig. 4A) and IBIs versus time plot (Fig. 4B), RU360 increased IBIs dispersion and decreased mean firing rate. This is seen in the flattening and widening of the IBIs histogram (black histogram compared to red histogram, Fig. 4C), and by the striking change in Poincaré plot pattern; in contrast to the condensed cloud during control, the post-drug cloud is markedly dispersed (Fig. 4D). The increased BRV magnitude is seen in the drug-induced increase in the IBI COV and the Poincaré plot indices SD1 and SD2 (Fig. 4E). Finally, despite the marked increase in BRV, fractality was unaltered; the slope values (α) of the DFA plot before and after RU360 were 0.974 and 0.8, respectively.
Figure 4.
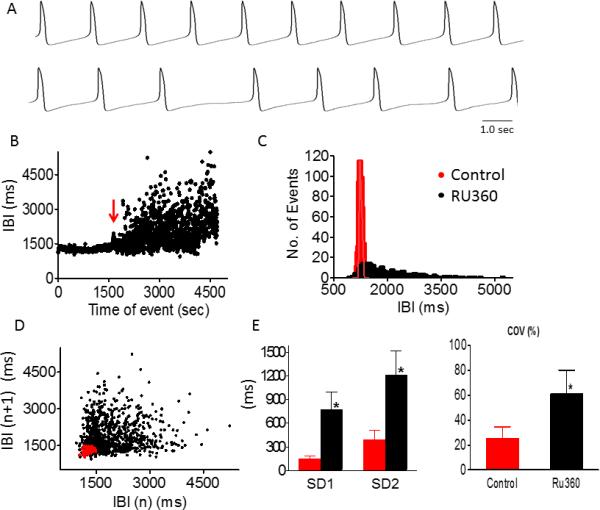
Effect of Ru360 on BRV magnitude of a small iPSC-CM cluster. Representative AP recordings in small cluster iPSC-CM, in absence (upper panel) and presence (lower panel) of 20 μM Ru360 [A], IBI analysis [B], histogram distribution of IBIs [C], Poincaré plots of IBI [D] and summary of IBIs COV, SD1 and SD2 [E], in absence (red dotted) and presence (black dotted) of Ru360. Ru360 increased IBI COV, SD1 and SD2 compared to control (*P<0.05, n=5). Red arrow indicates drug application.
GCP-37157 not only broadened IBIs range and increased IBI COV, SD1 and SD2 (Figs. 5A, 5C, 5E, 5G) similarly to RU360, but in 2/10 preparations it induced a bi-modal firing pattern (see change in action potential firing rhythm) (Figs. 5B, 5D, 5F), whereby the pacemaker oscillates between lower and higher firing rates. This novel observation is further illustrated by: (1) the bi-modal IBIs histograms, showing two distinct peaks; (2) four populations in the Poincaré plots, instead of one population in the regularly-firing pacemaker. We explain this phenomenon as follows. In each of the two green-circled clouds the population includes IBIn+1 and IBIn points firing at the same rate, representing the low- and high- level firing rates. For example, in Fig. 5F, the lower left population fires around IBI=1200 msec and the upper right population fires around IBI=2500 msec. Because in the Poincaré plot IBIn+1 is plotted against IBIn, the two blue-circled populations represent two groups of points in which the n points are either at 2500 or 1200 msec, and the n+1 points are either 1200 or 2500, respectively. In contrast to RU360, the prominent increase in BRV was associated with diminution of the fractal nature of the spontaneous firing; the slope value (α) of the DFA plot was decreased from 0.83+0.05 in the control to 0.69+0.04 (P<0.05, n=8) in the presence of GCP-37157.
Figure 5.
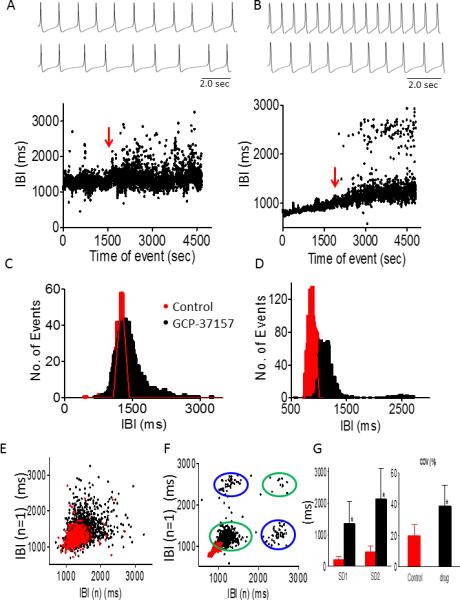
Effect of GCP-37157 (1 μM) on BRV magnitude in small iPSC-CM clusters. GCP-37157 increased BRV magnitude (n=8) and induced a bi-modal firing pattern (n=2). Representative AP recordings in absence (upper panel) and presence (middle panel) of 1 μM GCP-37157 and corresponding IBIs time plots (lower panel) of normal firing pattern [A] and a bimodal pattern [B], histogram distributions of IBIs [C-D], and Poincaré plots [E-F]. [G] Summary of effect of GCP-37157 on IBIs COV, SD1 and SD2. *P<0.05 GCP-37157 versus control (n=8). Red arrow indicates drug application.
Ryanodine increased IBIs dispersion (Fig. 6F) and converted the firing pattern from regular to bi-modal (in 3 of 4 experiments), as indicated by the two IBIs bands (Figs. 6A, 6D, 6E), the three-peaked IBIs histogram (Fig. 6B) and the 4 clouds in the Poincaré plot (Fig. 6C). Interestingly, whereas the IBIs time series show two dominant bands (e.g., Fig. 6A), the histogram shows three (black) populations (Fig. 6B). The left group represents the IBIs population immediately after ryanodine application, and the other two groups, the upper and lower distinct IBIs bands. Furthermore, with ryanodine, the Poincaré plot of the bi-modal firing pattern includes two left clouds and a right lower cloud, as previously explained. Hence (see also Figs. 6A, 6D, 6E) these results indicate the cell which alternates between the higher and the lower band of IBIs, mainly occupies the lower band (witnessed in a more condensed IBIs in the lower population). Finally, since ryanodine induced a bimodal firing pattern in 3 out of 4 cells, DFA could not be performed.
Figure 6.
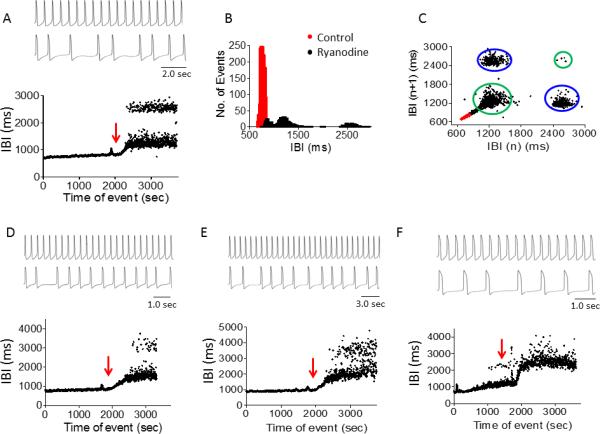
Effect of ryanodine (1 μM) on IBIs time series in small iPSC-CM clusters. Ryanodine induced a bimodal firing pattern (n=3) and increased BRV magnitude (n=1). [A-C] Representative experiment showing AP recording in absence (upper panel) and presence (middle panel) of ryanodine and a corresponding IBI time plot (lower panel) [A], IBIs histogram distribution [B] and Poincaré plots [C]. [D-E] Two additional experiments showing ryanodine-induced bimodality. [F] Ryanodine increased IBIs dispersion in 1 of 4 experiments. Red arrow indicates ryanodine application.
Does If contribute to BRV generation?
As depicted in Supplementary Fig. 5, the If blocker ivabradine decreased the firing rate18 but did not affect BRV properties (see Supplement).
Discussion
We investigated the origin of HRV by hypothesizing three-levels of interaction among different cardiomyocyte anatomical/functional entities: the single pacemaker cell, an EB composed of a network of electrically coupled pacemaker cells and the SAN in situ. To test the hypothesis we determined BRV/HRV properties in the in situ heart, EBs and single cardiomyocytes. The main findings were that: (1) BRV and self-similarity are shared at all levels; (2) BRV is greater in the single cell than the network and in situ heart; (3) Disrupting intracellular Ca2+ handling markedly augments BRV magnitude, suggesting that intracellular mechanisms contribute to BRV/HRV and the fractal behavior of the heart rhythm.
BRV/HRV and Poincaré plots
The basic features of BRV/HRV in single cell, network and heart are represented by the time series IBIs versus time plot and the IBIs histograms (Fig. 1). Both modes of presentation demonstrate the elementary features of BRV/HRV: variations in momentary IBI and dispersion of intervals around a mean heart rate. These novel findings demonstrate that BRV is a fundamental property of a single human cardiac pacemaker cell, and that (see below) IBIs dispersion is broader in single cells than in clusters and in situ heart. The validity of these conclusions is enhanced by similar observations in two volunteers. The Poincaré plot analysis of IBIs (Figs. 1D, 1H, 1L, 1M) demonstrates a cigar-like shape of the cloud at the three levels, although at the cell level the IBIs are more dispersed (addressed below).
Self-similarity, fractality and power law behavior
In the IBI time series, self-similarity and fractality are represented by linear slopes in the DFA plot (Supplementary Fig. 1). Finding similar linear slopes at all levels of organization signifies that the fluctuations are self-similar and this similarity is intrinsic to single cells, networks and in situ heart. Importantly, similar slope values have been reported for in situ hearts.2, 4, 19 Respecting power law behavior (see Results and Discussion in on-line supplement), our experimental findings suggest power-law behavior is intrinsic to pacemaker cells, being devoid of extrinsic influences, and does not necessarily stem from extra-cardiac factors, such as the autonomic nervous system.
The dependency of BRV on the organization level/structure
In addition to showing that BRV is a key feature of single pacemaker cells, we found the magnitude of the single cell IBIs dispersion is more pronounced than in EBs and the heart (Fig. 2). Moreover, because the quantitative measures of IBIs dispersion were similar in EB and in situ heart, we concluded that the step-wise decrease in BRV occurred between the level of single cells and EB. This concept of an abrupt decline in BRV when single cells become part of a coupled EB network is further strengthened by comparing the BRV measures at the single cell versus small (5-10 cells) and larger clusters (> 10 cells). This comparison shows the large decrease in BRV occurs between single cell and small cluster, and then BRV is further decreased as the number of cells increases in larger clusters. Finally (see Fig. 3G), BRV is similar in in situ heart, EB and large cluster and progressively larger in small cluster and single cell.
Why is BRV largest in single cells?
The continuum comprising pacemaker cell through multicellular interconnected network to in situ heart fits the definition of a biological system which is “temporally and spatially complex, built from a dynamic web of interconnected feedback loops marked by interdependence, pleiotropy and redundancy”.20 While temporal complexity (i.e., BRV) is most pronounced in single cells, the reverse is true for the spatial complexity; it is largest in in situ heart, resulting from increasingly complex architecture and multiple inputs, compared to single cell. The following arguments led us to propose the marked differences in spatial and architectural complexity between single cells and network/in situ heart, can account for the noticeable decrease in BRV between single cells and progressively larger multi-cellular clusters. Our key consideration is that in the highly dynamic system which generates heart rhythm, the overall noise level - BRV magnitude - is determined by the net effect of opposing inputs. Consequently, in single pacemaker cells isolated from their neighbors and deprived of extra-cardiac influences, the number of determinants of the final firing rate is small, and therefore the noise level, expressed as BRV magnitude, is much higher (lacking other adjacent dampening factors and negative feedback processes), compared to more spatially complex levels. The precise cause for the abrupt decline in BRV beyond the single cell level is not clear. Our findings that: (1) even a small increase in number of cells in the cluster is associated with a marked decrease in BRV (Fig. 3), and (2) BRV is not further decreased between EB and in situ heart, suggest the main determinant attenuating single cell BRV is coupling between oscillating pacemakers. Hence, in multicellular networks, multiple dynamic interactions between the pacemakers and the electrotonic interactions mask/dampen the single cell noise, thereby attenuating BRV.
The concept of noise reduction upon transiting from single cell to coupled network is supported by some representative reports: (1) Clay and DeHaan21 hypothesized the irregular firing patterns in spontaneously beating cells isolated from chick embryo heart are caused by stochastic gating properties of ion channels driving the cell to threshold potential. Pertaining to our study, they found the coefficient of the IBI variations is approximately inversely proportional to the square root of the number of interconnected cells.21 (2) Similarly in spontaneously-firing rat ventricular myocytes, single isolated cardiomyocytes beat slowly and irregularly, and irregularity decreases “as soon as pacemaker heart cells grow together and small groups form”.22 This decline in irregularity (i.e., decreased BRV) was explained by the large increase in the total number of ion channels in the network, which dampen the inherent variations in individual channels.22
What are the intracellular mechanisms underlying the single cell BRV?
That BRV is largest in single cells can be explained by several intracellular mechanisms influencing the firing rate, which are themselves non-linear fractal processes. These include intracellular sarcoplasmic reticulum (SR) Ca2+ cycling,23, 24 IP3-linked signaling,25 mitochondrial function and variations in intracellular processes such as expression of circadian clock genes26 and redox state.27 Collectively, these can account for the fractal behavior of the single cell firing behavior.28 Aon and coworkers reported that in guinea pig cardiomyocytes the mitochondrial membrane potential (ΔΨm) and reactive oxygen species (which couple individual mitochondria) exhibit fractality and power law behavior.29, 30 Because mitochondrial ability to accumulate and release large quantities of Ca2+ depends on ΔΨm (which exhibits fractal behavior), it is likely that mitochondrial Ca2+ extrusion also is fractal. Consequently, based on mitochondrial-SR Ca2+crosstalk,31, 32 it is conceivable that the ‘noisy’ fractal features of the mitochondria are transmitted to the “Ca2+ clock”23, 24 which participates in pacing, and consequently contributes to BRV. In agreement with reports on the fractal behavior of mitochondrial function and intracellular Ca2+ cycling, and the crosstalk between SR and mitochondria,32 we demonstrated that interfering with intracellular Ca2+ handling markedly augments BRV magnitude. Specifically, RU360 and GCP-37157 increased the quantitative measures of BRV: IBI COV, SD1 and SD2. Furthermore, in a sizable proportion of preparations, both GCP-37157 (20%) and ryanodine (75%) (Figs. 5 and 6, respectively) caused bimodal firing patterns. GCP-37157 also significantly decreased the linear slopes in the DFA, suggesting it had disturbed the fractal-like behavior of IPSC-CM. Finally, in contrast to our findings, in previous studies RU360 was shown to increase spontaneous firing rate in rabbit SAN cells32, HL-1 cardiomyocytes33 and Cajal cells.34 The decrease in rate in our study may imply that in iPSC-CM inhibition of mitochondrial Ca2+ eliminates its role in matching ATP supply to demand, which differ from that in rabbit pacemaker cells.35
Two immediate questions arise from these findings:
(1) Why does blocking Ca2+ intracellular movements markedly augment BRV?
There is an inverse relationship between the number of elements impacting on the pacing machinery and BRV magnitude; namely, the fewer the effectors the larger BRV magnitude.22 Consequently, eliminating a key intracellular factor such as mitochondrial Ca2+ cycling would augment BRV magnitude. This notion is supported by the experiments showing that blocking the pacemaker current If did not affect BRV (Supplementary Fig. 5); while ivabradine decreases spontaneous firing rate, it does not affect the fundamental pacing machinery driven by intracellular Ca2+ cycling.18 In contrast to our finding Camm et al showed that ivabradine increased HRV in patients with chronic stable angina.36 However, as described herein, there are two fundamental differences which contribute to the dissimilarity between the studies. Firstly, our iPSC-CM were generated from healthy volunteers, as opposed to the angina patients studied by Camm et al. Secondly, we investigated the acute effects of ivabradine, while the angina patients received continuous ivabradine treatment for 3 months. In summary, due to the different experimental settings, these two studies cannot be considered contradictory. Given these observations, our future studies will attempt to decipher discrete mitochondrial and SR mechanisms contributing/generating BRV and hence HRV, in healthy and diseased pacemaker cells/hearts. Accordingly, it is plausible that in settings involving disturbed Ca2+ handling, such as heart failure, alterations in HRV properties37, 38 are in part due to changes in BRV properties in single cells.
(2) Why do GCP-37157 and ryanodine induce bi-modal firing patterns?
It is plausible that the bi-modal firing patterns induced by GCP-37157 and ryanodine (Figs. 5 and 6) are abnormal, distinct from the dominant pattern in which all IBIs form a single population. This bimodality reflects pacemaker alternation between two basic mean firing rates and is clearly demonstrated by the double-peaked IBIs histogram and the four Poincaré clouds (e.g., Fig. 5B, 6D-6E). Thus, time series analytical techniques (such as Poincaré plots) reveal internal events and abnormal firing patterns which are unseen when only mean heart rate is calculated. The pattern in cells most closely resembles the bi-modal firing pattern we report is Jongsma et al's demonstration in spontaneously contracting neonatal rat heart cells.22 In their Figs. 5B and 7A, the IBIs distribution displays two peaks, albeit not as distinct as those in our study. Stronger support for (pathological) bimodal firing behavior comes from an analysis of HRV properties in healthy volunteers and in patients with sick sinus syndrome (SSS).39 In agreement with our findings, the authors’ Fig. 3 shows a bimodal heart rate firing pattern seen in: (1) the R-R interval versus time plot demonstrating two discrete R-R intervals at ~1.0 and 1.6 sec. (2) Poincaré plots of SSS patients depict four populations. While we cannot offer a mechanistic explanation for the bimodality recorded in drug-treated iPSCCM, it is intriguing that the irregular firing pattern recorded in situ in SSS patients is paralleled by the in vitro firing behavior in iPSC-CM with disturbed Ca2+ handling. However, in the absence of a clear mechanism, we speculate that it may be linked with waxing and waning of intracellular Ca2+ due to feedback and feed-forward signaling within pacemaker cells.
The similarity between iPSC-CM and adult pacemaker cells
Regarding the cardiac phenotype of iPSC-CM, we and others have investigated mRNA and protein expression patterns of iPSC-CM. Specifically, we have shown in iPSC-CM by means of immunostaining and RT-PCR the expression of the typical cardiac markers, cardiac troponin I and T, α-sarcomeric actinin, myosin heavy chain, ryanodine receptor and calsequestrin.9, 40 Further, Honda et al showed in iPSC-CM the expression of additional cardiac genes such as the sodium channel (NaV1.5; SCN5A), the α-1C and α-1D subunits of the L-type Ca2+ channel, the rapidly activating delayed rectifier potassium channel (hERG; KCNH2), the transient outward potassium channel (KV4.3; KCND3) and the hyperpolarization-activated cyclic nucleotide gated channels (HCN2, HCN4).41 Next, the following observations support the similarity between the pacemaker mechanisms in the iPSC-CM used in the present work, and adult pacemaker cells: (1) We showed in the Supplement that ivabradine decreased the spontaneous firing rate, indicating that If is present and contributes to pacemaker mechanisms in iPSC-CM. (2) In preliminary experiments we found that nifedipine decreased the spontaneous firing rate of both single cardiomyocytes and networks (EBs) of cells, indicating the L type Ca2+ channel (ICa,L) contributes to automaticity. (3) We have previously demonstrated that isoproterenol and carbamylcholine increase or decrease, respectively, the spontaneous firing rate of iPSC-CM networks.6 In addition, Fine et al characterized in iPSC-CM several cardiac ion transporters such as Na+/K+ pump and NCX currents, and showed that their current densities were similar to those of adult rabbit and guinea pig cardiomyocytes.42 Collectively, these findings demonstrate that the pacemaker mechanisms in iPSC-CM are similar to those of the adult pacemaker cells.
Study limitation
Whereas ECG recordings were obtained from 5 healthy female volunteers, iPSC clones were generated from only two of them. Yet, these iPSC clones were sufficient to establish the association between the clinical data (ECG) and the data from the other two cellular levels (networks, single cells).
Conclusions
We have shown for the first time that BRV and power law behavior are intrinsic features of single human cardiac pacemaker cells derived from iPSC. Further, we discovered that BRV is markedly enhanced at the single cell level compared to excitable network and in situ heart. Our findings suggest the major increase in IBIs variability occurs in transitioning from interconnected network to single cardiomyocyte. Based on these novel findings we propose intracellular calcium cycling contributes to BRV/HRV and the fractal behavior of cardiac rhythm. Our observations support the compatibility of iPSC-CM as biological pacemakers, as they not only fire spontaneously, but also present inherent dynamic pacemaker properties.
Supplementary Material
Acknowledgement
The authors wish to thank Dr. Lennart Bergfeldt for his critical reading of the manuscript and for his valuable comments.
Funding sources
This work was supported by the Israel Science Foundation (ISF), Ministry of Health - Chief Scientist, the Rappaport Institute, The Sohnis and Forman Families Stem Cells Center, USPHS-NHLBI grants HL-094410 and HL-111401.
List of abbreviations
- HRV
heart rate variability
- hESC
human embryonic stem cell
- hESC-CM
human embryonic stem cell-derived cardiomyocytes
- iPSC
induced pluripotent stem cell
- iPSC-CM
induced pluripotent stem cell-derived cardiomyocytes
- BRV
beat rate variability
- SAN
sinoatrial node
- ECG
Electrocardiogram
- AP
action potential
- EB
embryoid body
- MEA
Micro-Electrode-Array
- DFA
detrended fluctuation analysis
- IBI
inter-beat interval
- IBI COV
inter-beat interval coefficient of variance
- SR
sarcoplasmic reticulum
- SSS
sick sinus syndrome
Footnotes
Conflict of Interest Disclosures: None.
References
- 1.Acharya UR, Joseph KP, Kannathal N, Lim CM, Suri JS. Heart rate variability: a review. Med Bio Eng Comput. 2006;44:1031–1051. doi: 10.1007/s11517-006-0119-0. [DOI] [PubMed] [Google Scholar]
- 2.Krstacic G, Parati G, Gamberger D, Castiglioni P, Krstacic A, Steiner R. Heart rate variability and nonlinear dynamic analysis in patients with stress-induced cardiomyopathy. Med Biol Eng Comput. 2012;50:1037–1046. doi: 10.1007/s11517-012-0947-z. [DOI] [PubMed] [Google Scholar]
- 3.Goldberger AL, Amaral LAN, Hausdorff JM, Ivanov PC, Peng CK, Stanley HE. Fractal dynamics in physiology: Alterations with disease and aging. Proc Natl Acad Sci U S A. 2002;99(Suppl. 1):2466–2472. doi: 10.1073/pnas.012579499. [DOI] [PMC free article] [PubMed] [Google Scholar]
- 4.McSharry PE, Malamud BD. Quantifying self-similarity in cardiac inter-beat interval time series. Comput Cardiol. 2005;32:459–462. [Google Scholar]
- 5.Bigger JT, Jr, Steinman RC, Rolnitzky LM, Fleiss JL, Albrecht P, Cohen RJ. Power law behavior of RR-interval variability in healthy middle-aged persons, patients with recent acute myocardial infarction, and patients with heart transplants. Circulation. 1996;93:2142–2151. doi: 10.1161/01.cir.93.12.2142. [DOI] [PubMed] [Google Scholar]
- 6.Mandel Y, Weissman A, Schick R, Barad L, Novak A, Meiry G, Goldberg S, Lorber A, Rosen MR, Itzkovitz-Eldor J, Binah O. Human embryonic and induced pluripotent stem cell-derived cardiomyocytes exhibit beat rate variability and power-law behavior. Circulation. 2012;125:883–893. doi: 10.1161/CIRCULATIONAHA.111.045146. [DOI] [PMC free article] [PubMed] [Google Scholar]
- 7.Kucera JP, Heuschkel MO, Renaud P, Rohr S. Power-law behavior of beat-rate variability in monolayer cultures of neonatal rat ventricular myocytes. Circ Res. 2000;86:1140–1145. doi: 10.1161/01.res.86.11.1140. [DOI] [PubMed] [Google Scholar]
- 8.Soen Y, Braun E. Scale-invariant fluctuations at different levels of organization in developing heart cell networks. Phys Rev E. 2000;61:R2216–2219. doi: 10.1103/physreve.61.r2216. [DOI] [PubMed] [Google Scholar]
- 9.Novak A, Shtrichman R, Germanguz I, et al. Enhanced reprogramming and cardiac differentiation of human keratinocytes derived from plucked hair follicles, using a single excisable lentivirus. Cell Reprogram. 2010;12:665–678. doi: 10.1089/cell.2010.0027. [DOI] [PubMed] [Google Scholar]
- 10.Novak A, Barad L, Zeevi-Levin N, Schick R, Shtrichman R, Lorber A, Itskovitz-Eldor J, Binah O. Cardiomyocytes generated from CPVTD307H patients are arrhythmogenic in response to β-adrenergic stimulation. J Cell Mol Med. 2012;16:468–482. doi: 10.1111/j.1582-4934.2011.01476.x. [DOI] [PMC free article] [PubMed] [Google Scholar]
- 11.Peng CK, Havlin S, Stanley HE, Goldberger AL. Quantification of scaling exponents and crossover phenomena in nonstationary heartbeat time series. Chaos. 1995;5:82–87. doi: 10.1063/1.166141. [DOI] [PubMed] [Google Scholar]
- 12.Kamen PW, Krum H, Tonkin AM. Poincaré plot of heart rate variability allows quantitative display of parasympathetic nervous activity in humans. Clin Sci (Lond) 1996;91:201–208. doi: 10.1042/cs0910201. [DOI] [PubMed] [Google Scholar]
- 13.Liebovitch LS. Fractals and chaos simplified for the life sciences. 1998.
- 14.Lakatta EG, Maltsev VA, Vinogradova TM. Vinogradova: A coupled SYSTEM of intracellular Ca2+ clocks and surface membrane voltage clocks controls the timekeeping mechanism of the heart's pacemaker. Circulation Res. 2010;106:659–673. doi: 10.1161/CIRCRESAHA.109.206078. [DOI] [PMC free article] [PubMed] [Google Scholar]
- 15.Matlib MA, Zhou Z, Knight S, Ahmed S, Choi KM, Kraue-Bauer J, Phillips R, Altschuld R, Katsube Y, Sperelakis N, Bers DM. Oxygen-bridged dinuclear ruthenium amine complex specifically inhibits Ca2+uptake into mitochondria in vitro and in situ in single cardiac myocytes. J Biol Chem. 1998;273:10223–10231. doi: 10.1074/jbc.273.17.10223. [DOI] [PubMed] [Google Scholar]
- 16.Griffiths EJ, Wei SK, Haigney MC, Ocampo CJ, Stern MD, Silverman HS. Inhibition of mitochondrial calcium efflux by clonazepam in intact single rat cardiomyocytes and effects on NADH production. Cell Calcium. 1997;21:321–329. doi: 10.1016/s0143-4160(97)90120-2. [DOI] [PubMed] [Google Scholar]
- 17.Li J, Qu J, Nathan RD. Ionic basis of ryanodin's negative chronotropic effect on pacemaker cells isolated from the sinoatrial node. Am J Physiol. 1997;273:H2481–2489. doi: 10.1152/ajpheart.1997.273.5.H2481. [DOI] [PubMed] [Google Scholar]
- 18.El Chemaly A, Magaud C, Patri S, Jayle C, Guinamard R, Bois P. The heart rate-lowering agent ivabradine inhibits the pacemaker current I(f) in human atrial myocytes. J Cardiovasc Electrophysiol. 2007;18:1190–1196. doi: 10.1111/j.1540-8167.2007.00955.x. [DOI] [PubMed] [Google Scholar]
- 19.Signorini MG, Ferrario M, Marchetti M, Marseglia A. Nonlinear analysis of heart rate variability signal for the characterization of cardiac heart failure patients. Conf Proc IEEE Eng Med Biol Soc. 2006;1:3431–3434. doi: 10.1109/IEMBS.2006.259744. [DOI] [PubMed] [Google Scholar]
- 20.Seely AJ, Macklem PT. Complex systems and the technology of variability analysis. Crit Care. 2004;8:R367–384. doi: 10.1186/cc2948. [DOI] [PMC free article] [PubMed] [Google Scholar]
- 21.Clay JR, DeHaan RL. Fluctuations in interbeat interval in rhythmic heart-cell clusters. Role of membrane voltage noise. Biophys J. 1979;28:377–389. doi: 10.1016/S0006-3495(79)85187-5. [DOI] [PMC free article] [PubMed] [Google Scholar]
- 22.Jongsma HJ, Tsjernina L, de Bruijne J. The establishment of regular beating in populations of pacemaker heart cells. A study with tissue-cultured rat heart cell. J Mol Cell Cardiol. 1983;15:123–133. doi: 10.1016/0022-2828(83)90288-2. [DOI] [PubMed] [Google Scholar]
- 23.Lakatta EG, Vinogradova TM, Maltsev VA. The missing link in the mystery of normal automaticity of cardiac pacemaker cells. Ann N Y Acad Sci. 2008;1123:41–57. doi: 10.1196/annals.1420.006. [DOI] [PMC free article] [PubMed] [Google Scholar]
- 24.Maltsev AV, Maltsev VA, Mikheev M, Maltseva LA, Sirenko SG, Lakatta EG, Stern MD. Synchronization of stochastic Ca2+ release units creates a rhythmic Ca2+ clock in cardiac pacemaker cells. Biophys J. 2011;100:271–283. doi: 10.1016/j.bpj.2010.11.081. [DOI] [PMC free article] [PubMed] [Google Scholar]
- 25.Ju YK, Woodcock EA, Allen DG, Cannell MB. Inositol 1,4,5-trisphosphate receptors and pacemaker rhythms. J Mol Cell Cardiol. 2012;53:375–381. doi: 10.1016/j.yjmcc.2012.06.004. [DOI] [PubMed] [Google Scholar]
- 26.Durgan DJ, Pat BM, Laczy B, et al. O-GlcNAcylation, novel post-translational modification linking myocardial metabolism and cardiomyocyte circadian clock. J Biol Chem. 2011;286:44606–44619. doi: 10.1074/jbc.M111.278903. [DOI] [PMC free article] [PubMed] [Google Scholar]
- 27.Kapelko VI. Redox control of cardiac rhythm. Biochemistry (Mosc) 2012;77:1248–1257. doi: 10.1134/S000629791211003X. [DOI] [PubMed] [Google Scholar]
- 28.Binah O, Weissman A, Itskovitz-Eldor J, Rosen MR. Integrating beat rate variability: from single cells to hearts. Heart Rhythm. 2013;10:928–932. doi: 10.1016/j.hrthm.2013.02.013. [DOI] [PMC free article] [PubMed] [Google Scholar]
- 29.Aon MA, Cortassa S, O'Rourke B. The fundamental organization of cardiac mitochondria as a network of coupled oscillators. Biophys J. 2006;91:4317–4327. doi: 10.1529/biophysj.106.087817. [DOI] [PMC free article] [PubMed] [Google Scholar]
- 30.Aon MA, Roussel MR, Cortassa S, O'Rourke B, Murray DB, Beckmann M, Lloyd D. The scale-free dynamics of eukaryotic cells. PLoS One. 2008;3:e3624. doi: 10.1371/journal.pone.0003624. [DOI] [PMC free article] [PubMed] [Google Scholar]
- 31.Ruiz-Meana M, Fernandez-Sanz C, Garcia-Dorado D. The SR-mitochondria interaction: a new player in cardiac pathophysiology. Cardiovasc Res. 2010;88:30–39. doi: 10.1093/cvr/cvq225. [DOI] [PubMed] [Google Scholar]
- 32.Yaniv Y, Spurgeon HA, Lyashkov AE, Yang D, Ziman BD, Maltsev VA, Lakatta EG. Crosstalk between mitochondrial and sarcoplasmic reticulum Ca2+ cycling modulates cardiac pacemaker cell automaticity. PLoS One. 2012;7:e37582. doi: 10.1371/journal.pone.0037582. [DOI] [PMC free article] [PubMed] [Google Scholar]
- 33.Takeuchi A, Kim B, Matsuoka S. The mitochondrial Na+-Ca2+ exchanger, NCLX, regulates automaticity of HL-1 cardiomyocytes. Sci Rep. 2013;3:2766. doi: 10.1038/srep02766. [DOI] [PMC free article] [PubMed] [Google Scholar]
- 34.Hashitani H, Lang RJ, Suzuki H. Role of perinuclear mitochondria in the spatiotemporal dynamics of spontaneous Ca2+ waves in interstitial cells of Cajal-like cells of the rabbit urethra. Br J Pharmacol. 2010;161:680–94. doi: 10.1111/j.1476-5381.2010.00902.x. [DOI] [PMC free article] [PubMed] [Google Scholar]
- 35.Yaniv Y, Spurgeon HA, Ziman BD, Lyashkov AE, Lakatta EG. Mechanisms that match ATP supply to demand in cardiac pacemaker cells during high ATP demand. Am J Physiol Heart Circ Physiol. 2013;304:H1428–1438. doi: 10.1152/ajpheart.00969.2012. [DOI] [PMC free article] [PubMed] [Google Scholar]
- 36.Borer JS, Le Heuzey JY. Characterization of the heart rate-lowering action of ivabradine, a selective I(f) current inhibitor. Am J Ther. 2008;15:461–473. doi: 10.1097/MJT.0b013e3181758855. [DOI] [PubMed] [Google Scholar]
- 37.Woo MA, Stevenson WG, Moser DK, Trelease RB, Harper RM. Patterns of beat-to-beat heart rate variability in advanced heart failure. Am Heart J. 1992;123:704–710. doi: 10.1016/0002-8703(92)90510-3. [DOI] [PubMed] [Google Scholar]
- 38.Kleiger RE, Miller JP, Bigger JT, Jr, Moss AJ. Decreased heart rate variability and its association with increased mortality after acute myocardial infarction. Am J Cardiol. 1987;59:256–262. doi: 10.1016/0002-9149(87)90795-8. [DOI] [PubMed] [Google Scholar]
- 39.Bergfeldt L, Haga Y. Power spectral and Poincaré plot characteristics in sinus node dysfunction. J Appl Physiol. 2003;94:2217–2224. doi: 10.1152/japplphysiol.01037.2002. [DOI] [PubMed] [Google Scholar]
- 40.Germanguz I, Sedan O, Zeevi-Levin N, Shtrichman R, Barak E, Ziskind A, Eliyahu S, Meiry G, Amit M, Itskovitz-Eldor J, Binah O. Molecular characterization and functional properties of cardiomyocytes derived from human inducible pluripotent stem cells. J Cell Mol Med. 2011;15:38–51. doi: 10.1111/j.1582-4934.2009.00996.x. [DOI] [PMC free article] [PubMed] [Google Scholar]
- 41.Honda M, Kiyokawa J, Tabo M, Inoue T. Electrophysiological characterization of cardiomyocytes derived from human induced pluripotent stem cells. J Pharmacol Sci. 2011;117:149–159. doi: 10.1254/jphs.11038fp. [DOI] [PubMed] [Google Scholar]
- 42.Fine M, Lu FM, Lin MJ, Moe O, Wang HR, Hilgemann DW. Human-induced pluripotent stem cell-derived cardiomyocytes for studies of cardiac ion transporters. Am J Physiol Cell Physiol. 2013;305:C481–491. doi: 10.1152/ajpcell.00143.2013. [DOI] [PMC free article] [PubMed] [Google Scholar]
Associated Data
This section collects any data citations, data availability statements, or supplementary materials included in this article.