Abstract
There is evidence that normal breast stromal fibroblasts (NBFs) suppress tumour growth, while cancer-associated fibroblasts (CAFs) promote tumourigenesis through functional interactions with tumour cells. Little is known about the biology and the carcinogenic potential of stromal fibroblasts present in histologically normal surgical margins (TCFs). Therefore, we first undertook gene expression analysis on five CAF/TCF pairs from breast cancer patients and three NBF samples (derived from mammoplasties). This comparative analysis revealed variation in gene expression between these three categories of cells, with a TCF-specific gene expression profile. This variability was higher in TCFs than in their paired CAFs and also NBFs. Cytokine arrays show that TCFs have a specific secretory cytokine profile. In addition, stromal fibroblasts from surgical margins expressed high levels of α-SMA and SDF-1 and exhibited higher migratory/invasiveness abilities. Indirect co-culture showed that TCF cells enhance the proliferation of non-cancerous mammary epithelial cells and the epithelial-to-mesenchymal transition of breast cancer cells. Moreover, TCF and CAF cells increased the level of PCNA, MMP-2 and the phosphorylated/activated form of Akt in normal breast luminal fibroblasts in a paracrine manner. Furthermore, TCFs were able to promote the formation and growth of humanized orthotopic breast tumours in nude mice. Interestingly, these TCF phenotypes and the extent of their effects were intermediate between those of NBFs and CAFs. Together, these results indicate that stromal fibroblasts located in non-cancerous tissues exhibit a tumour-promoting phenotype, indicating that their presence post-surgery may play important roles in cancer recurrence. © 2013 The Authors. Journal of Pathology published by John Wiley & Sons Ltd on behalf of Pathological Society of Great Britain and Ireland.
Keywords: breast cancer, stromal fibroblasts, gene expression, epithelial-to-mesenchymal transition
Introduction
Carcinomas are composed of neoplastic cells admixed with many types of supportive cells, which constitute the tumour stroma 1,2. Cancer-associated fibroblasts (CAFs), the predominant cell type within cancer stroma, play significant roles in overall breast cancer development and spread 3,4. Genetic and epigenetic changes activate stromal fibroblasts, which then escort cancer cells throughout the whole carcinogenic process in a paracrine manner 5,6. Indeed, activated fibroblasts secrete high levels of various growth factors, cytokines, chemokines and extracellular matrix (ECM)-degrading proteases such as the MMPs, which are used to communicate with cancer cells as well as with other stromal cells 4,7. CAFs exhibit some important features of neoplastic cells 8 and have been shown to promote carcinogenesis both in vitro and in animal models 3,4. High numbers of active stromal fibroblasts are often associated with high-grade malignancies and poor prognosis. Furthermore, CAFs were shown to play major roles in drug resistance and tumour recurrence.
Surgery is considered the first line of treatment for most breast tumours. During lumpectomy, the tumour is removed with some normal surrounding tissues (surgical margins) to ensure the removal of all tumour cells and to minimize local recurrence. Indeed, numerous studies have reported that surgical margin status influences the risk of local recurrence 9. Recurrences arise most frequently in the tumour bed. Thereby, radiotherapy is usually applied as adjuvant therapy to reduce the risk of relapse 10. Furthermore, targeted intraoperative radiotherapy (TARGIT) was also used and yielded very low recurrence rates when given as a boost 11. Importantly, TARGIT impaired the stimulation of breast cancer cell proliferation and invasion caused by surgical wounding 12. This may be due to the immediate effect of radiation on the local tumour microenvironment, making it less favourable for tumour growth and progression. This suggests that cancer may recur following breast conserving surgery due to residual unresected tumour or to the presence of active stromal cells, or both. In fact, even in tumour-free tissues, the microenvironment could still play a capital role in tumour development/recurrence. Indeed, it has been recently shown that breast cancers with higher mean stiffness values at shear-wave elastography, which is related to the surrounding stroma rather than to the cancer itself, had poorer prognostic features 13. Therefore, we sought to undergo molecular and cellular characterization of breast stromal fibroblasts from negative surgical margins. We show that these cells exhibit a specific gene expression profile and are procarcinogenic.
Materials and methods
Cells, cell culture and chemicals
Breast fibroblasts were obtained, characterized and cultured as previously described 8. Signed informed consent was obtained from all patients under Research Ethical Committee Project No. RAC#2031091. CAFs were derived from tumour areas of the samples, while TCFs were developed from histologically normal tissues located at least 2 cm away from tumours (invasive ductal carcinomas). Processing of tissues was performed after routine examination by a certified anatomical pathologist, using haematoxylin and eosin (H&E)-stained sections. Normal fibroblasts (NBFs) and epithelial cells (NLECs) were derived from healthy age-matched females who underwent breast reduction surgery. In the present experiments, NBFs, CAFs and their corresponding TCFs were always cultured simultaneously, under the same conditions and at similar passages (4–8). NLEC cells were cultured in universal medium [1:1 mixture of Dulbecco's modified Eagle's medium (DMEM) and Ham's F12 medium (Gibco) supplemented with 2% fetal bovine serum (FBS), 1% antibiotic/antimycotic, 10 ng/ml epidermal growth factor (EGF), 10–8 m choleratoxin, 1% ITS (insulin, transferrin, selenium), 0.4 µg/ml hydrocortisone, 2 × 10⁻⁹ m T3 (tri-iodothyronine) and 5 mg/ml oestrogen, and were used at passage 2. MCF-7 and MCF-10 cell lines were obtained from ATCC and were cultured following the instructions of the company. All supplements were obtained from Sigma (St. Louis, MO, USA), except for antibiotic/antimycotics and ITS, which were obtained from Gibco (Grand Island, NY, USA). The cells were maintained at 37°C in a humidified incubator with 5% CO2.
Conditioned medium (CM) was obtained from cells cultured in medium with serum, whilst serum-free conditioned medium (SFCM) was obtained from cells cultured in the absence of serum. In both cases, the cells were cultured for 24 h before the media were collected and centrifuged. The resulting supernatants were used either immediately or were frozen at −80°C until needed.
Affymetrix exon array and data analysis; quantitative RT–PCR
Exon array protocols are presented in Supplementary materials and methods. Quantitative RT–PCR was conducted as described previously 14. All reactions were performed in triplicate and the data analysed using the 2–ΔΔCt method 15,16. The respective primers are presented in Supplementary materials and methods.
Cell proliferation assay
Cells were seeded into 96-well plates at 0.5–1 × 10⁴ cells/well and incubated overnight. The medium was replaced with SFCM and incubated for different time intervals (0, 24 and 48 h). Cell proliferation was measured by the tetrazolium salt colorimetric assay, as recommended by the manufacturer (Roche Diagnostics GmbH, Germany) after incubation for 4 h at 37°C. The amount of formazan was quantified at 450 nm.
Immunoblotting, cytokine array and ELISA
Immunoblotting of total cell protein lysates was performed as previously described 17. Antibodies are presented in Supplementary materials and methods. SFCMs from CAF, TCF and NBF cells were applied to a RayBio Human Cytokine Antibody array (RayBiotech Inc.), as recommended by the manufacturer. ELISA was performed according to the manufacturer's instructions (R&D Systems; or RayBiotech for MMP-2). These experiments were performed in triplicate.
Chemotaxis and invasion assay
Invasion chambers (24-well) were used according to the manufacturer's guidelines (BD Bioscience); 2–4 × 10⁵ cells were added to the upper wells, separated by an 8 µm pore size PET membrane with a thin layer of Matrigel basement membrane matrix (for invasion) or without (for migration). The membranes were stained with Diff Quick (Fisher Scientific) after removing the non-migrated cells from the top of the membrane, using Q-tips. After air-drying, the membranes were cut and mounted on slides with oil and cells that had migrated to the underside of the filter were counted using a light microscope (Zeiss Axio Observer) in five randomly selected fields (magnification ×40). Each assay was performed in triplicate.
Orthotopic tumour xenografts
Animal experiments were approved by the KFSH & RC Institutional Animal Care and Use Committee (ACUC) and were conducted according to relevant national and international guidelines. Fifteen female nude mice were randomized into three groups and breast cancer orthotopic xenografts were created by co-implantation of MDA-MB-231 cells (5 × 10⁶) with NBF-6, TCF-180 or CAF-180 cells (2 × 10⁶) under the nipple of each mouse. Tumour size was measured with a caliper, using the formula: length × width × height.
Statistical analysis
Statistical analysis was performed using Student's t-test and p < 0.05 was considered statistically significant.
Results
Surgical margin stromal fibroblasts exhibit a specific gene expression profile
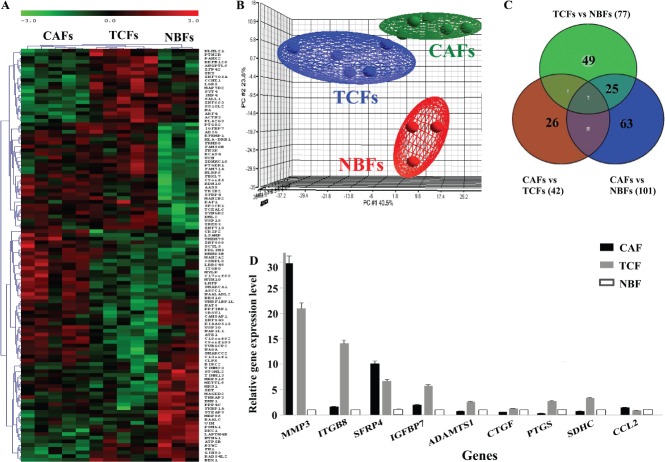
To identify the molecular changes that can take place in breast stromal fibroblasts from surgical margins, gene expression profiles of five paired CAFs/TCFs as well as three NBFs were examined. Total RNA was extracted and genome-wide gene expression analysis was performed, using Affymetrix's GeneChip® Human Exon 1.0 ST Arrays (HE 1.0 STAs). Three different comparisons were performed: TCFs with CAFs; TCFs with NBFs; and CAFs with NBFs. p < 0.05 and a threshold of absolute fold change ≤ 2 ≥ was considered a significant difference in the analysis of the microarray data. One-way analysis of variance (ANOVA) revealed 804 differentially expressed genes (DEGs) between TCF, CAF and NBF cells. The unsupervised two-dimensional (2D) hierarchical clustering revealed a clear pattern of gene expression, defining three main transcriptome clusters corresponding to TCFs, CAFs and NBFs (Figure 1A).
Figure 1.
Differential gene expression between CAFs, TCFs and NBFs. Total RNA from five CAFs, their corresponding TCFs as well as three NBFs was used to perform genome-wide gene expression analysis. (A) Unsupervised 2D hierarchical clustering of significantly varying genes across the three groups was performed using Pearson's correlation with average linkage clustering (only the top 112 of the most significantly dysregulated genes are shown for readability). (B) The three dominant PCA components that contained about 70% of the variance in the data matrix clearly distinguished samples as CAF, TCF and NBF. (C) Venn diagram showing differential gene expression between the groups. (D) qRT–PCR data for the indicated genes (mean ± SD)
Unsupervised principle components analysis (PCA), which contained about 70% of the variance in the data matrix, further showed the presence of three distinct groups (Figure 1B). Intriguingly, the TCF samples clustered closer to CAF cells than to NBFs. Moreover, the gene expression variability was highest for the TCF group (Figure 1B). Next, Venn diagram analysis was performed, with the significance of overlaps calculated using hypergeometric distributional assumption 18 and p values were adjusted using Bonferroni correction for multiple comparisons 19. This comparison approach revealed a significant overlap between TCFs and CAFs as compared to the two other comparisons (p < 10–5) (Figure 1C). Indeed, among the three comparisons, the least number of DEGs was between CAFs versus TCFs, with only 42 DEGs (Figure 1C). On the other hand, the number of DEGs between CAFs and NBFs reached 101 (Figure 1C). Comparing TCF with NBF, we found 77 DEGs, 25 of which were also differentially expressed between CAFs and NBFs, while the levels of 49 genes were uniquely dysregulated in TCFs as compared to NBFs and CAFs (Figure 1C; see also Supplementary material, Table S1). This indicates that TCF cells present in surgical margins exhibit specific gene expression patterns relative to their corresponding CAFs and also normal breast fibroblasts.
Quantitative RT–PCR validation of gene expression results
To validate the RNA microarray analysis, we performed quantitative RT–PCR on nine genes: MMP-3, ITGB8, SFRP4, ITGBP7, ADAMTS1, CTGF, PTGS, SDHC and CCL-2. Figure 1D shows differential expression of all these genes between CAFs, TCFs and NBFs. These results confirm the presence of differential gene expression between CAFs, TCFs and NBFs.
TCF cells secrete high levels of pro-carcinogenic cytokines
Next, we assessed the level of secreted pro-carcinogenic cytokines from CAFs, TCFs and NBFs. Therefore, CAF-114, TCF-114 and NBF-6 were cultured to 80% confluency and then complete medium (CpM) was replaced with serum-free medium (SFM). Serum-free conditioned medium (SFCM) was collected after 48 h of incubation and applied to the Ray Bio® human cytokine antibody array map. The array showed differential levels of various cytokines between TCF, CAF and NBF cells (Figure 2A). Upon quantification and normalization against the positive controls probed on the membrane, it was clear that CAFs secreted the highest levels of the majority of these cytokines (Figure 2B). Interestingly, the levels of SDF-1, CCL-25, TIMP-1 and TNF-alfa were also higher in TCF-114 cells than in NBF cells (Figure 2B). Similar results were obtained when comparing CAF-180, TCF-180 and NBF-1 (data not shown). This shows that TCFs, although present in histologically normal parts of the breast, secrete high levels of various pro-carcinogenic cytokines.
Figure 2.
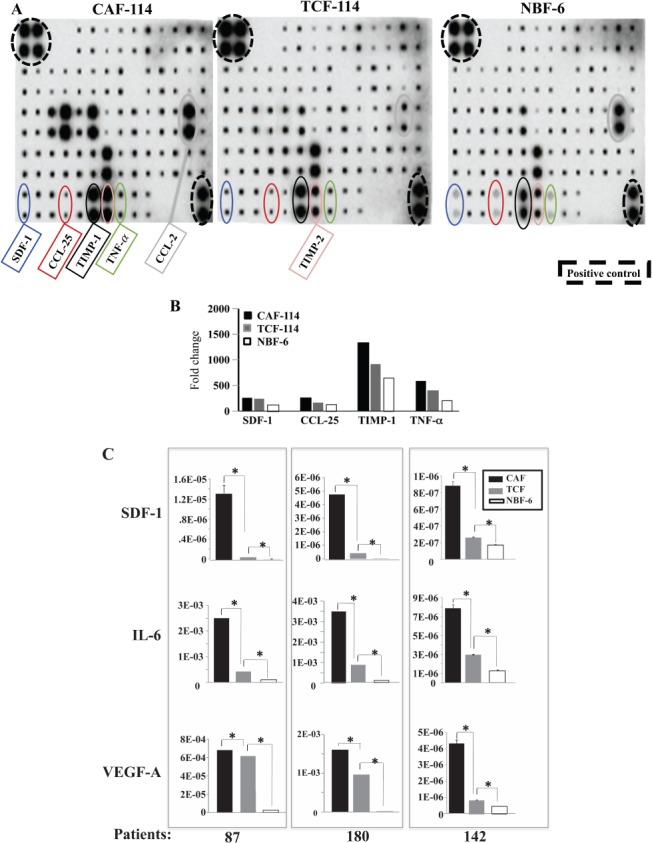
TCF cells secrete high levels of pro-carcinogenic cytokines. SFCMs from the indicated cells were collected and applied on the human cytokine antibody array map. (A) Cytokine array maps highlighting the differentially expressed cytokines. (B) Quantification of the array data for selected cytokines. (C) SFCMs were used to assess the levels of the indicated proteins by ELISA in CAF/TCF pairs from three patients compared to NBF-6 (mean ± SD; *p < 0.005)
TCFs secrete high levels of SDF-1, VEGF-A and IL-6
To further show the variation in cytokine secretion, SFCMs were collected from three different CAFs and their corresponding TCFs (87, 180 and 142) and NBF-6, and were used to assess the levels of SDF-1, IL-6 and VEGF-A by ELISA. Figure 2C shows that CAF cells secreted the highest levels of the three cytokines. Interestingly, the secreted levels of SDF-1, IL-6 and VEGF-A were also higher in all TCFs compared to NBF-6 (8.2-, 4.2- and 25-fold higher, respectively) (Figure 2C). Figure 2C also shows inter-patient variation in the secreted levels of these important pro-carcinogenic factors. These results confirm that TCF cells secrete higher levels of pro-carcinogenic factors relative to normal breast fibroblasts.
TCF cells from surgical margins exhibit features of active fibroblasts
To test whether fibroblasts from surgical margins display features of activation, we examined the levels of α-SMA and SDF-1 (two major markers of active breast fibroblasts 20–22) by immunoblotting. Interestingly, like CAF cells, TCFs also express higher levels of α-SMA and SDF-1 than NBF-6 and NBF-1 (Figure 3A). However, while the level of α-SMA was similar in TCFs and their corresponding CAFs, SDF-1 levels were slightly higher in CAF cells as compared to their respective TCFs (Figure 3A). Next, we studied the migratory and invasiveness abilities of TCF cells, using chambers either coated with Matrigel (invasion) or uncoated (migration). While CpM was added as a chemo-attractant to the lower wells of the chambers, cells (4 × 10⁵) were added to the upper wells in serum-free medium for 24 h. Figure 3B shows that while NBF-1 and NBF-6 cells were unable to migrate, TCF-87 and TCF-180 cells showed invasiveness and migratory abilities. However, the number of invading and migrating TCF cells was lower than that of their corresponding CAF cells (Figure 3B). This provides further evidence that TCF cells display active fibroblast features.
Figure 3.
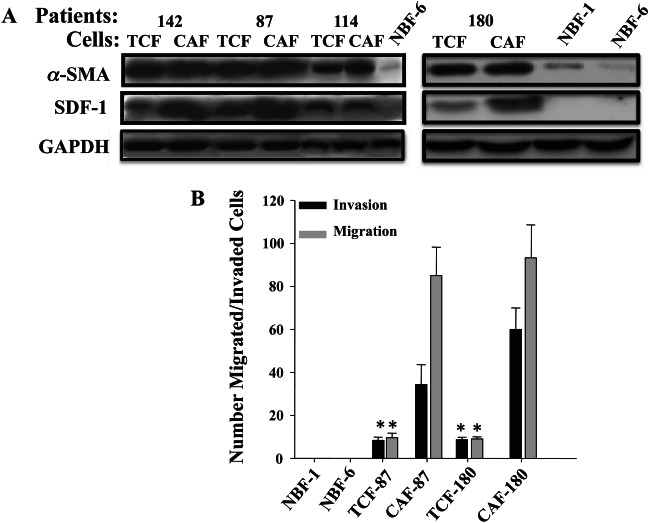
TCFs are active fibroblasts. (A) Immunoblotting for α-SMA and SDF-1 of the indicated cell lysates. (B) Invasion/migration assays. The numbers of invaded/migrated cells are presented in the histogram (mean ± SD; *p < 0.005 for TCFs compared to NBF-1 and NBF-6; note that CAFs are also significantly different)
Surgical margin fibroblasts enhance the proliferation of non-cancerous epithelial cells
To further show the active state of TCF cells, we studied their paracrine effect on the proliferation of epithelial cells. SFCMs collected from CAF/TCF-142, -180, -87 and −114 pairs and from NBF-6 and NBF-1 were used for culturing non-cancerous MCF10A epithelial cells. Proliferation of MCF10A cells was higher in the presence of media conditioned with CAF and TCF cells, compared to NBF cells. TCFs showed an intermediate effect between CAFs and NBFs (Figure 4). Indeed, after 24 h of incubation, SFCMs from TCF-87 and CAF-87 enhanced cell proliferation two- and four-fold, respectively, compared to SFCM from NBF cells (Figure 4). Similar results were obtained with CAF/TCF-180 and −142 pairs (Figure 4). For CAF/TCF-114, both enhanced the proliferation of MCF10A by four-fold at 24 h of incubation (Figure 4). This shows that, like CAFs, TCFs also enhance the proliferation of epithelial cells in a paracrine manner.
Figure 4.
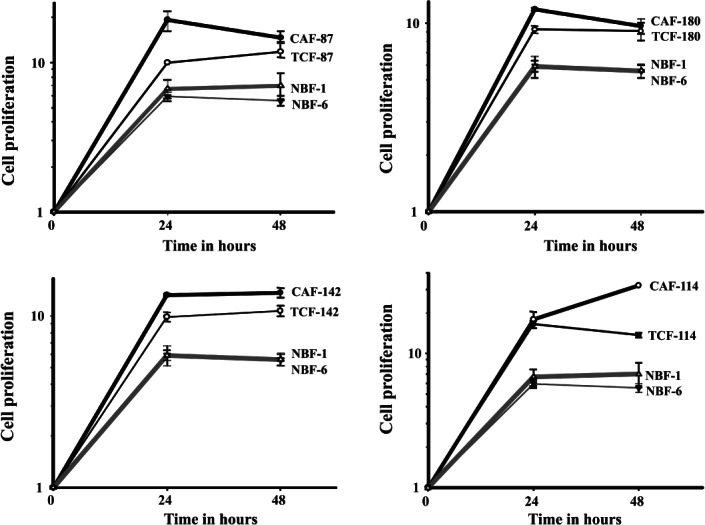
TCF-conditioned medium enhances the proliferation of mammary epithelial cells. MCF10A cells were cultured in SFCMs from the indicated fibroblasts from four patients and proliferation measured at the indicated times using the WST-1 assay, compared to SFCMs from the two NBF cultures performed at the same time. Error bars represent ± SD
TCFs promote migration/invasion and induce mesenchymal features of breast cancer cells
We next investigated the effect of TCF cells on the migration/invasion of breast cancer cells. SFCMs collected from TCF-180, CAF-180 and NBF-6 were added to MCF-7 cells (105) that had previously been seeded in the upper compartments of migration/invasion plates. Figure 5A shows that the number of migrated MCF-7 cells was much higher in the presence of media conditioned with CAF-180 and TCF-180 than with NBF-6 cells or SFM (used as negative control). Figure 5A shows that SFCMs from both CAF-180 and TCF-180 enhanced about 73-fold the migration ability of these breast cancer cells as compared to NBF-6.
Figure 5.
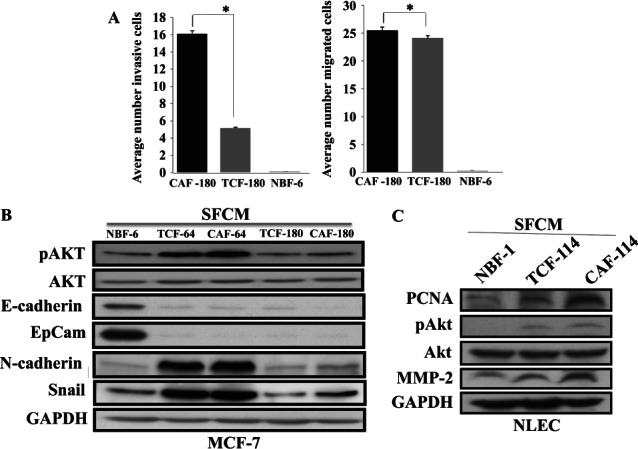
TCF cells enhance the migration/invasion of breast cancer cells and promote EMT. (A) SCFMs from the indicated cells were added into the lower compartments of 24-well BD BioCoat plates. MCF-7 cells (105) were seeded onto the upper compartment of the plates and incubated for 24 h. The numbers of invaded and migrated cells are presented (mean ± SD; *p < 0.005). (B, C) MCF-7 or normal luminal epithelial cells (NLEC) were treated with the indicated SFCMs for 24 h and cell lysates were used for immunoblotting with the indicated antibodies
Next, we sought to investigate the molecular mechanism/pathway that underlies TCF-dependent increase in the migration/invasion of breast cancer cells. Therefore, we explored the paracrine effect of TCF cells on the phosphorylation/activation of Akt, a known pro-invasive protein kinase 23. Epithelial MCF-7 cells were treated with SFM or SFCM from TCF-180 and CAF-180 for 24 h. Figure 5B shows that SFCMs from TCF and CAF cells increased the level of the phosphorylated/active form of Akt, with no effect on the level of total protein. Since active Akt and the increase in the invasiveness/migratory abilities of breast cancer cells accompany the transition of these epithelial cells to the mesenchymal phenotype, we assessed the level of N-cadherin and Snail and showed that SFCM from TCF cells increased the level of these two important markers of mesenchymal cells (Figure 5B). On the other hand, the levels of the epithelial markers E-cadherin and EpCam were markedly reduced (Figure 5B). These results indicate that, like CAFs, TCF cells have the ability to trigger the epithelial-to-mesenchymal transition process.
TCF cells activate Akt and up-regulate PCNA and MMP-2 in normal luminal cells in a paracrine manner
Since TCFs are present in histologically normal parts of the breast, we sought to investigate their effect on primary normal luminal epithelial cells (NLECs). Therefore, NLECs were incubated for 24 h with SFCMs from TCF, CAF and NBF, and cell lysates were used for immunoblotting. Figure 5C shows increase in the level of the proliferation marker PCNA in luminal cells pretreated with SFCMs from CAF and TCF cells, with a higher effect of CAF cells (Figure 5C). Similarly, the level of the phosphorylated/active form of Akt and also MMP-2 increased under the paracrine effect of TCF and CAF cells (Figure 5C). This shows that, like CAF cells, TCFs have the ability to promote tumourigenesis in normal luminal epithelial cells.
TCFs stimulate breast cancer growth in an orthotopic mouse model
To investigate the effect of fibroblasts on tumour growth in vivo, 15 nude mice were randomized into three groups and breast cancer tumours were created by co-implantation of MDA-MB-231 cells (5 × 10⁶) with NBF-6, TCF-180 or CAF-180 cells (2 × 10⁶) under the nipple of each mouse. All mice co-injected with MDA-MB-231 and CAF-180 cells developed tumours. On the other hand, while two of five mice co-injected with MDA-MB-231 and TCF-180 cells had tumours, only one mouse co-injected with MDA-MB-231 and NBF-6 cells developed a tumour (Figure 6A). Importantly, this tumour appeared 29 days post-injection, while tumours containing TCF and CAF cells appeared only 15 days after implantation (Figure 6B). Furthermore, at 40 days post-injection, while the size of the tumour containing NBF-6 cells reached a volume of 1.4 cm3, the tumours containing TCF and CAF cells reached 4 cm3 and 7 cm3 on average, respectively (Figure 6A, B). This shows that, like CAFs, TCFs have the ability to promote tumour formation and growth compared to normal fibroblasts.
Figure 6.
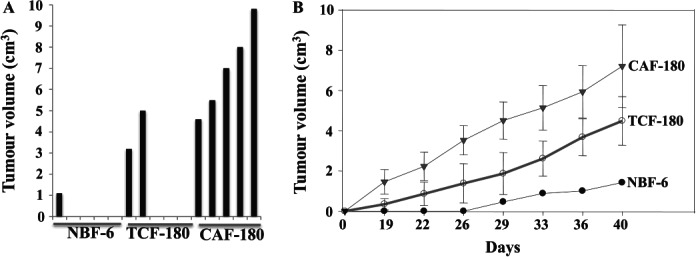
TCFs enhance the formation and the growth of human breast tumour orthotopic xenografts in mice. Breast cancer xenografts were created by co-injecting MDA-MB-231 cells with NBF-6, TCF-180 or CAF-180 cells under the nipples of nude mice. (A) Tumour size 40 days post-injection. (B) Time-dependent tumour growth (mean ± SD)
Discussion
We have shown here that breast stromal fibroblasts present in cancer-free surgical margins exhibit a specific gene expression pattern compared to cancer-associated fibroblasts and normal breast fibroblasts, with 77 genes differentially expressed between TCFs and NBFs and 42 genes differentially expressed between TCFs and their paired CAFs. Intriguingly, the expression pattern of 49 genes was specific for TCF cells, as compared to CAFs and NBFs (Figure 1C; see also Supplementary material, Table S1). This indicates that fibroblasts present in histologically normal tissues around tumours may also be affected by the presence of tumour cells. Notably, the genes that were found differentially expressed uniquely in TCFs were enriched with biological processes and functions related to, among others, inflammatory response, response to stimulus, immune cell trafficking, tissue development and cell signalling (see Supplementary material, Figure S1A, Table S2). To elucidate how these deregulated genes are interacting with genes in various metabolic pathways, the DEGs were mapped to gene networks using the ingenuity knowledge base. The network analysis revealed the potentially important role of CCL13, CTGF, CYP1B1, IGFBP7 and B4GALT1 (see Supplementary material, Figure S1B). Interestingly, genes deregulated in TCF cells interact, directly or indirectly, with the UBC gene (see Supplementary material, Figure S1C), which plays an essential role in maintaining ubiquitin levels, especially under stress conditions 24,25. Indeed, this polyubiquitin gene is up-regulated by cellular stresses and contains classical heat-shock elements in its promoter 26, suggesting that stress-related factors are involved in the TCF-specific gene expression profile and may relate to evidence that cancer cells use oxidative stress to activate adjacent fibroblasts 27. Comparing the variation in gene expression in each cell type showed variability within the three categories of cells. Interestingly, the gene expression profiles of TCF cells were more heterogeneous than those of CAF and NBF cells (Figure 1C), indicating higher patient-to-patient variability in stromal fibroblasts present in histologically normal tissues.
Differential gene expression between CAF and TCF cells from breast tumours has been reported previously 28–30. Bauer et al found 37 genes differentially expressed between six paired TCFs and CAFs and have also shown higher gene expression variability in TCF than in CAF cells 29. In another study, 420 genes were found to be differentially expressed between CAFs and normal breast fibroblasts from mammoplasties (NBFs) 30. Similarly, we have shown here that the expression of 101 genes varied between CAF and NBF cells. However, the current study presents the first micro-array comparative analysis between surgical margin fibroblasts, their corresponding CAFs and NBFs. In addition, we have shown that fibroblasts present in cancer-free surgical margins have higher migratory/invasiveness abilities than normal breast fibroblasts. Furthermore, these cells enhanced the proliferation rate of non-carcinogenic epithelial cells and the migration/invasion of breast cancer cells in vitro, as well as the formation/growth of breast tumour orthotopic xenografts in mice (Figures 5, 6). Interestingly, like CAFs, TCFs induced features of mesenchymal cells in breast cancer cells. Moreover, TCFs up-regulated PCNA and MMP2 and activated Akt in normal breast luminal fibroblasts in a paracrine manner. This indicates that these cells have the ability to promote cancer development and progression. This effect could be mediated through secretion of cytokines and/or energy transfer mechanisms (reverse Warburg effect) 21,22,31.
Notably, the magnitude of all these TCF-related effects was intermediate between those of CAFs and NBFs. This shows that, despite their localization in histologically normal breast tissues and not being in direct contact with cancer cells, TCFs acquired some myofibroblast features, suggesting that cancer cells can affect not only cancer-associated fibroblasts but also fibroblasts present in cancer-free adjacent tissues. This effect could be mediated through secreted molecules able to diffuse from cancer cells through normal tissue, reaching distant cells. TGFβ could play an important role in this effect. Indeed, TGFβ can induce the production of α-SMA in mammary fibroblasts in vitro and consequently transdifferentiates fibroblasts into myofibroblasts 32. It is also possible that cancer cells activate adjacent fibroblasts through the aerobic glycolysis process (Warburg effect), which produces pyruvate and lactate. Indeed, treatment with lactate transport inhibitor prevented the conversion of normal fibroblasts to myofibroblasts 31,33.
Our data indicate that remaining active fibroblasts following resection may enhance the chances of tumour recurrence, since these cells may constitute a fertile soil for tumour growth. To date, the most appropriate amount of normal breast tissue that should be removed to minimize local recurrence remains controversial 34. However, it is well known that local recurrence in patients submitted to conservative surgery is more common than in patients treated by mastectomy, showing the importance of surgical margins status for local relapse. Furthermore, several publications have reported the importance of the pathological margin status in determining the risk of local recurrence after breast conserving therapy 10. In conclusion, the present data show that breast stromal fibroblasts localized in cancer-free surgical margins are active and hence can potentiate the carcinogenesis process, and indicate that the tumour microenvironment may play determinant roles in local recurrence. Therefore, in the era of personalized therapy, the status of tumour stroma should also be taken into consideration for more efficient treatment and the prevention of recurrence as well as metastasis.
Acknowledgments
We are grateful to Dr P Hall for critical reading of the manuscript, and Dr B Karakas for his help with qRT-PCR. We would like also to thank the Research Centre administration for their continuous help. We are also thankful to Chatrina M Herradura and Katrina M Paculan for their great help with the animals. This work was performed under RAC Proposal No. 2080009.
Author contributions
MAA, S-FH and AAl performed experiments and analysed the data; FA performed experiments on the mice; DC and NK performed the micro-array data analysis; OA provided the tissues; AA supervised the work and analysed the data; and DC and AA wrote the paper. All the authors had final approval of the submitted manuscript.
Supporting Information
The following supplementary material may be found in the online version of this article
Supplementary materials and methods
Functional pathway and gene network analyses
TCF-specific differentially expressed genes
Biological function terms that are significantly associated with the genes differentially expressed uniquely in TCF cells
References
- Arendt LM, Rudnick JA, Keller PJ, et al. Stroma in breast development and disease. Semin Cell Dev Biol. 2009;21::11–18. doi: 10.1016/j.semcdb.2009.10.003. [DOI] [PMC free article] [PubMed] [Google Scholar]
- Polyak K, Kalluri R. The role of the microenvironment in mammarY gland development and cancer. Cold Spring Harb Perspect Biol. 2010 doi: 10.1101/cshperspect.a003244. 2010 doi: 10.1101/cshperspect.a003244. [DOI] [PMC free article] [PubMed] [Google Scholar]
- Aboussekhra A. Role of cancer-associated fibroblasts in breast cancer development and prognosis. Int J Dev Biol. 2011;55::841–849. doi: 10.1387/ijdb.113362aa. [DOI] [PubMed] [Google Scholar]
- Polanska UM, Orimo A. Carcinoma-associated fibroblasts: non-neoplastic tumour-promoting mesenchymal cells. J Cell Physiol. 2013;228::1651–1657. doi: 10.1002/jcp.24347. [DOI] [PubMed] [Google Scholar]
- Place AE, Jin Huh S, Polyak K. The microenvironment in breast cancer progression: biology and implications for treatment. Breast Cancer Res. 2011;13:227. doi: 10.1186/bcr2912. [DOI] [PMC free article] [PubMed] [Google Scholar]
- Allen M, Jones LJ. Jekyll and Hyde: the role of the microenvironment on the progression of cancer. J Pathol. 2011;223::162–176. doi: 10.1002/path.2803. [DOI] [PubMed] [Google Scholar]
- Xouri G, Christian S. Origin and function of tumour stroma fibroblasts. Semin Cell Dev Biol. 2010;21::40–46. doi: 10.1016/j.semcdb.2009.11.017. [DOI] [PubMed] [Google Scholar]
- Hawsawi NM, Ghebeh H, Hendrayani SF, et al. Breast carcinoma-associated fibroblasts and their counterparts display neoplastic-specific changes. Cancer Res. 2008;68::2717–2725. doi: 10.1158/0008-5472.CAN-08-0192. [DOI] [PubMed] [Google Scholar]
- Houssami N, Macaskill P, Marinovich ML, et al. Meta-analysis of the impact of surgical margins on local recurrence in women with early-stage invasive breast cancer treated with breast-conserving therapy. Eur J Cancer. 2010;46::3219–3232. doi: 10.1016/j.ejca.2010.07.043. [DOI] [PubMed] [Google Scholar]
- Luini A, Rososchansky J, Gatti G, et al. The surgical margin status after breast-conserving surgery: discussion of an open issue. Breast Cancer Res Treat. 2009;113::397–402. doi: 10.1007/s10549-008-9929-0. [DOI] [PubMed] [Google Scholar]
- Vaidya JS, Baum M, Tobias JS, et al. Targeted intraoperative radiotherapy (TARGIT) yields very low recurrence rates when given as a boost. Int J Radiat Oncol Biol Phys. 2006;66::1335–1338. doi: 10.1016/j.ijrobp.2006.07.1378. [DOI] [PubMed] [Google Scholar]
- Belletti B, Vaidya JS, D'Andrea S, et al. Targeted intraoperative radiotherapy impairs the stimulation of breast cancer cell proliferation and invasion caused by surgical wounding. Clin Cancer Res. 2008;14::1325–1332. doi: 10.1158/1078-0432.CCR-07-4453. [DOI] [PubMed] [Google Scholar]
- Evans A, Whelehan P, Thomson K, et al. Invasive breast cancer: relationship between shear-wave elastographic findings and histologic prognostic factors. Radiology. 2012;263::673–677. doi: 10.1148/radiol.12111317. [DOI] [PubMed] [Google Scholar]
- Al-Ansari MM, Hendrayani SF, Shehata AI, et al. p16(INK4A) represses the paracrine tumour-promoting effects of breast stromal fibroblasts. Oncogene. 2013;32::2356–2364. doi: 10.1038/onc.2012.270. [DOI] [PMC free article] [PubMed] [Google Scholar]
- Reiner A, Yekutieli D, Benjamini Y. Identifying differentially expressed genes using false discovery rate controlling procedures. Bioinformatics. 2003;19::368–375. doi: 10.1093/bioinformatics/btf877. [DOI] [PubMed] [Google Scholar]
- Livak KJ, Schmittgen TD. Analysis of relative gene expression data using real-time quantitative PCR and the 2–ΔΔCt method. Methods. 2001;25::402–408. doi: 10.1006/meth.2001.1262. [DOI] [PubMed] [Google Scholar]
- Al-Mohanna MA, Al-Khalaf HH, Al-Yousef N, et al. The p16INK4a tumour suppressor controls p21WAF1 induction in response to ultraviolet light. Nucleic Acids Res. 2007;35::223–233. doi: 10.1093/nar/gkl1075. [DOI] [PMC free article] [PubMed] [Google Scholar]
- Ivanova NB, Dimos JT, Schaniel C, et al. A stem cell molecular signature. Science. 2002;298::601–604. doi: 10.1126/science.1073823. [DOI] [PubMed] [Google Scholar]
- Dudoit S, Gentleman RC, Quackenbush J. Open source software for the analysis of microarray data. Biotechniques. :45–51. [PubMed] [Google Scholar]
- Kalluri R, Zeisberg M. Fibroblasts in cancer. Nat Rev Cancer 2006. 2003;6::392–401. doi: 10.1038/nrc1877. [DOI] [PubMed] [Google Scholar]
- Kojima Y, Acar A, Eaton EN, et al. Autocrine TGFβ and stromal cell-derived factor-1 (SDF-1) signaling drives the evolution of tumour-promoting mammary stromal myofibroblasts. Proc Natl Acad Sci USA. 2010;107::20009–20014. doi: 10.1073/pnas.1013805107. [DOI] [PMC free article] [PubMed] [Google Scholar]
- Orimo A, Gupta PB, Sgroi DC, et al. Stromal fibroblasts present in invasive human breast carcinomas promote tumour growth and angiogenesis through elevated SDF-1/CXCL12 secretion. Cell. 2005;121::335–348. doi: 10.1016/j.cell.2005.02.034. [DOI] [PubMed] [Google Scholar]
- Yoeli-Lerner M, Yiu GK, Rabinovitz I, et al. Akt blocks breast cancer cell motility and invasion through the transcription factor NFAT. Mol Cell. 2005;20::539–550. doi: 10.1016/j.molcel.2005.10.033. [DOI] [PubMed] [Google Scholar]
- Wiborg O, Pedersen MS, Wind A, et al. The human ubiquitin multigene family: some genes contain multiple directly repeated ubiquitin coding sequences. EMBO J. 1985;4::755–759. doi: 10.1002/j.1460-2075.1985.tb03693.x. [DOI] [PMC free article] [PubMed] [Google Scholar]
- Ryu KY, Maehr R, Gilchrist CA, et al. The mouse polyubiquitin gene UbC is essential for fetal liver development, cell-cycle progression and stress tolerance. EMBO J. 2007;26::2693–2706. doi: 10.1038/sj.emboj.7601722. [DOI] [PMC free article] [PubMed] [Google Scholar]
- Fornace AJ, Jr, Alamo I, Jr, Hollander MC, et al. Ubiquitin mRNA is a major stress-induced transcript in mammalian cells. Nucleic Acids Res. 1989;17::1215–1230. doi: 10.1093/nar/17.3.1215. [DOI] [PMC free article] [PubMed] [Google Scholar]
- Lisanti MP, Martinez-Outschoorn UE, Chiavarina B, et al. Understanding the 'lethal' drivers of tumour-stroma co-evolution: emerging role(s) for hypoxia, oxidative stress and autophagy/mitophagy in the tumour micro-environment. Cancer Biol Ther. 2010;10::537–542. doi: 10.4161/cbt.10.6.13370. [DOI] [PMC free article] [PubMed] [Google Scholar]
- Singer CF, Gschwantler-Kaulich D, Fink-Retter A, et al. Differential gene expression profile in breast cancer-derived stromal fibroblasts. Breast Cancer Res Treat. 2008;110::273–281. doi: 10.1007/s10549-007-9725-2. [DOI] [PubMed] [Google Scholar]
- Bauer M, Su G, Casper C, et al. Heterogeneity of gene expression in stromal fibroblasts of human breast carcinomas and normal breast. Oncogene. 2010;29::1732–1740. doi: 10.1038/onc.2009.463. [DOI] [PMC free article] [PubMed] [Google Scholar]
- Sadlonova A, Bowe DB, Novak Z, et al. Identification of molecular distinctions between normal breast-associated fibroblasts and breast cancer-associated fibroblasts. Cancer Microenviron. 2009;2::9–21. doi: 10.1007/s12307-008-0017-0. [DOI] [PMC free article] [PubMed] [Google Scholar]
- Pavlides S, Whitaker-Menezes D, Castello-Cros R, et al. The reverse Warburg effect: aerobic glycolysis in cancer associated fibroblasts and the tumour stroma. Cell Cycle. 2009;8::3984–4001. doi: 10.4161/cc.8.23.10238. [DOI] [PubMed] [Google Scholar]
- Vaughan MB, Howard EW, Tomasek JJ. Transforming growth factor-β1 promotes the morphological and functional differentiation of the myofibroblast. Exp Cell Res. 2000;257::180–189. doi: 10.1006/excr.2000.4869. [DOI] [PubMed] [Google Scholar]
- Sotgia F, Martinez-Outschoorn UE, Pavlides S, et al. Understanding the Warburg effect and the prognostic value of stromal caveolin-1 as a marker of a lethal tumour microenvironment. Breast Cancer Res. 2011;13::213. doi: 10.1186/bcr2892. [DOI] [PMC free article] [PubMed] [Google Scholar]
- Morrow M, Harris JR, Schnitt SJ. Surgical margins in lumpectomy for breast cancer—bigger is not better. N Engl J Med. 2012;367::79–82. doi: 10.1056/NEJMsb1202521. [DOI] [PubMed] [Google Scholar]
Associated Data
This section collects any data citations, data availability statements, or supplementary materials included in this article.
Supplementary Materials
Supplementary materials and methods
Functional pathway and gene network analyses
TCF-specific differentially expressed genes
Biological function terms that are significantly associated with the genes differentially expressed uniquely in TCF cells


