

Abstract
The 6-deoxyerythronolide B synthase (DEBS) is a prototypical assembly line polyketide synthase (PKS) produced by the actinomycete Saccharopolyspora erythraea that synthesizes the macrocyclic core of the antibiotic erythromycin, 6-deoxyerythronolide B (6-dEB). The megasynthase is a 2 MDa trimeric complex comprised of three unique homodimers assembled from the gene products DEBS1, DEBS2, and DEBS3, which are housed within the erythromycin biosynthetic gene cluster. Each homodimer contains two clusters of catalytically independent enzymatic domains, each referred to as a module, which catalyzes one round of polyketide chain extension and modification. Modules are named sequentially to indicate the order in which they are utilized during synthesis of 6-dEB. We report small angle X-ray scattering (SAXS) analyses of a whole module and bimodule from DEBS as well as a set of domains for which high-resolution structures are available. In all cases, the solution state was probed under previously established conditions that ensure each protein is catalytically active. SAXS data are consistent with atomic-resolution structures of DEBS fragments. Therefore, we used the available high-resolution structures of DEBS domains to model the architectures of the larger protein assemblies using rigid body refinement. Our data supports a model in which, the third module of DEBS forms a disc-shaped structure capable of caging the acyl carrier protein domain proximal to each active site. The molecular envelope of DEBS3 is a thin, elongated ellipsoid, and the results of rigid body modeling suggest that modules 5 and 6 stack colinearly along the 2-fold axis of symmetry.
Introduction
Multimodular polyketide synthases (PKSs) catalyze the biosynthesis of numerous complex polyketide natural products in an assembly line fashion (1-4). A prototypical example is the 6-deoxyerythronolide B synthase (DEBS) (Figure 1A), a ∼2 MDa protein complex comprised of catalytically independent clusters of active sites, termed modules. This enzymatic assembly line incrementally incorporates methylmalonyl-CoA derived extender units into a growing polyketide chain (Figure 1A). Each module of DEBS is programmed to unequivocally establish the functionality and stereochemistry at the α-and β-carbon atoms of the growing polyketide chain before it is translocated to the next module (Figure 1B). To do so, every chain-extending module includes a ketosynthase (KS), an acyl transferase (AT), and an acyl carrier protein (ACP) domain, in addition to optional enzymes that modify the growing chain such as a ketoreductase (KR), a dehydratase (DH), and/or an enoyl reductase (ER) domain. Polyketide biosynthesis is initiated by the loading didomain (LD), whereas the 6-deoxyerythronolide B product is released by the thioesterase (TE) domain (Figure 1B).
Figure 1. Biosynthesis of 6-deoxyerythronolide B (6dEB) on the DEBS assembly line.
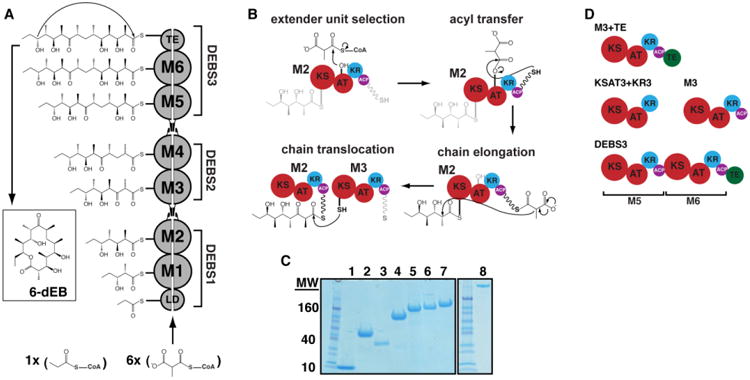
(A) DEBS is comprised of six extension modules (M1-6), a loading didomain (LD), and a terminal thioesterase domain (TE). These enzymes are dispersed among three homodimeric polypeptides (DEBS1-3). Successive polypeptides in the assembly line associate through specific docking domain interactions localized near the N- and C-termini. The LD initiates polyketide synthesis with a propionyl-CoA derived primer that is incrementally elaborated as it traverses M1-M6. The TE releases 6dEB via concomitant cyclization. (B) The chain elongation modules are comprised of homologous domains. Acyl transferase (AT) domains transfer methylmalonyl extender units to their acyl carrier protein (ACP) partner domains. The ACP then associates with the ketosynthase (KS) domain from the same module to enable elongation of the polyketide chain. Following elongation, the ACP-bound chain can be modified by auxiliary domains such as the ketoreductase (KR), dehydratase (DH; not shown), and the enoyl reductase (ER; not shown). The fully processed polyketide intermediate is eventually translocated from this ACP to the KS domain of the downstream module. (C) SDS-PAGE analysis of purified proteins prior to SEC and SAXS. Protein samples are as follows: 1) holo-ACP3, 2) KR1, 3) TE, 4) KSAT3, 5) KSAT3+KR3, 6) M3, 7) M3+TE, and 8) DEBS3. (D) Schematic representation of the constructs analyzed in this study using SAXS. All but one construct in the series is derived from M3. By fusing the TE domain onto M3, the M3+TE homodimer is capable of catalyzing multiple turnover in vitro (18). The bimodular construct DEBS3 is as shown in (A). Domain coloring is consistent where possible throughout the manuscript.
Since the discovery of the modular nature of PKS assembly lines (5; 6), considerable research has focused on engineering PKS chimeras by swapping domains in and out of modules as well as mixing and matching phylogenetically distinct modules to produce new compounds (7-11). While this strategy is sometimes effective, the engineered systems are invariably inefficient, underscoring the importance of pursuing a deeper understanding of the relationship between PKS structure and function. Therefore, the goal of our present study was to probe the architecture of DEBS using small angle X-ray scattering (SAXS), as this technique is capable of resolving the relative orientations of structurally defined domains within large, flexible protein complexes that resist crystallization (12-14).
Each module of DEBS forms a homodimer (15). The homodimeric assemblies are either covalently connected (as in the cases of modules 1 and 2, modules 3 and 4, or modules 5 and 6; Figure 1A), or they interact with each other through short docking domains at the N- and C-termini (as in the cases of modules 2 and 3, or modules 4 and 5; Figure 1A)(16-18). Limited proteolysis experiments in conjunction with analytical ultracentrifugation and size exclusion chromatography (SEC) suggest that within a bimodular construct, such as DEBS3, there is flexibility between modules (15; 19) as well as between domains within modules (20). Therefore, we reasoned that each module of DEBs could be treated as a collection of rigid bodies connected by flexible linkers. Supporting evidence was derived from the observation that the atomic-resolution structure of at least one representative of each conformationally rigid fragment of DEBS has been solved, including the core KS-AT didomain from modules 3 (KSAT3) and 5 (KSAT5) (21; 22), the ACP domain from module 2 (ACP2) (23), the KR domain from module 1 (KR1) (24), the DH domain from module 4 (DH4) (25), the docking domain pair between modules 4 and 5 (26), and the terminal thioesterase (TE) domain (27). In contrast, the relative orientation of domains within a PKS module as well as the relative orientations of consecutive modules in a functional assembly remains unclear.
Significant insight into the architecture of a DEBS module can be derived from the 3.2 Å crystal structure of the homologous mammalian fatty acid synthase (mFAS) (28) that assembles CoA derived acetyl and malonyl units into 16 or 18 carbon chains using an iterative mechanism. The observed mFAS structure reveals a flat X-shaped homodimeric protein (29; 30) (180 × 130 × 75 Å). Its KS-AT didomain comprises one half of the X, whereas the KR, DH, and ER domains are located in the other half (Figure S1). The ACP and TE domains are presumed to be located between the two halves. The architecture of the structurally rigid KS-AT didomain of the mFAS is very similar to that of KSAT3 and KSAT5 from DEBS (21; 22; 28; 31). Moreover, the KR, DH, and ER domains of PKS modules are also thought to be arranged in an analogous manner along the 2-fold axis of symmetry (1; 25; 32), although notable differences appear to exist (33; 34). For example, the recently reported structure of the ER and KR domain from module 2 of the spinosyn PKS suggests that monomeric ER domains in PKS modules are intimately associated with their corresponding KR domains, and flank the DH dimer (33). Moreover, the structure of KR domain from module 6 of the spinosyn PKS suggests that some modules lacking DH and ER domains position the KR monomers centrally above the KS dimer parallel to its 2-fold symmetry axis; this orientation appears to be facilitated by short 3-helix bundles termed dimerization elements (34). However, not all PKS modules lacking DH and ER domains contain dimerization elements, as exemplified by modules from DEBS (34). The KR positions in these modules remain unclear. Lastly, the TE domains from mFAS are monomeric while those of assembly line PKSs are dimeric (27; 35). Presumably, these architectural differences between mFAS and assembly line PKS modules have evolved to facilitate intermodular communication during chain translocation, a catalytic step that does not occur in iterative enzyme assemblies such as mFAS.
Our strategy for addressing PKS architecture has involved small angle X-ray scattering (SAXS) of a systematically designed set of domains, partial modules, a full module, and a bimodule from DEBS. We have shown that the available high-resolution structures of each domain from DEBS are consistent with their solution states, and have leveraged this information toward modeling the architecture of a full module and bimodule using rigid body refinement. Our scattering data is consistent with a model in which the third module from DEBS (M3) forms a disc-shaped structure, capable of caging the ACP domain at the center of a ring formed by the KS-AT didomain, the KR domains, and the TE dimer. Placement of the KR domains has been achieved by comparing rigid body modeling results from a set of systematically designed M3 variants. We also present evidence that module 5 (M5) and module 6 (M6) from DEBS3 stack collinearly and may be twisted up to 70° with respect to one another along the 2-fold axis of symmetry.
Results
For several reasons, we chose DEBS M3 and DEBS3 (comprised of M5, M6, and the TE domain) as the primary protein targets of this study. From a practical standpoint, these proteins and their derivatives (Figure 1C-D) are readily expressed and purified from E. coli, and remain soluble at high concentrations (>20 mg/mL). The largest fragments of M3 and M5, the KSAT3 and KSAT5 didomains, have been crystallographically characterized at atomic resolution, as well as the wild-type TE domain. ACP2 and KR1 are sufficiently homologous to the respective domains within M3 and DEBS3 to warrant rigid body modeling with the available structures (Figure S2). Lastly, a number of studies have interrogated the protein chemistry, mechanism, and substrate specificity of M3 and DEBS3 and their derivatives (15-18; 20; 36-43).
Atomic structures of DEBS fragments are consistent with their solution states
We investigated whether individual DEBS domains can be treated as rigid bodies by comparing the theoretical scattering patterns of holo-ACP2 (holo-ACPs have the phosphopantetheine arm installed in contrast to apo-ACPs), KR1, KSAT3, and the TE domain with the experimentally determined scattering patterns for each protein. Size exclusion chromatography (SEC) was performed in tandem with SAXS data collection in order to eliminate any aggregated protein from each sample (Figure S3). Scattering data was collected at 5 s intervals from the column eluate and inspected for heterogeneity using Kratky analysis, a method commonly employed for detecting conformational changes due to ligand binding events (44; 45), multimerization (46-48), and flexibility (49). Every five consecutive datasets were averaged and transformed into Kratky plots. The resulting curves for holo-ACP3, KR1, and the TE domain had nearly identical curvature when overlaid (Figure S4), indicating the data collected throughout each chromatographic separation was independent of protein concentration. Thus, our preparations of holo-ACP3, KR1, and TE could be considered monodisperse samples (12; 13; 49).
The Rg, Porod volume, and Dmax of KR1 and TE were in excellent agreement with values predicted from their crystal structures (Table 1). In each case the Porod exponent was between 3 and 4, indicative of scattering by three-dimensional particles with rough surfaces consistent with well-folded proteins (49-51). The Rg, Dmax, and Porod volume of holo-ACP3 were slightly higher than the values predicted from the NMR-derived structure of apo-ACP2, suggesting that attachment of the phosphopantetheine arm increased the scattering volume in a manner akin to posttranslational modification of glycosylated proteins (52). Although the Kratky plot for holo-ACP3 approached baseline at the higher scattering angles, it did not completely converge back to baseline, providing further evidence that the attached phosphopantetheine arm is flexible (Figure S5). In contrast, the Kratky plots for KR1 and the TE domain suggested that both proteins were highly structured and did not sample a wide range of conformational states under the probed conditions. In all cases, the Porod-Debye plots exhibited a plateau in the mid-q range, consistent with well-folded, breathing proteins (53) (Figure S5). Finally, Guinier plots were linear in the low-q regions (q < 1.3*Rg), providing further evidence that protein aggregates were removed during SEC.
Table 1.
Data collection and scattering derived parameters for holo-ACP3, KR1, TE, and KSAT3. Abbreviations: Rg: radius of gyration; Mr: molecular weight; Dmax: maximum particle dimension; Vp: partial specific volume estimated from average protein density of 1.35 g cm-3; Vex: particle excluded volume calculated in DAMMIF/N. The apparent Porod density reported in the “Molecular Mass Determination” section was calculated by dividing the molecular weight estimated from the protein sequence by the experimentally derived Porod volume.
| holo-ACP3 | KR1 | TE | KSAT3 | |
|---|---|---|---|---|
|
| ||||
| Data-collection parameters | ||||
| Instrument | SSRL BL4-2 | SSRL BL4-2 | SSRL BL4-2 | SSRL BL4-2 |
| Defining slits size (H mm × V mm) | 0.3 × 0.3 | 0.3 × 0.3 | 0.3 × 0.3 | 0.3 × 0.3 |
| Detector distance (m) | 1.7 | 1.7 | 1.7 | 2.5 |
| Wavelength (Å); energy (keV) | 1.127; 11 | 1.127; 11 | 1.127; 11 | 1.127; 11 |
| q range (Å-1) | 0-0.53 | 0-0.53 | 0-0.53 | 0-0.53 |
| Exposure time per frame (sec) | 1 | 1 | 1 | 1 |
| Frames per FPLC experiment | 700 | 700 | 700 | 700 |
| Amount loaded (nmol) | N.D. | 315 | 250 | 250 |
| Temperature (K) | 293 | 293 | 293 | 293 |
| SEC column | Superdex 200 PC 3.2/30 | Superdex 200 PC 3.2/30 | Superdex 200 PC 3.2/30 | Superdex 200 PC 3.2/30 |
| FPLC flow-rate (mL/min) | 0.05 | 0.05 | 0.05 | 0.05 |
|
| ||||
| Structural parameters | ||||
| I(0) (cm-1) from Guinier | 1387 | 10400 | 6326 | 4099 |
| Rg (Å) from Guinier | 17.7 ± 0.6 | 24.7 ± 0.5 | 30.4 ± 0.2 | 49 ± 1 |
| I(0) (cm-1) from P(r) | 1390 | 10300 | 6290 | 4099 |
| Rg (Å) from P(r) | 18.4 ± 0.5 | 24.8 ± 0.3 | 31.7 ± 0.4 | 51 ± 2 |
| Dmax (Å) from P(r) | 72 ± 7 | 78 ± 3 | 114 ± 4 | 175 ± 5 |
| Rg (Å) of NMR or crystal structure | 14.44 | 22.51 | 29.87 | 48.15 |
| Dmax (Å) of NMR or crystal structure | 54.91 | 77.86 | 102.5 | 183.3 |
| Cross-sectional Rg (Å) from ScÅtter | 9.71 ± 0.08 | 15.76 ± 0.07 | 14.28 ± 0.05 | 15.7 ± 0.1 |
| Porod exponent from ScÅtter | 3.50 ± 0.1 | 3.50 ± 0.01 | 3.60 ± 0.01 | 3.4 ± 0.1 |
| Porod volume estimate (Å3) from Primus/qt | 14500 ± 600 | 90000 ± 3000 | 90000 ± 1000 | 300000 ±10000 |
| Excluded volume estimate (Å3) from DAMMIF | 14700 ± 300 | 89400 ± 200 | 99000 ± 1000 | 359000 ± 6000 |
| Dry monomeric volume calculated from sequence (Å3) | 13938 | 66457 | 38200 | 120240 |
|
| ||||
| Molecular mass determination | ||||
| Apparent Porod density (g cm-3) | 1.32 ± 0.06 | 1.01 ± 0.06 | 1.16 ± 0.02 | 1.12 ± 0.05 |
| Molecular mass Mr (kDa) from Porod volume (VP = 0.74 cm3 g-1) | 10.8 ± 0.5 | 67 ± 2 | 67 ± 1 | 220 ± 10 |
| Mr (kDa) from excluded volume (Vex/2) | 7.4 ± 1 | 44.72 ± 0.09 | 49.7 ± 6 | 179 ± 3 |
| Mr (kDa) monomer/dimer from SEC | N.D. | 57 (ref 24) | N.A./61.7 | 134.0/207.4 |
| Calculated monomeric Mr (kDa) from sequence | 11.52 | 54.9 | 31.6 | 99.4 |
|
| ||||
| Software employed | ||||
| Primary data reduction | SasTool | SasTool | SasTool | SasTool |
| Data processing | PRIMUS | PRIMUS | PRIMUS | PRIMUS |
| Ab initio analysis | DAMMIF | DAMMIF | DAMMIF | DAMMIF |
| Validation and averaging | DAMAVER | DAMAVER | DAMAVER | DAMAVER |
| Rigid-body modeling | CORAL | CORAL | CORAL | CORAL |
| Computation of model intensities | CRYSOL | CRYSOL | CRYSOL | CRYSOL |
| Three-dimensional representations | Chimera | Chimera | Chimera | Chimera |
Experimental scattering curves for holo-ACP3, KR1, and the TE dimer were consistent with the theoretical scattering patterns calculated from each corresponding atomic-resolution structure (Figure S6). The fit between experimental and theoretical data was further improved when each protein was modeled to include N- and/or C-terminal appendages (e.g., polyhistidine tags), absent from high-resolution structures (Figure 2A). The molecular envelopes calculated using the ab initio bead modeling program DAMMIF(54) corresponded well to their atomic-resolution structures (Figure 2B). In the absence of symmetry constraints, 20 independent DAMMIF calculations were performed, and the results were averaged by DAMAVER (55) to obtain estimates of the particle volume and MW (Table 1). Consistent with atomic-resolution models, ab initio modeling predicted that holo-ACP3 and KR1 were monomeric, and the TE domain was dimeric. Therefore, when running DAMMIF, P1 symmetry was applied for modeling holo-ACP3 and KR1, and P2 symmetry was applied to model the TE domain. Our predictions are supported by SEC-derived MWs reported herein and elsewhere (15; 24; 56) (Table 1; Figure S7). Moreover, the intra-particle distance distribution function, P(r), of holo-ACP3 and KR1 were bell-shaped, indicative of a globular fold, whereas the predicted P(r) of the TE had a slightly extended tail, consistent with an ellipsoidal shape (12) (Figure S5).
Figure 2. High-resolution structures of DEBS domains are consistent with their solution-state structures.
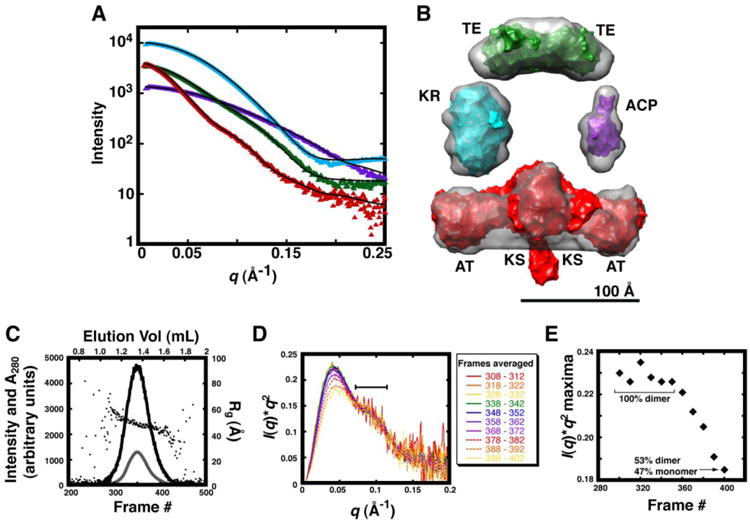
(A). Experimental data collected for holo-ACP3, KR1, TE, and KSAT3 are plotted as purple, cyan, green, and red triangles, respectively. Each atomic resolution structure was treated as a rigid body, and terminal regions such as the polyhistidine tag were modeled with CORAL. For this, the NMR structure of apo-ACP2 is compared with holo-ACP3 and the crystal structures of KR1, the TE domain, and KSAT3 are compared with scattering data collected for KR1, the TE domain, and KSAT3, respectively. Theoretical scattering curves for the resulting models were fit to experimental data in CRYSOL, and the resulting curves are shown as black lines with χholo-ACP3 = 6.56, χKR1 = 3.35, χTE = 5.59, and χKSAT3 = 1.91. Chi2-free values were also tabulated as indicated in Table S4. (B) The surface of each atomic-resolution structure is colored as in (A) and fit into the average molecular envelopes (grey) calculated in DAMMIF. (C) SAXS datasets were collected every 5 sec along the SEC elution profile of KSAT3. The A280 (grey line) peak and SAXS I(0) (black line) were aligned following data collection, and plotted along with corresponding Rg values (black circles). I(0) and Rg were calculated using Guinier analysis. (D) Every five consecutive scattering curves were averaged, transformed into Kratky plots, and scaled along the q-region highlighted with a bar (70-115 Å-1). (E) The peak position in each Kratky curve from (D) is plotted according to the frame number of each exposure along the SEC elution profile; the resulting plot shows a partial two-state transition. The fraction of monomeric and dimeric species was estimated using OLIGOMER with the KSAT3 crystal structure modeled to include the N-terminal docking domain. Datasets from the plateau in the left-hand portion of the plot (314-326) were averaged, and used in subsequent analysis. The averaged scattering curve used for structural modeling is shown in Figure S8.
In contrast to holo-ACP3, KR1, and the TE dimer, the KSAT3 didomain existed as a mixture of monomers and dimers, as evident from preparative scale SEC (Figure S7), notwithstanding the fact that the protein was purified to apparent homogeneity (Figure 1C) and high specific activity (data not shown). Therefore, it was necessary to ensure that dimeric KSAT3 particles were sufficiently resolved from monomeric species during the SEC step preceding SAXS data collection before selecting and processing the appropriate SAXS datasets. In a manner identical to that described for holo-ACP3, KR1, and the TE domain, we used Kratky analysis to detect which portions of the elution profile corresponded to dimers, monomers, or a mixed population (Figure 2C-E). In this case, the shape of the Kratky plots changed systematically with the time of elution from the SEC column, suggestive of oligomeric or conformational state changes during the chromatographic step. The peak position in the Kratky plot was correlated to the elution volume of the corresponding fraction through a classic two-state transition (Figure 2E), allowing estimation of the volume fractions of dimer versus monomer along the elution profile using the program OLIGOMER (57). The fraction of monomer and dimer in each sample was estimated by first calculating the theoretical scattering data for the dimeric and monomeric states of KSAT3 based on the crystallographically determined structure of the homodimer. This information was then combined by solving a set of linear equations to determine the volume fraction of each component in the mixture. Datasets from the plateau region (left-hand portion of the elution profile) were found to contain 100% dimeric species, and were therefore selected for further analysis.
The Rg, Dmax, and Porod volume calculated from the left-hand portion of the KSAT3 elution profile were reflective of dimeric species, and the Porod exponent suggested that the scattering particles had rough surfaces (Table 1). The Kratky plot converged to baseline values in the high-q region, and the Porod-Debye plot contained a plateau in the mid-q region, suggesting the KSAT3 didomain did not sample a wide range of conformational states during this experiment (Figure S8). The theoretical scattering curve based on the solved KSAT3 crystal structure fit the experimental data with χ = 3.07. The fit improved to χ = 2.08 when the N-terminal coiled-coil region was included in the reference model, a feature of our protein sample that is absent from the crystal structure. Similarly, the shape of the molecular envelope, derived from ab initio modeling with P2 symmetry, was reflective of the KSAT3 crystal structure (Figure 2B). Its ellipsoid shape was further supported by the corresponding paired-distribution function, which showed a modestly elongated tail (Figure S8).
Three-dimensional architecture of a DEBS modulele
Encouraged by our findings that the SAXS-derived, solution-state conformations of representative fragments of DEBS accurately reflected their high-resolution structures, we proceeded to analyze a derivative of DEBS M3 that catalyzes triketide lactone formation in its 330 kDa homodimeric state (M3+TE; Figure 1D) (18). This construct comprises the third module from DEBS with the TE domain connected to ACP3 through the 10 residue linker that naturally occurs between ACP6 and the TE domain in DEBS3. We sought to understand the global architecture of M3+TE because it can catalyze triketide lactone formation under multiple turnover conditions, and this capability has allowed substrate specificity and the PKS catalytic mechanism to be studied in detail on a minimal PKS construct. Preparative scale SEC revealed a single peak of the expected molecular mass (Table 2; Figure S7). Similarly, Kratky plots of SAXS data collected along the elution profile of the SEC column overlay with nearly identical shapes (Figure S9A), indicating that the dimeric protein did not dissociate into monomers during chromatography. The Porod volume calculated from the averaged scattering data was also reflective of dimeric particles (Table 2).
Table 2.
Data collection and scattering derived parameters for KSAT3+KR3, M3, M3+TE, and DEBS3.
| KSAT3+KR3 | M3 | M3+TE | DEBS3 | |
|---|---|---|---|---|
|
| ||||
| Data-collection parameters | ||||
| Instrument | SSRL BL4-2 | SSRL BL4-2 | SSRL BL4-2 | SSRL BL4-2 |
| Defining slits size (H mm × V mm) | 0.3 × 0.3 | 0.3 × 0.3 | 0.3 × 0.3 | 0.3 × 0.3 |
| Detector distance (m) | 2.5 | 2.5 | 2.5 | 2.5 |
| Wavelength (Å); energy (keV) | 1.127; 11 | 1.127; 11 | 1.127; 11 | 1.127; 11 |
| q range (Å-1) | 0-0.53 | 0-0.53 | 0-0.53 | 0-0.53 |
| Exposure time per frame (sec) | 1 | 1 | 1 | 1 |
| Frames per FPLC experiment | 700 | 700 | 700 | 700 |
| Amount loaded (nmol) | 125 | 85 | 60 | 20 |
| Temperature (K) | 293 | 293 | 293 | 293 |
| SEC column | Superdex 200 PC 3.2/30 | Superdex 200 PC 3.2/30 | Superdex 200 PC 3.2/30 | Superose6 PC 3.2/30 |
| FPLC flow-rate (mL/min) | 0.05 | 0.05 | 0.05 | 0.05 |
|
| ||||
| Structural parameters | ||||
| I(0) (cm-1) from Guinier | 4890 | 1656 | 11710 | 9413 |
| Rg (Å) from Guinier | 56 ± 1 | 57.0 ± 1.0 | 61.3 ± 0.5 | 83 ± 2 |
| I(0) (cm-1) from P(r) | 4924 | 1655 | 11700 | 9322 |
| Rg (Å) from P(r) | 55.8 ± 0.3 | 56.4 ± 0.7 | 61.4 ± 0.6 | 81.8 ± 0.6 |
| Dmax (Å) from P(r) | 175 ± 7 | 190 ± 10 | 190 ± 8 | 290 ± 20 |
| Rg (Å) of NMR or crystal structure | N/A | N/A | N/A | N/A |
| Dmax (Å) of NMR or crystal structure | N/A | N/A | N/A | N/A |
| Cross-sectional Rg (Å) from ScÅtter | 12.12 ± 0.17 | 17.9 ± 0.2 | 12.2 ± 0.2 | 12.0 ± 0.1 |
| Porod exponent from ScÅtter | 3.2 ± 0.1 | 3.3 ± 0.1 | 3.6 ± 0.1 | 3.5 ± 0.1 |
| Porod volume estimate (Å3) from | 460000 ± | 490000 ± 4000 | 610000 ± | 1110000 ± |
| Primus/qt | 50000 | 20000 | 50000 | |
| Excluded volume estimate (Å3) from DAMMIF | 533000 ± 7000 | 541000 ± 3000 | 660000 ± 10000 | 1160000 ± 30000 |
| Dry monomeric volume calculated from sequence (Å3) | 177920 | 188322 | 218806 | 404228 |
|
| ||||
| Molecular mass determination | ||||
| Apparent Porod density (g cm-3) | 1.08 ± 0.08 | 1.05 ± 0.01 | 1.01 ± 0.03 | 1.00 ± 0.04 |
| Molecular mass Mr (kDa) from Porod volume (VP = 0.74 cm3 g-1) | 335 ± 20 | 363 ± 3 | 450 ± 10 | 800 ± 40 |
| Mr (kDa) from excluded volume (Vex/2) | 267 ± 4 | 270 ± 2 | 331 ± 5 | 580 ± 10 |
| Mr (kDa) monomer/dimer from SEC | 186.0/255.3 | 197.7/268.4 | N/A/286.4 | 650 ± 10 (refs 15 & 67) |
| Calculated monomeric Mr (kDa) from sequence | 147.0 | 155.6 | 185.7 | 334.1 |
|
| ||||
| Software employed | ||||
| Primary data reduction | SasTool | SasTool | SasTool | SasTool |
| Data processing | PRIMUS | PRIMUS | PRIMUS | PRIMUS |
| Ab initio analysis | DAMMIF | DAMMIF | DAMMIF | DAMMIN |
| Validation and averaging | DAMAVER | DAMAVER | DAMAVER | DAMAVER |
| Rigid-body modeling | CORAL | CORAL | CORAL | CORAL |
| Computation of model intensities | CRYSOL | CRYSOL | CRYSOL | CRYSOL |
| Three-dimensional representations | Chimera | Chimera | Chimera | Chimera |
In order to choose an appropriate and parsimonious method for modeling the three-dimensional shape of M3+TE, we assessed its flexibility using criteria recently proposed by Rambo & Tainer (49). The goal of this approach was to determine whether M3+TE could be treated as a conformationally restricted complex or whether it required ensemble-state modeling. Specifically, we examined whether (i) the Kratky plot converged to baseline in the high-q region; (ii) the Porod-Debye law was valid, as indicated from a plateau in the mid-q region of the Porod-Debye plot; (iii) the observed Rg was significantly less than that predicted from an unfolded protein with equivalent length (58; 59); and (iv) the “apparent Porod density” was representative of unfolded proteins, proteins comprised of structured domains and flexible regions, or highly structured proteins (60-62). The apparent Porod density is calculated from the Porod volume and the particle mass. Because Porod's law is most accurate for describing spherical particles, the apparent Porod density tends to be 20-30% lower than the average density of a protein (1.35 g/cm3) when particles have non-spherical shapes (57).
As with the individual PKS domains, the Kratky plot of M3+TE converged back to baseline in the high-q region, and a plateau was present in the mid-q region of the Porod-Debye plot (Figure S9B). Furthermore, the experimentally derived Rg value (61.4 Å) implied that M3+TE was considerably more compact than a random coil of the same length, as estimated from Flory's equation (87.3 Å; Table S1) (58; 63; 64). The apparent Porod density (1.0 g cm-3; Table 2) was markedly lower than the average value (1.35 g cm-3) derived from examination of structures deposited in the Protein Data Bank (60-62), suggesting M3+TE was non-spherical. However, the apparent Porod density was similar to that calculated for a number of proteins in the SAXS database with folded domains and flexible regions such as linkers and affinity tags (53). Taken together, our data suggests that M3+TE does not sample a wide range of conformational states under our experimental conditions. Therefore, we proceeded to model the three-dimensional architecture of M3+TE using rigid body modeling as opposed to ensemble state calculations, as this represented the more parsimonious method in light of our observations.
Ten independent replicates of rigid body refinement were performed in CORAL (65) under the default settings. Enforcing P2 symmetry during refinement preserved the dimerization interfaces along the KS and TE domains, while allowing the independent rotation and translation of each monomer and dimer to be limited only by the length of connecting linkers. The results from each simulation were then pooled and binned into structurally unique clusters using pairwise all-atom RMSD values as criteria in DAMCLUST (57). Two dominant clusters emerged with nearly identical fits to the SAXS data; clusters I and II comprising 7/10 and 2/10 structures, respectively (Figure 3A & E). The tenth structure had an RMSD of ∼45 Å when compared to clusters I and II (Figure 3A; Table S2). Distinguishing features between clusters were assessed from an all-atom alignment of structures within each cluster along the KSAT3 didomain, revealing that the KR3, ACP3, and the TE domains sat atop the KSAT3 didomain, and were rotated about the axis of symmetry approximately 50° relative to each other (Table S2). The molecular envelope calculated using DAMMIF (54) was a flat disc-shaped structure with overall dimensions 180 Å × 170 Å × 80 Å that overlaid best with rigid body models from cluster I, as determined by manually fitting the models into the filtered and averaged molecular envelop (Figure 5D).
Figure 3. Global architecture of M3+TE.
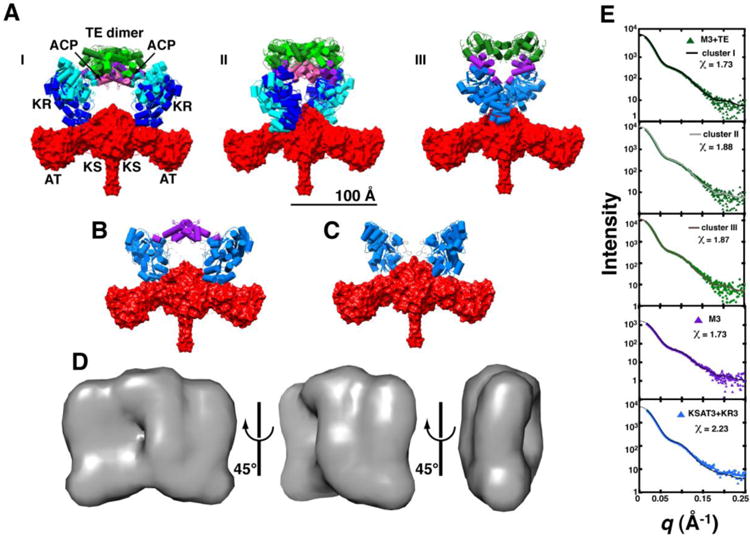
Ten independent rigid body refinement models were generated using CORAL with P2 symmetry applied and dimerization enforced across the KS and TE domains. The results were clustered using all-atom RMSD alignments under the default settings in DAMCLUST. (A) Cluster I contained 7/10 models (RMSD = 20 ± 6 Å), whereas 2/10 models were binned into cluster II (RMSD = 11.7 Å); the remaining structure is shown in panel III. Structures of each cluster were aligned using the KSAT3 didomain in order to assess heterogeneity at the KR, ACP, at TE domain positions. Two representatives from clusters I and II are shown. Domains are colored as in Figure 2B with dark and light shading indicating different cluster representatives. SAXS datasets were also collected for (B) M3 and (C) KSAT3+KR3, and processed in the same manner. Structures that closely resemble clusters I and II of M3+TE are shown. (D) Twenty independent ab initio calculations of the molecular envelope of M3+TE were performed using DAMMIF, with P2 symmetry imposed. The models were aligned, averaged, and filtered in DAMAVER to eliminate noise. The resulting shape is shown in three orientations. All structures are scaled equivalently with a 100 Å scale bar provided in (A). (E) Theoretical scattering curves for models generated via rigid body refinement were fit to the experimental datasets using CRYSOL. The resulting curves fit the data best in the low-q region (q < 0.15), suggesting a resolution of ∼40 Å (d = 2π/q). Chi2-free values are reported in Table S4.
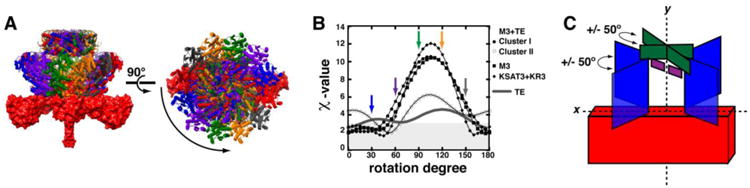
Figure 5. Overall architecture of DEBS3.
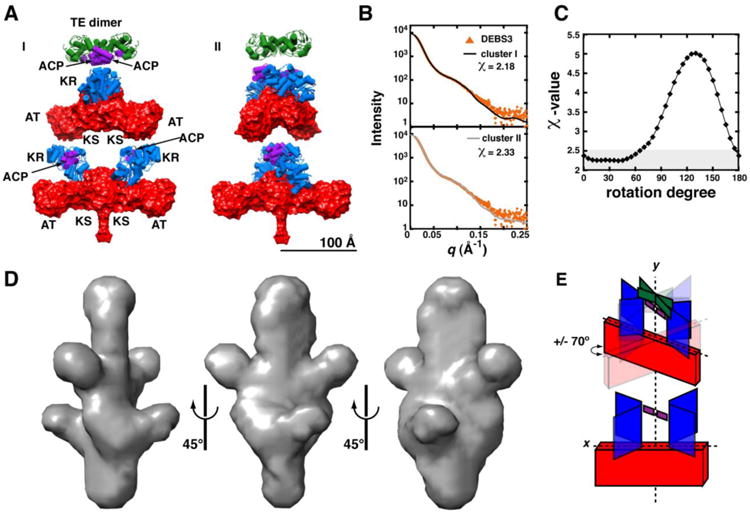
Ten independent rigid body refinement models were generated for DEBS3 using CORAL with P2 symmetry applied and dimerization enforced across the KS and TE domains. The results were clustered using all-atom RMSD alignments under the default settings in DAMCLUST. (A) Cluster I includes 4/10 models (RMSD = 23 ± 4 Å), and cluster II includes 3/10 models (RMSD = 27 ± 4 Å). One representative from each cluster is shown. Domains are colored as in Figure 2B. (B) Theoretical scattering curves for structures in each cluster were fit to SAXS data using CRYSOL. The best agreement between theoretical and experimental scatterings curves was observed in the low-q region (q < 0.125), suggesting a resolution accuracy of ∼50 Å (d = 2π/q). Chi2-free values are reported in Table S4. (C) In order to assess the most accurate placement of M6 with respect to M5, we generated a library of conformers by rotating M6 from cluster I about the 2-fold axis of symmetry while keeping the position of M5 fixed. Each structure was fit to the experimental data, and the reported χ-values were plotted as a function of rotation angle. (D) P2 symmetry was applied during 10 independent ab initio calculations of the DEBS3 molecular envelope using DAMMIN. The models were binned into clusters based on lowest NSD between structures, using the default settings in DAMCLUST. Good agreement with rigid body models was observed for 7 of 10 structures. The average envelope from these structures was refined over 20 ab initio modeling cycles using DAMMIN. The filtered, average molecular envelope is shown in three orientations. All structures are scaled equivalently with a 100 Å scale bar provided in (A). (E) A schematic representation of DEBS3 shows we can place M6 colinear to M5. M6 may be rotated with respect to M5 by as much as 70° relative to the xy-plane of M5.
Placement of KR3 and ACP3 with respect to the KSAT3 didomain was further supported by scattering data collected for M3 alone and M3 without the ACP domain (referred to as M3 and KSAT3+KR3, respectively; Figures 1D & 3B-C). Because both constructs existed as monomer-dimer mixtures in solution (Figure S7), Kratky analysis was used to ensure that appropriate datasets were selected for rigid body refinement, as detailed above. In both cases, a clear two-state transition was present such that nearly homogeneous samples of dimeric species were observed on the left-hand portion of each elution profile (Figure S10 & S11). Addition of KR3 to KSAT3 resulted in a 10% increase in Rg (∼5 Å), while the Dmax value remained constant, consistent with a compact structure in which the KR3 domains sat atop the KSAT3 didomain as opposed to an elongated structure that would be expected if the KR3 domains were to flank the AT regions (Table 2). Similar patterns were observed when comparing the Rg and Dmax values of KSAT3+KR3 to those of M3 and M3+TE, implying that the ACP3 and TE domains also occupied positions close to the protein core. SAXS data for M3 and KSAT3+KR3 showed convergence to the baseline in the high-q region and a plateau in the mid-q region of the Kratky and Porod-Debye plots, respectively. Similarly, the experimentally derived Rg values were much smaller than those expected for a random coil (Table S1), and their densities were reflective of structured proteins with flexible loops and terminal regions (Table 2). Therefore, we used rigid body refinement to model each structure by performing ten independent calculations and binning the pooled results into unique clusters, using CORAL and DAMCLUST, respectively. The clusters were examined for similarity to clusters I, II, and III of M3+TE. Representative best-fit models are shown in Figure 3B-C.
Although the theoretical scattering curves predicted from the above models for M3+TE and its truncated derivatives showed excellent fits with the corresponding experimental datasets at q ≤ 0.15 (ca. 40 Å resolution; Figure 3E), we sought a more accurate way to describe the orientation of the KR3, ACP3, and TE domains relative to the KSAT3 core. The primary differences between individual M3+TE clusters were the extent to which the KR3 and TE domains were rotated. We systematically and collectively rotated the KR3, ACP3, and TE domains 175° about the y-axis of KSAT3 in 5° intervals (Figure 4A). Each structure was then fit to the appropriate experimental scattering data with CRYSOL (66), and the resulting χ-values were plotted as a function of the rotation angle (Figure 4B). The SAXS data for M3+TE cluster I, M3, and KSAT3+KR3 agreed well with structures in which the KR3 domains were positioned within 50° of the KSAT3 xy-plane. M3+TE cluster II had notably higher χ-values in the 0-40° region, and fit the data best in the 40-70° region. Furthermore, the TE dimer in cluster II was rotated 65° with respect to its counterpart in cluster I. To establish whether the difference between the quality of fit for the rotated structures in clusters I and II was due to the orientation of the the KR3 or the TE domain, we held the KSAT3, KR3, and the ACP3 domains of cluster I at 0°, and only rotated the TE domains. Plotting the χ-values for each structure as a function of rotation angle revealed that models in which the TE domain was rotated within approximately 25° from its starting position fitted our scattering data quite well (Figure 4B). This suggested that the position of the TE domain impacted the quality of the fit to a lesser extent as compared to the position of the KR3 domain. Overall our analysis suggested that the KR3 and ACP3 domains were positioned within +/- 50° of the KSAT3 xy-plane, and that the TE dimer was oriented within +/- 50° of the KR3 xy-plane (Figure 4C).
Figure 4. Relative location of domains in M3+TE.
In order to assess the most accurate placement of the KR3, ACP3, and TE domains relative to the KSAT3 didomain, a library of models were generated for M3+TE (clusters I & II), M3, and KSAT3+KR3 by rotating the appropriate domains in each average structure 175°about the axis of symmetry in 5° increments. (A) Examples of the M3+TE structures at 0°, 30°, 60°, 90°, 120°, and 150° are shown colored with red, blue, purple, green, gold, and grey, respectively. (B) Each orientation was then fit to the SAXS data using CRYSOL, and the resulting χ-values were plotted as a function of the rotation angle (χ-values ≤ 2.5 are shaded in grey). For M3+TE cluster I, the KSAT3, KR3, and ACP3 domains were also held at the 0° position, and only the TE domain was rotated; this is shown as a grey line. (C) SAXS-derived datasets agree well with models in which the KR and ACP domains are positioned within 50° of the KS-AT xy-plane and where the TE dimer is positioned within 50° of the KR xy-plane.
Architectural features of DEBS3
A unique characteristic of assembly line PKSs is their multimodular architecture. To gain insight into the architectural arrangement of interacting modules, we purified bimodular DEBS3 (homodimeric MW 660 kDa (15; 67)), which is comprised of M5, M6, and the TE domain (Figure 1C-D). SAXS data was collected on the purified protein directly as it is eluting from the SEC column, as described above for the individual domains and M3 variants. Kratky analysis of datasets collected throughout the SEC elution profile revealed that the DEBS3 sample was monodisperse (Figure S12). Its Porod volume was consistent with a non-spherical, dimeric species (Table 2), and the shape of the P(r) function deviated from that expected for a spherical particle (Figures S12) in a manner akin to elongated protein structures, such as the cellulosome (12; 68). An initial estimate of the particle shape was obtained from 10 independent ab initio simulations performed using DAMMIN (69), and suggested that the average DEBS3 complex was an ellipsoidal, dimeric particle. Therefore, we repeated DAMMIN simulations under the P2 symmetry constraint, and averaged and filtered the resulting models with DAMAVER (55). The averaged structure was then used as an initial approximation of the search volume during a single round of refinement using DAMMIN. Twenty independent simulations consistently predicted a flattened and elongated ellipsoid with overall dimensions 300 Å × 190 Å × 100 Å (normalized spatial discrepancy (NSD) = 0.87 ± 0.03; Figure S13) and distinct curvature in the mid-region, suggestive of a twist. The dimensions of the molecular envelope were consistent with those expected from a structure in which modules were collinear rather than a more spherical shape that would be expected if the modules were stacked.
In a manner similar to the isolated domains and single module constructs, the Kratky plot of DEBS3 converged to baseline in the high-q region, and a plateau was observed in the mid-q region of the Porod-Debye plot (Figure S12). The observed Rg was much smaller than that predicted for a random coil (82.0 Å vs. 126.5 Å), and the apparent Porod density was consistent with the previously described constructs (1.00 g cm-3) (Tables 2 & S1). Therefore, we selected rigid body refinement as an acceptable modeling method. Ten independent rigid body modeling simulations were performed in CORAL (65) in which the TE dimer as well as each KS-AT didomain, KR, and ACP were treated as rigid bodies. P2 symmetry was applied along the KS and TE dimerization interfaces, and the modules were oriented collinearly in the starting model, as suggested by ab initio reconstruction.
The rigid body models were pooled and compared based on all-atom RMSD values, using the default settings in DAMCLUST (57). This resulted in four structurally unique clusters that displayed nearly identical fits to the experimental data despite an inter-cluster RMSD of 50 ± 10 Å (Figure 5A-B & S14). The theoretical scattering curves for each structure, computed in CRYSOL, deviated from the experimental data at q > 0.125, indicating a resolution accuracy of approximately 50 Å. Four structures were binned into cluster I (RMSD of 23 ± 4 Å), four structures were binned into cluster II (RMSD of 28 ± 4 Å), and the remaining two structures were classified as isolated clusters (Figure S14). An all-atom alignment across residues in KSAT5 revealed that the primary difference between clusters was the degree to which M5 and M6 were rotated relative to each other (Figures 5). The spatial orientations of domains within each module were analogous to the single module constructs. Specifically, the KR domains were positioned within 50° of the KS-AT xy-planes, and the TE dimers were within 50° of the KR xy-planes.
The marked angle predicted between M5 and M6 prompted us to inspect individual ab initio derived envelopes of DEBS3 for shapes that more closely resemble the rigid body models. The initial output files from DAMMIN were clustered based on a minimum NSD between aligned dummy atoms in our models, using the default settings in DAMCLUST. This resulted in three unique clusters (Figure S15). Cluster I comprised 7 out of 10 models (NSD = 1.06 ± 0.03), and displayed clear architectural definition in the midsection that overlaid well with representatives from both rigid body clusters of DEBS3 (Figure 5). The average envelope from this cluster provided an initial estimate for the particle in a subsequent round of refinement. Because ab initio modeling using DAMMIN did not require information regarding high-resolution structures or the number of amino acids in the complex, the similarity observed between the dummy atom models and rigid body models can be considered cross-validation of the deduced particle shape.
Finally, we assessed the impact on curve fitting as a result of rotating M6 by 175° about the axis of symmetry while holding the spatial orientation of M5 constant. The quality of fit was not significantly impacted during a counter-clockwise 70° rotation of M6 about the axis of symmetry. This observation agreed well with the apparent resolution accuracy of ∼50 Å (Figure 5D). Therefore, our data supports a model in which the KSAT6 exists within 70° of the xy-plane of KSAT5, and the spatial orientations of the KR and TE domains are similar to the single module constructs (Figure 5E). We note that an analogous model for DEBS3 has been proposed previously based on ultracentrifugation and limited proteolysis (15).
Discussion
Combining high-resolution structural information with SAXS represents a powerful approach for modeling large dynamic macromolecular complexes that resist crystallization(70). In this report, we have presented SAXS data for fragments of DEBS whose atomic structures have previously been reported. The solution state of each protein is conformationally stable, and is consistent with its high-resolution structure. Taken along with previous findings (15; 19; 20), these results allowed the consideration of whole module and bimodular assemblies as collections of rigid bodies connected by flexible linkers. This interpretation was bolstered by our observation that scattering data collected for a set of M3 variants and DEBS3, were indicative of well-folded, conformationally restricted proteins. Prior to structural modeling, we ensured that our experimental data fulfilled at least three out of four recently proposed criteria for assessing the appropriate method for modeling multidomain protein assemblies (49), and found that rigid body modeling represented an acceptable method for modeling each three-dimensional structure. By performing at least 10 independent simulations for each multidomain construct, multiple conformational states were shown to be consistent with SAXS data. The agreement between computational results and experimental data was within an accuracy of 40-50 Å. By comparing representative conformations of each protein, the approximate orientations of the KS-AT didomain, KR, and TE domain were deduced in whole-module and bimodular proteins (Figure 4C; 5E). Our data suggests that the KR domain is positioned within 50° of the KS-AT xy-plane and the TE dimer is within 50° of the KR xy-plane. Modules M5 and M6 appear to be arranged collinearly and may rotate up to 70° away from the KS-AT xy-plane. The overall structural similarity of M3+TE, M3, KSAT3+KR3, and DEBS3, which were independently modeled, provides an internal consistency check on the robustness of the reported macromolecular shapes and dimensions. It is noteworthy that many unique ab initio or rigid body models can give nearly identical fits to SAXS data. Therefore, it should be emphasized that specific domain orientations within each model are to be interpreted with a grain of salt while bearing in mind that our models of a whole module and bimodule are strong evidence for the overall shape and dimensions of each protein.
During polyketide biosynthesis, the ACP covalently and sequentially shuttles the growing polyketide chain to each active site in a module, and ultimately translocates the nascently elongated and modified chain to the next module in the assembly line. Although the resolution accuracy of our SAXS datasets is not high enough to allow us to precisely model the spatial orientation of the ACP with respect to all of its partner domains, we were able to verify that dramatic conformational distortions of the PKS module and bimodule shapes were not required for the ACP to access its partner enzymes. We used rigid body modeling in CORAL to simulate domain dynamics along the catalytic cycle of M3+TE by applying a distance constraint of 20 Å between S54 on ACP3 and the active site of each catalytic domain (S651, C202, Y1813, and S142 of the AT, KS, KR, and TE domains, respectively). Although ACP3 of our M3+TE sample was post-translationally modified with the phosphopantetheine arm, CORAL can only accept Cα atoms as input prior to rigid body modeling. To bypass this software limitation, we used a seven amino acid polyglycine chain measuring ∼20 Å to approximate the maximum length of the fully extended phosphopantetheine arm (∼17 Å). The N-terminus of the polyglycine chain was constrained within 1 Å of the hydroxyl group on S54 of the ACP3, and the C-terminus was constrained within 1 Å of the catalytic residue on each enzymatic domain (Figure S16A-D). Similarly, we directed S54 of the ACP from M5 within 20 Å of the KS active site on M6 to simulate chain translocation on DEBS3 (Figure S16E). We observed that the theoretical scattering curve for the resulting structures fit our experimental data comparably to models built without imposing any constraint on the position of the ACP. Thus, the overall disc-shaped structure of M3+TE and collinear arrangement of modules within DEBS3 appear to be geometrically consistent with catalytically competent enzymes because the ACP domains can be positioned within 20 Å of each active site without dramatically changing the macromolecular architecture. We note that all of the constructs analyzed in this study were under “free-state/non-catalytically active” conditions because no substrates were added during data collection. Therefore, directing the ACP to each active site using rigid body modeling served only to check that the geometry of the models presented in this report are reasonable with respect to domain rearrangements that occur during polyketide biosynthesis. The precise spatial positions and protein-protein interactions that each domain samples during catalysis will require higher-resolution insights. In turn, such insights will unquestionably enhance our understanding of assembly line PKS function and our ability to engineer these remarkable megasynthases for the production of “unnatural” natural products.
The modular architecture of PKS assembly lines is a critical feature that facilitates the evolutionary process by allowing bacteria to rapidly mix and match or duplicate sections of PKS assemblages, creating the potential to produce novel antimicrobial analogs. Our models of DEBS3 suggest that intermodular interactions are minimal, supporting biochemical evidence that that the binding affinity between adjacent modules in an operating assembly line is on the order of 1 μM(71). Similarly, PKS assembly line modules are moderately promiscuous, suggesting that low affinity maybe accompanied by low specificity, as evidenced by the ability of biological engineers to and mix and match modules from divergent phylogenetic backgrounds with reasonable success(7; 8) and very minimal engineered protein-protein interactions. Taken together, a colinear arrangement of modules with minimal protein-protein interactions may facilitate evolution of new assembly lines by allowing whole module duplication events(72-74) within a functioning PKS assembly with a relatively low impact on activity. Alternatively, homologous recombination occurring at intermodular junctions between distinct assembly lines is an attractive model for driving PKS assembly line diversity(75-77). In either case, a malleable architecture would allow competing bacteria to rapidly produce novel antibiotics and signaling compounds from rather limited genetic resources. The arrangement of domains within a whole module and bimodule reported, represent a critical step forward in our understanding of PKS structural biology as this work sets the stage for a detailed investigation of protein-protein interactions that facilitate intermodular interactions.
Experimental Procedures
Protein expression and purification
Cloning, expression, and purification procedures for ACP3, KR1, KSAT3, TE, M3+TE, and DEBS3 have been previously reported (18; 39; 56; 78). KSAT3+KR3 and M3 were expressed from pLKC14 and pLKC50, respectively. pLKC14 and pLKC50 were constructed by amplifying the KSAT3+KR3 and M3 fragments, respectively, from pRSG34 (18). KSAT3+KR3 was amplified using the following primers: pLKC14_fwd 5′GAGCTCGAATTCATCCGGCTCGCCGGTCGGTC and pLKC14_rev 5′ATATACATATGGCTAGCACTGACAGCGAGAAGGTG, and M3 was amplified using pLKC14_rev and pLKC50_fwd 5′GAGCTCGAATTCATGTCGAGCTGACTAGTCA. The PCR products were then digested with EcoRI and NdeI and separately ligated into the vector resulting from digestion of pRSG34 with the corresponding enzymes. E. coli BL21(DE3) or E. coli BAP1 cells (79) were transformed with appropriate plasmid DNA and grown in LB media containing 50 μg/mL kanamycin or 100 μg/mL carbenicillin at 37 °C until the OD600 reached 0.6. Protein expression was induced by adding 250 μL of 1 M IPTG per liter culture volume. Following IPTG addition, the cells were grown at 18 °C overnight.
Following centrifugation, cells were suspended in lysis buffer (50 mM Na-phosphate pH 7.6, 300 mM NaCl, 10 mM imidazole, 10% glycerol, and one protease inhibitor tablet (Roche 11 873 580 001)), and lysed by sonication over ice (5 × 30 sec). The lysate was clarified by centrifugation at 4420g at 4 °C for 1 h, and the supernatant was mixed with Ni2+-NTA resin (2.5 mL resin per 1 L cell culture; Molecular Cloning Laboratories #NINTA-300) and incubated with rocking at 4 °C for 10 min. The resin was washed with 10 column volumes (CV) of wash buffer (50 mM Na-phosphate pH 7.6, 300 mM NaCl, 30 mM imidazole, 10% glycerol) and the protein was eluted with 25 mL of elution buffer (50 mM Na-phosphate pH 7.6, 150 mM NaCl, 300 mM imidazole, 10% glycerol). The protein sample was diluted 2-fold with 50 mM Na-phosphate pH 7.6, 10% glycerol and loaded onto a 5 mL HiTrap Q HP column equilibrated with 50 mM Na-phosphate pH 7.6, 10% glycerol using an ÄKTA FPLC system (GE Healthcare) and eluted using an appropriate gradient ending with 50 mM Na-phosphate pH 7.6, 1 M NaCl, and 10% glycerol. Fractions containing the desired protein were pooled, concentrated to 1 mL (∼20 mg/mL) using an appropriate centrifugal filter device, and exchanged into 50 mM Na-phosphate pH 7.6, 10% glycerol for storage at -80 °C.
Size exclusion chromatography
A HiLoad 26/60 Superdex 200 pg column (GE Healthcare) was equilibrated in 200 mM Na-phosphate pH 7.6, 10% glycerol and calibrated using commercially available protein standards (Sigma MWGF1000-1KT) at a 1.0 mL/min flow rate. Kav = (Ve-Vo)/(Vt-Vo), where Ve, Vo, and Vt are apparent elution volume, void volume, and total volume, respectively. Vo and Vt were determined with dextran blue 2000 and adenine, respectively. Protein samples (500 μL, 10-30 mg/mL) were loaded, and eluted at a flow rate of 1 mL/min.
Small angle X-ray scattering
SAXS data was collected on the Bio-SAXS beam line BL4-2 at Stanford Synchrotron Radiation Lightsource (SSRL)(80) using a Rayonix MX225-HE CCD detector (Rayonix, Evanston, IL) with a 1.7 m or 2.5 m (DEBS3 only) sample-to-detector distance and 11 keV (wavelength, λ = 1.127 Å) beam energy. The momentum transfer (scattering vector) q was defined as q = 4πsin(θ)/λ, where 2θ is the scattering angle. The q scale was calibrated by silver behenate powder diffraction (81). All data were collected up to a maximum q of 0.53 Å-1 (1.7 m sample-to-detector distance) or 0.37 Å-1 (2.5 m sample-to-detector distance).
Each protein sample (100 μL) was applied onto a Superdex 200 PC 3.2/30 or Superose 6 PC 3.2/30 (DEBS3 only) column equilibrated in 200 mM Na-phosphate, pH 7.6, plus 10% glycerol. Eluate was collected at 0.05 mL/min and passed through a 1.5 mm quartz capillary cell (Hampton Research, Aliso Viejo, CA) at 20 °C in line with the X-ray beam. Details of the FPLC-SAXS experimental setup at BL4-2 have been previously described (82). Scattering images were obtained with 1 s exposures every 5 s using the data acquisition program Blu-ICE(83; 84). The data processing program SasTool (http://ssrl.slac.stanford.edu/∼saxs/analysis/sastool.htm) was used for scaling, azimuthal integration, and averaging of individual scattering images after inspection for any variations potentially cause by radiation damage. The first 100 frames were scaled and averaged to create a buffer-scattering profile, which was then subtracted from each of the subsequent images to produce the final scattering curve for each frame. Further data analysis was performed using tools in the ATSAS package (57).
Data for every five frames along the course of the elution profile was averaged in PRIMUS (85), scaled according to the peak position as indicated in Figures 2, S4, and S9-S12, and analyzed for changes in the shape of the Kratky plot. For eluate peaks with relatively unchanged Kratky plots, 12 datasets were averaged across the entire peak. In contrast, only datasets representing the dimeric species were averaged for protein peaks that showed a clear two-state transition (M3 and KSAT3+KR3) or partial two-state transition (KSAT3). PRIMUS QT, the cross-platform version of PRIMUS, was used to calculate the Porod volume, Rg, and Dmax, and to generate the pairwise distribution functions P(r) up to q ≅ 0.3 Å-1 by executing GNOM (86). Datasets were also examined for evidence of aggregation or inter-particle interference by analyzing the Guinier plots generated in PRIMUS. In the processing of all datasets, intensities at q < π/Dmax were deleted prior to comparison with atomic structures for each domain, ab initio calculations, or rigid body modeling; this was done in order to eliminate the contribution of potential contaminants (13). The Porod exponents were calculated in ScÅtter(87).
For each averaged and refined SAXS curve, 20 independent ab initio models were generated using DAMMIF (54) with default settings. The resulting structures were superimposed and averaged using DAMAVER(55). DAMMIN(69) was employed for DEBS3 because of the potential for specifying the direction of anisometry applicable with P2 symmetry. Following inspection of the excluded volume calculated for each particle in DAMMIN/F, ab initio modeling was repeated for the TE, KSAT3, KSAT3+KR3, M3, M3+TE, and DEBS3 under the P2 symmetry constraint. Models for DEBS3 were then refined using the averaged model with a fixed core calculated in DAMAVER as an initial approximation of the particle shape. 20 independent envelopes were generated using DAMMIN, and the models were averaged and filtered in DAMAVER.
All datasets were truncated to qmax = 0.25 Å-1 prior to comparison with high-resolution structures of each domain using CRYSOL (66) or before rigid body modeling in CORAL (65). The theoretical scattering curves calculated from high-resolution structures of DEBS domains apo-ACP2 (pdb ID: 2JU2), KR1 (pdb ID: 2FR0), TE (pdb ID: 1MO2), and KSAT3 (pdb ID: 2QO3) were fit to the averaged and refined datasets of the corresponding proteins. Although the crystal structure of KSAT3 fit the experimental scattering data with χ = 3.07, the fit was improved to χ = 2.08 by including the N-terminal coiled-coil that is present in the purified sample but was absent in the crystallographically analyzed construct. This was accomplished by performing a sequence based structural alignment of KSAT3 and KSAT5 (pdb ID: 2HG4), which contains a structurally homologous N-terminal coiled-coil domain (residues 9-38 of the indicated pdb file), using UCSF Chimera(88). Subsequently the new coordinates for the coiled-coil region were saved together with the KSAT3 coordinates and the resulting pdb file was used for fitting with CRYSOL. The fit of each high-resolution structure was further improved by modeling the N- and/or C-terminal His tags using rigid body refinement in CORAL. Modeling experiments involving apo-ACP2 and KR1 were performed without symmetry constraints, while the TE and KSAT3 dimers were treated with P2 symmetry. However, the orientation of both monomers was fixed while possible conformations of terminal regions were sampled.
In order to preserve the dimeric nature of the TE and KSAT3 during rigid body modeling of M3+TE, M3, KSAT3+KR3, and DEBS3, P2 symmetry was applied along the z-axis of the pdb coordinates. (This is labeled as the y-axis in Figure 4C.) Similarly, contact constraints were specified based on measured distances between residues along the dimerization interfaces in the appropriate crystal structures (Table S4). Rigid body modeling was performed 10 times for each construct, using rotational sampling at 20° and spatial steps of 5 Å. From these simulations, unique results with χ < 2.00 for all constructs except DEBS3 and χ < 2.15 for DEBS3 were pooled and binned into clusters, using DAMCLUST with default settings (57). RMSD differences between each cluster are reported in Table S2. The angles between domains were calculated in Chimera. The theoretical curve for each rigid body model presented in this manuscript was fit to the experimental data using CRYSOL, which minimizes the discrepancy between the theoretical and experimental curves as defined by:
χ2-free values(89) were also calculated for each model and are reported in Table S4.
Supplementary Material
Highlights.
Atomic-resolution structures of DEBS fragments are consistent with SAXS data.
DEBS module 3 is disc-shaped, capable of caging the ACP proximal to each active site.
DEBS3 is an elongated ellipsoid, suggesting that modules 5 and 6 stack collinearly.
Acknowledgments
We acknowledge Louise K. Charkoudian for plasmids pLKC14 and pLKC50, and Francis Reyes for insightful discussions during preparation of this manuscript. This work was funded by a grant from the National Institutes of Health (R01 GM087934 to C.K.). A.E. is a recipient of a postdoctoral fellowship from the A.P. Giannini Foundation. SAXS data collection was carried out at the Stanford Synchrotron Radiation Lightsource, a Directorate of SLAC National Accelerator Laboratory and an Office of Science User Facility operated for the U.S. Department of Energy Office of Science by Stanford University. The SSRL Structural Molecular Biology Program is supported by the DOE Office of Biological and Environmental Research, and by the National Institutes of Health, National Institute of General Medical Sciences (including P41GM103393). The contents of this publication are solely the responsibility of the authors and do not necessarily represent the official views of NIGMS, NCRR, or NIH.
Footnotes
Publisher's Disclaimer: This is a PDF file of an unedited manuscript that has been accepted for publication. As a service to our customers we are providing this early version of the manuscript. The manuscript will undergo copyediting, typesetting, and review of the resulting proof before it is published in its final citable form. Please note that during the production process errors may be discovered which could affect the content, and all legal disclaimers that apply to the journal pertain.
References
- 1.Keatinge-Clay AT. The structures of type I polyketide synthases. Nat Prod Rep. 2012;29:1050–73. doi: 10.1039/c2np20019h. [DOI] [PubMed] [Google Scholar]
- 2.Meier JL, Burkart MD. The chemical biology of modular biosynthetic enzymes. Chem Soc Rev. 2009;38:2012–45. doi: 10.1039/b805115c. [DOI] [PubMed] [Google Scholar]
- 3.Weissman KJ, Muller R. Protein-protein interactions in multienzyme megasynthetases. Chembiochem. 2008;9:826–48. doi: 10.1002/cbic.200700751. [DOI] [PubMed] [Google Scholar]
- 4.Khosla C, Tang Y, Chen AY, Schnarr NA, Cane DE. Structure and mechanism of the 6-deoxyerythronolide B synthase. Annu Rev Biochem. 2007;76:195–221. doi: 10.1146/annurev.biochem.76.053105.093515. [DOI] [PubMed] [Google Scholar]
- 5.Cortes J, Haydock SF, Roberts GA, Bevitt DJ, Leadlay PF. An unusually large multifunctional polypeptide in the erythromycin-producing polyketide synthase of Saccharopolyspora erythraea. Nature. 1990;348:176–8. doi: 10.1038/348176a0. [DOI] [PubMed] [Google Scholar]
- 6.Donadio S, Staver MJ, McAlpine JB, Swanson SJ, Katz L. Modular organization of genes required for complex polyketide biosynthesis. Science. 1991;252:675–9. doi: 10.1126/science.2024119. [DOI] [PubMed] [Google Scholar]
- 7.Menzella HG, Reid R, Carney JR, Chandran SS, Reisinger SJ, Patel KG, Hopwood DA, Santi DV. Combinatorial polyketide biosynthesis by de novo design and rearrangement of modular polyketide synthase genes. Nat Biotechnol. 2005;23:1171–6. doi: 10.1038/nbt1128. [DOI] [PubMed] [Google Scholar]
- 8.Menzella HG, Carney JR, Santi DV. Rational design and assembly of synthetic trimodular polyketide synthases. Chem Biol. 2007;14:143–51. doi: 10.1016/j.chembiol.2006.12.002. [DOI] [PubMed] [Google Scholar]
- 9.Ranganathan A, Timoney M, Bycroft M, Cortes J, Thomas IP, Wilkinson B, Kellenberger L, Hanefeld U, Galloway IS, Staunton J, Leadlay PF. Knowledge-based design of bimodular and trimodular polyketide synthases based on domain and module swaps: a route to simple statin analogues. Chem Biol. 1999;6:731–41. doi: 10.1016/s1074-5521(00)80020-4. [DOI] [PubMed] [Google Scholar]
- 10.Oliynyk M, Brown MJ, Cortes J, Staunton J, Leadlay PF. A hybrid modular polyketide synthase obtained by domain swapping. Chem Biol. 1996;3:833–9. doi: 10.1016/s1074-5521(96)90069-1. [DOI] [PubMed] [Google Scholar]
- 11.McDaniel R, Kao CM, Hwang SJ, Khosla C. Engineered intermodular and intramodular polyketide synthase fusions. Chem Biol. 1997;4:667–74. doi: 10.1016/s1074-5521(97)90222-2. [DOI] [PubMed] [Google Scholar]
- 12.Putnam CD, Hammel M, Hura GL, Tainer JA. X-ray solution scattering (SAXS) combined with crystallography and computation: defining accurate macromolecular structures, conformations and assemblies in solution. Q Rev Biophys. 2007;40:191–285. doi: 10.1017/S0033583507004635. [DOI] [PubMed] [Google Scholar]
- 13.Koch MH, Vachette P, Svergun DI. Small-angle scattering: a view on the properties, structures and structural changes of biological macromolecules in solution. Q Rev Biophys. 2003;36:147–227. doi: 10.1017/s0033583503003871. [DOI] [PubMed] [Google Scholar]
- 14.Wall ME, Gallagher SC, Trewhella J. Large-scale shape changes in proteins and macromolecular complexes. Annu Rev Phys Chem. 2000;51:355–80. doi: 10.1146/annurev.physchem.51.1.355. [DOI] [PubMed] [Google Scholar]
- 15.Staunton J, Caffrey P, Aparicio JF, Roberts GA, Bethell SS, Leadlay PF. Evidence for a double-helical structure for modular polyketide synthases. Nat Struct Biol. 1996;3:188–92. doi: 10.1038/nsb0296-188. [DOI] [PubMed] [Google Scholar]
- 16.Wu N, Cane DE, Khosla C. Quantitative analysis of the relative contributions of donor acyl carrier proteins, acceptor ketosynthases, and linker regions to intermodular transfer of intermediates in hybrid polyketide synthases. Biochemistry. 2002;41:5056–66. doi: 10.1021/bi012086u. [DOI] [PubMed] [Google Scholar]
- 17.Wu N, Tsuji SY, Cane DE, Khosla C. Assessing the balance between protein-protein interactions and enzyme-substrate interactions in the channeling of intermediates between polyketide synthase modules. J Am Chem Soc. 2001;123:6465–74. doi: 10.1021/ja010219t. [DOI] [PubMed] [Google Scholar]
- 18.Gokhale RS, Tsuji SY, Cane DE, Khosla C. Dissecting and exploiting intermodular communication in polyketide synthases. Science. 1999;284:482–5. doi: 10.1126/science.284.5413.482. [DOI] [PubMed] [Google Scholar]
- 19.Aparicio JF, Caffrey P, Marsden AF, Staunton J, Leadlay PF. Limited proteolysis and active-site studies of the first multienzyme component of the erythromycin-producing polyketide synthase. J Biol Chem. 1994;269:8524–8. [PubMed] [Google Scholar]
- 20.Kim CY, Alekseyev VY, Chen AY, Tang Y, Cane DE, Khosla C. Reconstituting modular activity from separated domains of 6-deoxyerythronolide B synthase. Biochemistry. 2004;43:13892–8. doi: 10.1021/bi048418n. [DOI] [PubMed] [Google Scholar]
- 21.Tang Y, Chen AY, Kim CY, Cane DE, Khosla C. Structural and mechanistic analysis of protein interactions in module 3 of the 6-deoxyerythronolide B synthase. Chem Biol. 2007;14:931–43. doi: 10.1016/j.chembiol.2007.07.012. [DOI] [PMC free article] [PubMed] [Google Scholar]
- 22.Tang Y, Kim CY, Mathews II, Cane DE, Khosla C. The 2.7-Angstrom crystal structure of a 194-kDa homodimeric fragment of the 6-deoxyerythronolide B synthase. Proc Natl Acad Sci U S A. 2006;103:11124–9. doi: 10.1073/pnas.0601924103. [DOI] [PMC free article] [PubMed] [Google Scholar]
- 23.Alekseyev VY, Liu CW, Cane DE, Puglisi JD, Khosla C. Solution structure and proposed domain domain recognition interface of an acyl carrier protein domain from a modular polyketide synthase. Protein Sci. 2007;16:2093–107. doi: 10.1110/ps.073011407. [DOI] [PMC free article] [PubMed] [Google Scholar]
- 24.Keatinge-Clay AT, Stroud RM. The structure of a ketoreductase determines the organization of the beta-carbon processing enzymes of modular polyketide synthases. Structure. 2006;14:737–48. doi: 10.1016/j.str.2006.01.009. [DOI] [PubMed] [Google Scholar]
- 25.Keatinge-Clay A. Crystal structure of the erythromycin polyketide synthase dehydratase. J Mol Biol. 2008;384:941–53. doi: 10.1016/j.jmb.2008.09.084. [DOI] [PMC free article] [PubMed] [Google Scholar]
- 26.Broadhurst RW, Nietlispach D, Wheatcroft MP, Leadlay PF, Weissman KJ. The structure of docking domains in modular polyketide synthases. Chem Biol. 2003;10:723–31. doi: 10.1016/s1074-5521(03)00156-x. [DOI] [PubMed] [Google Scholar]
- 27.Tsai SC, Miercke LJ, Krucinski J, Gokhale R, Chen JC, Foster PG, Cane DE, Khosla C, Stroud RM. Crystal structure of the macrocycle-forming thioesterase domain of the erythromycin polyketide synthase: versatility from a unique substrate channel. Proc Natl Acad Sci U S A. 2001;98:14808–13. doi: 10.1073/pnas.011399198. [DOI] [PMC free article] [PubMed] [Google Scholar]
- 28.Maier T, Leibundgut M, Ban N. The crystal structure of a mammalian fatty acid synthase. Science. 2008;321:1315–22. doi: 10.1126/science.1161269. [DOI] [PubMed] [Google Scholar]
- 29.Brink J, Ludtke SJ, Yang CY, Gu ZW, Wakil SJ, Chiu W. Quaternary structure of human fatty acid synthase by electron cryomicroscopy. Proc Natl Acad Sci U S A. 2002;99:138–43. doi: 10.1073/pnas.012589499. [DOI] [PMC free article] [PubMed] [Google Scholar]
- 30.Stoops JK, Wakil SJ, Uberbacher EC, Bunick GJ. Small-angle neutron-scattering and electron microscope studies of the chicken liver fatty acid synthase. J Biol Chem. 1987;262:10246–51. [PubMed] [Google Scholar]
- 31.Maier T, Jenni S, Ban N. Architecture of mammalian fatty acid synthase at 4.5 A resolution. Science. 2006;311:1258–62. doi: 10.1126/science.1123248. [DOI] [PubMed] [Google Scholar]
- 32.Akey DL, Razelun JR, Tehranisa J, Sherman DH, Gerwick WH, Smith JL. Crystal structures of dehydratase domains from the curacin polyketide biosynthetic pathway. Structure. 2010;18:94–105. doi: 10.1016/j.str.2009.10.018. [DOI] [PMC free article] [PubMed] [Google Scholar]
- 33.Zheng J, Gay DC, Demeler B, White MA, Keatinge-Clay AT. Divergence of multimodular polyketide synthases revealed by a didomain structure. Nat Chem Biol. 2012;8:615–21. doi: 10.1038/nchembio.964. [DOI] [PMC free article] [PubMed] [Google Scholar]
- 34.Zheng J, Fage CD, Demeler B, Hoffman DW, Keatinge-Clay AT. The missing linker: a dimerization motif located within polyketide synthase modules. Chem Biol. 2013;8:1263–1270. doi: 10.1021/cb400047s. [DOI] [PMC free article] [PubMed] [Google Scholar]
- 35.Chakravarty B, Gu Z, Chirala SS, Wakil SJ, Quiocho FA. Human fatty acid synthase: structure and substrate selectivity of the thioesterase domain. Proc Natl Acad Sci U S A. 2004;101:15567–72. doi: 10.1073/pnas.0406901101. [DOI] [PMC free article] [PubMed] [Google Scholar]
- 36.Lowry B, R T, Weng CH, O'Brien RV, Cane DE, Khosla C. In vitro reconstitution and analysis of the 6-deoxyerythronolide B synthase. J Am Chem Soc. 2013 doi: 10.1021/ja409048k. [DOI] [PMC free article] [PubMed] [Google Scholar]
- 37.Kapur S, Lowry B, Yuzawa S, Kenthirapalan S, Chen AY, Cane DE, Khosla C. Reprogramming a module of the 6-deoxyerythronolide B synthase for iterative chain elongation. Proc Natl Acad Sci U S A. 2012;109:4110–5. doi: 10.1073/pnas.1118734109. [DOI] [PMC free article] [PubMed] [Google Scholar]
- 38.Kapur S, Chen AY, Cane DE, Khosla C. Molecular recognition between ketosynthase and acyl carrier protein domains of the 6-deoxyerythronolide B synthase. Proc Natl Acad Sci U S A. 2010;107:22066–71. doi: 10.1073/pnas.1014081107. [DOI] [PMC free article] [PubMed] [Google Scholar]
- 39.Chen AY, Schnarr NA, Kim CY, Cane DE, Khosla C. Extender unit and acyl carrier protein specificity of ketosynthase domains of the 6-deoxyerythronolide B synthase. J Am Chem Soc. 2006;128:3067–74. doi: 10.1021/ja058093d. [DOI] [PMC free article] [PubMed] [Google Scholar]
- 40.Schnarr NA, Chen AY, Cane DE, Khosla C. Analysis of covalently bound polyketide intermediates on 6-deoxyerythronolide B synthase by tandem proteolysis-mass spectrometry. Biochemistry. 2005;44:11836–42. doi: 10.1021/bi0510781. [DOI] [PubMed] [Google Scholar]
- 41.Tsuji SY, Wu N, Khosla C. Intermodular communication in polyketide synthases: comparing the role of protein-protein interactions to those in other multidomain proteins. Biochemistry. 2001;40:2317–25. doi: 10.1021/bi002462v. [DOI] [PubMed] [Google Scholar]
- 42.Wu NKF, Cane DE, Khosla C. Analysis of the molecular recognition features of individual modules derived from the erythromycin polyketide synthase. J Am Chem Soc. 2000;122:4847–4852. [Google Scholar]
- 43.Jacobsen JR, Cane DE, Khosla C. Spontaneous priming of a downstream module in 6-deoxyerythronolide B synthase leads to polyketide biosynthesis. Biochemistry. 1998;37:4928–34. doi: 10.1021/bi9729920. [DOI] [PubMed] [Google Scholar]
- 44.Minnihan EC, Ando N, Brignole EJ, Olshansky L, Chittuluru J, Asturias FJ, Drennan CL, Nocera DG, Stubbe J. Generation of a stable, aminotyrosyl radical-induced alpha2beta2 complex of Escherichia coli class Ia ribonucleotide reductase. Proc Natl Acad Sci U S A. 2013;110:3835–40. doi: 10.1073/pnas.1220691110. [DOI] [PMC free article] [PubMed] [Google Scholar]
- 45.Stoddard CD, Montange RK, Hennelly SP, Rambo RP, Sanbonmatsu KY, Batey RT. Free state conformational sampling of the SAM-I riboswitch aptamer domain. Structure. 2010;18:787–97. doi: 10.1016/j.str.2010.04.006. [DOI] [PMC free article] [PubMed] [Google Scholar]
- 46.Ando N, Brignole EJ, Zimanyi CM, Funk MA, Yokoyama K, Asturias FJ, Stubbe J, Drennan CL. Structural interconversions modulate activity of Escherichia coli ribonucleotide reductase. Proc Natl Acad Sci U S A. 2011;108:21046–51. doi: 10.1073/pnas.1112715108. [DOI] [PMC free article] [PubMed] [Google Scholar]
- 47.Kataoka M, Hagihara Y, Mihara K, Goto Y. Molten globule of cytochrome c studied by small angle X-ray scattering. J Mol Biol. 1993;229:591–6. doi: 10.1006/jmbi.1993.1064. [DOI] [PubMed] [Google Scholar]
- 48.Matsumura Y, Shinjo M, Matsui T, Ichimura K, Song J, Kihara H. Structural study of hNck2 SH3 domain protein in solution by circular dichroism and X-ray solution scattering. Biophys Chem. 2013;175-176:39–46. doi: 10.1016/j.bpc.2013.02.005. [DOI] [PMC free article] [PubMed] [Google Scholar]
- 49.Rambo RP, Tainer JA. Super-resolution in solution X-ray scattering and its applications to structural systems biology. Annu Rev Biophys. 2013;42:415–41. doi: 10.1146/annurev-biophys-083012-130301. [DOI] [PubMed] [Google Scholar]
- 50.Hammouda B. A new Guinier-Porod model. J Appl Cryst. 2010;43:716–719. [Google Scholar]
- 51.Stribeck N. X-Ray Scattering of Soft Matter. 2007:95–190. [Google Scholar]
- 52.Guttman M, Weinkam P, Sali A, Lee KK. All-atom ensemble modeling to analyze small-angle x-ray scattering of glycosylated proteins. Structure. 2013;21:321–31. doi: 10.1016/j.str.2013.02.004. [DOI] [PMC free article] [PubMed] [Google Scholar]
- 53.Rambo RP, Tainer JA. Characterizing flexible and intrinsically unstructured biological macromolecules by SAS using the Porod-Debye law. Biopolymers. 2011;95:559–71. doi: 10.1002/bip.21638. [DOI] [PMC free article] [PubMed] [Google Scholar]
- 54.Franke D, Svergun DI. DAMMIF, a program for rapid ab-initio shape determination in small-angle scattering. J Appl Cryst. 2009;42:342–346. doi: 10.1107/S0021889809000338. [DOI] [PMC free article] [PubMed] [Google Scholar]
- 55.Volkov VV, Svergun DI. Uniqueness of ab-initio shape determination in small-angle scattering. J Appl Cryst. 2003;36:860–864. doi: 10.1107/S0021889809000338. [DOI] [PMC free article] [PubMed] [Google Scholar]
- 56.Gokhale RS, Hunziker D, Cane DE, Khosla C. Mechanism and specificity of the terminal thioesterase domain from the erythromycin polyketide synthase. Chem Biol. 1999;6:117–25. doi: 10.1016/S1074-5521(99)80008-8. [DOI] [PubMed] [Google Scholar]
- 57.Petoukhov MV, Franke D, Shkumatov AV, Tria G, Kikhney AG, Gajda M, Gorba C, Mertens HDT, Konarev PV, Svergun DI. New developments in the ATSAS program package for small-angle scattering data analysis. J Appl Cryst. 2012;45:342–350. doi: 10.1107/S0021889812007662. [DOI] [PMC free article] [PubMed] [Google Scholar]
- 58.Bernado P, Svergun DI. Analysis of intrinsically disordered proteins by small-angle X-ray scattering. Methods Mol Biol. 2012;896:107–22. doi: 10.1007/978-1-4614-3704-8_7. [DOI] [PubMed] [Google Scholar]
- 59.Lipfert J, Doniach S. Small-angle X-ray scattering from RNA, proteins, and protein complexes. Annu Rev Biophys Biomol Struct. 2007;36:307–27. doi: 10.1146/annurev.biophys.36.040306.132655. [DOI] [PubMed] [Google Scholar]
- 60.Liang J, Dill KA. Are proteins well-packed? Biophys J. 2001;81:751–66. doi: 10.1016/S0006-3495(01)75739-6. [DOI] [PMC free article] [PubMed] [Google Scholar]
- 61.Quillin ML, Matthews BW. Accurate calculation of the density of proteins. Acta Crystallogr D Biol Crystallogr. 2000;56:791–4. doi: 10.1107/s090744490000679x. [DOI] [PubMed] [Google Scholar]
- 62.Tsai J, Taylor R, Chothia C, Gerstein M. The packing density in proteins: standard radii and volumes. J Mol Biol. 1999;290:253–66. doi: 10.1006/jmbi.1999.2829. [DOI] [PubMed] [Google Scholar]
- 63.Flory P. Principles of polymer chemistry. Cornell University Press; 1953. [Google Scholar]
- 64.Das R, Doniach S. Structural studies of proteins and nucleic acids in solution using small angle X-ray scattering (SAXS) In: Pecora R, B R, editors. Soft Matter: Scattering, Imaging and Manipulation. Springer; Berlin: 2006. [Google Scholar]
- 65.Petoukhov MV, Svergun DI. Global rigid body modeling of macromolecular complexes against small-angle scattering data. Biophys J. 2005;89:1237–50. doi: 10.1529/biophysj.105.064154. [DOI] [PMC free article] [PubMed] [Google Scholar]
- 66.Svergun DI, Barberato C, Koch MHJ. CRYSOL - a program to evaluate X-ray solution scattering of biological macromolecules from atomic coordinates. J Appl Cryst. 1995;28:768–773. [Google Scholar]
- 67.Pieper R, Luo G, Cane DE, Khosla C. Cell-free synthesis of polyketides by recombinant erythromycin polyketide synthases. Nature. 1995;378:263–6. doi: 10.1038/378263a0. [DOI] [PubMed] [Google Scholar]
- 68.Hammel M, Fierobe HP, Czjzek M, Kurkal V, Smith JC, Bayer EA, Finet S, Receveur-Brechot V. Structural basis of cellulosome efficiency explored by small angle X-ray scattering. J Biol Chem. 2005;280:38562–8. doi: 10.1074/jbc.M503168200. [DOI] [PubMed] [Google Scholar]
- 69.Svergun DI. Restoring low resolution structure of biological macromolecules from solution scattering using simulated annealing. Biophys J. 1999;76:2879–86. doi: 10.1016/S0006-3495(99)77443-6. [DOI] [PMC free article] [PubMed] [Google Scholar]
- 70.Rambo RP, Tainer JA. Bridging the solution divide: comprehensive structural analyses of dynamic RNA, DNA, and protein assemblies by small-angle X-ray scattering. Curr Opin Struct Biol. 2010;20:128–37. doi: 10.1016/j.sbi.2009.12.015. [DOI] [PMC free article] [PubMed] [Google Scholar]
- 71.Lowry B, Robbins T, Weng CH, O'Brien RV, Cane DE, Khosla C. In vitro reconstitution and analysis of the 6-deoxyerythronolide B synthase. J Am Chem Soc. 2013;135:16809–12. doi: 10.1021/ja409048k. [DOI] [PMC free article] [PubMed] [Google Scholar]
- 72.Jenke-Kodama H, Borner T, Dittmann E. Natural biocombinatorics in the polyketide synthase genes of the actinobacterium Streptomyces avermitilis. PLoS Comput Biol. 2006;2:e132. doi: 10.1371/journal.pcbi.0020132. [DOI] [PMC free article] [PubMed] [Google Scholar]
- 73.Jenke-Kodama H, Dittmann E. Evolution of metabolic diversity: insights from microbial polyketide synthases. Phytochemistry. 2009;70:1858–66. doi: 10.1016/j.phytochem.2009.05.021. [DOI] [PubMed] [Google Scholar]
- 74.Fischbach MA, Walsh CT, Clardy J. The evolution of gene collectives: How natural selection drives chemical innovation. Proc Natl Acad Sci U S A. 2008;105:4601–8. doi: 10.1073/pnas.0709132105. [DOI] [PMC free article] [PubMed] [Google Scholar]
- 75.Zucko J, Long PF, Hranueli D, Cullum J. Horizontal gene transfer and gene conversion drive evolution of modular polyketide synthases. J Ind Microbiol Biotechnol. 2012;39:1541–7. doi: 10.1007/s10295-012-1149-2. [DOI] [PubMed] [Google Scholar]
- 76.Starcevic A, Diminic J, Zucko J, Elbekali M, Schlosser T, Lisfi M, Vukelic A, Long PF, Hranueli D, Cullum J. A novel docking domain interface model predicting recombination between homoeologous modular biosynthetic gene clusters. J Ind Microbiol Biotechnol. 2011;38:1295–304. doi: 10.1007/s10295-010-0909-0. [DOI] [PubMed] [Google Scholar]
- 77.Doroghazi JR, Buckley DH. Widespread homologous recombination within and between Streptomyces species. ISME J. 2010;4:1136–43. doi: 10.1038/ismej.2010.45. [DOI] [PubMed] [Google Scholar]
- 78.Chen AY, Cane DE, Khosla C. Structure-based dissociation of a type I polyketide synthase module. Chem Biol. 2007;14:784–92. doi: 10.1016/j.chembiol.2007.05.015. [DOI] [PMC free article] [PubMed] [Google Scholar]
- 79.Pfeifer BA, Admiraal SJ, Gramajo H, Cane DE, Khosla C. Biosynthesis of complex polyketides in a metabolically engineered strain of E. coli. Science. 2001;291:1790–2. doi: 10.1126/science.1058092. [DOI] [PubMed] [Google Scholar]
- 80.Smolsky IL, L P, Niebuhr M, Ito K, Weiss T, Tsuruta H. Biological small-angle X-ray scattering facility at the Stanford Synchrotron Radiation Lightsource. J Appl Cryst. 2007;40:s453–s458. [Google Scholar]
- 81.Huang TC, T H, Blanton TN, Wu Y. X-ray powder diffraction analysis of silver behenate, a possible low-angle diffraction standard. J Appl Cryst. 1993;26:180–184. [Google Scholar]
- 82.West AL, Evans SE, Gonzalez JM, Carter LG, Tsuruta H, Pozharski E, Michel SL. Ni(II) coordination to mixed sites modulates DNA binding of HpNikR via a long-range effect. Proc Natl Acad Sci U S A. 2012;109:5633–8. doi: 10.1073/pnas.1120283109. [DOI] [PMC free article] [PubMed] [Google Scholar]
- 83.McPhillips TM, McPhillips SE, Chiu HJ, Cohen AE, Deacon AM, Ellis PJ, Garman E, Gonzalez A, Sauter NK, Phizackerley RP, Soltis SM, Kuhn P. Blu-Ice and the Distributed Control System: software for data acquisition and instrument control at macromolecular crystallography beamlines. J Synchrotron Radiat. 2002;9:401–6. doi: 10.1107/s0909049502015170. [DOI] [PubMed] [Google Scholar]
- 84.Martel A, Liu P, Weiss TM, Niebuhr M, Tsuruta H. An integrated high-throughput data acquisition system for biological solution X-ray scattering studies. J Synchrotron Radiat. 2012;19:431–4. doi: 10.1107/S0909049512008072. [DOI] [PMC free article] [PubMed] [Google Scholar]
- 85.Konarev PV, V V, Sokolova AV, Koch MH, Svergun DI. PRIMUS - a Windows-PC based system for small-angle scattering data analysis. J Appl Cryst. 2003;36:1277–1282. [Google Scholar]
- 86.Svergun DI. Determination of the regularization parameter in indirect-transform methods using perceptual criteria. J Appl Cryst. 1992;25:495–503. [Google Scholar]
- 87.Classen S, Hura GL, Holton JM, Rambo RP, Rodic I, McGuire PJ, Dyer K, Hammel M, Meigs G, Frankel KA, Tainer JA. Implementation and performance of SIBYLS: a dual endstation small-angle X-ray scattering and macromolecular crystallography beamline at the Advanced Light Source. J Appl Crystallogr. 2013;46:1–13. doi: 10.1107/S0021889812048698. [DOI] [PMC free article] [PubMed] [Google Scholar]
- 88.Pettersen EF, Goddard TD, Huang CC, Couch GS, Greenblatt DM, Meng EC, Ferrin TE. UCSF Chimera--a visualization system for exploratory research and analysis. J Comput Chem. 2004;25:1605–12. doi: 10.1002/jcc.20084. [DOI] [PubMed] [Google Scholar]
- 89.Rambo RP, Tainer JA. Accurate assessment of mass, models and resolution by small-angle scattering. Nature. 2013;496:477–81. doi: 10.1038/nature12070. [DOI] [PMC free article] [PubMed] [Google Scholar]
Associated Data
This section collects any data citations, data availability statements, or supplementary materials included in this article.