

Abstract
Background
Rapid point-of-care tests provide plausible diagnostic strategy for hepatitis B surface antigen (HBsAg) in low resource areas. However, their utility depends upon their overall performance. Our objective was to meta-analyze the diagnostic accuracy of rapid point-of-care tests for HBsAg.
Methods
Literature search was done with the help of a metasearch engine Mettā, a query interface for retrieving articles from five leading medical databases. Studies that employed rapid point-of-care tests for detection of HBsAg and compared the results with reference test were included. Two reviewers performed quality assessment of the studies and extracted data for estimating test accuracy. Twenty-seven studies were meta-analyzed and stratified by multiple parameters.
Results
Twenty-seven studies had evaluated 49 test brands and generated 76 data points. Sensitivity of individual tests varied widely and were heterogeneous (range 43.5%–99.8%); while specificity estimates were more robust and close to 100% (range 90%–100%). Overall pooled sensitivity, specificity, positive likelihood ratio (LR), negative LR and diagnostic odds ratio for all tests were 97.1% (95% CI, 96.1%–97.9%), 99.9% (CI, 99.8%–100%), 118.4 (CI, 84.7–165.5), 0.032 (CI, 0.023–0.045) and 4094.7 (CI, 2504.1–6600.8) respectively. This suggested high pooled accuracy for all studies. We found substantial heterogeneity between studies. Three factors (study location, reference standard and study score) appeared most strongly associated with test estimates and observed heterogeneity. The Determine test showed consistency in performance in studies done across developed and developing countries and the Determine and the BinaxNOW tests had significantly higher estimates than pooled estimates of remaining tests. Tests revealed analytical sensitivity of 4 IU/ml against manufacturer's claim of 0.5 IU/ml; reduced sensitivity with HBsAg mutants and poor performance in seroconversion panels.
Conclusions
Tests with better analytical sensitivity need to be developed and their feasibility and outcomes in various clinical settings need to be addressed.
Keywords: HBsAg, rapid test, performance evaluation, meta-analysis
Abbreviations: DOR, diagnostic odds ratio; EIA, enzyme immunoassay; ELISA, enzyme-linked immunosorbent assay; HBsAg, hepatitis B surface antigen; HSROC, hierarchical summary receiver operating characteristic; LR, likelihood ratio; MEIA, micro-particle enzyme immunoassay; PCR, polymerase chain reaction; PRISMA, preferred reporting items for systematic reviews and meta-analysis; QUADAS, quality assessment of diagnostic accuracy of studies; RPOCTs, rapid point-of-care tests; SROC, summary receiver operating characteristic; STARD, standard for reporting diagnostic accuracy studies
Hepatitis B infection is a global health problem.1 There are more than 350 million carriers of hepatitis B virus (HBV) in the world today, with addition of 4 million acute infections every year. Around one million die annually from hepatitis B-associated liver disease including hepatocellular carcinoma. Majority of HBV (over 75%) infections occur in high endemic regions namely Southeast Asia and Africa, with lifetime risk of infection from 60% to 80%. Areas of intermediate risk include parts of southern and Eastern Europe, the Middle East, and the Indian subcontinent with a lifetime risk of infection from 20% to 60%. In the United States, around 1.25 million individuals are chronically infected with HBV with an estimated 78,000 cases of new HBV infections occurring yearly, mostly among sexually active young adults, black and Hispanic people and IV drug users. Within this context, diagnosis of HBV infection, initiation of treatment, and prevention of transmission to susceptible population is a priority.2
Hepatitis B surface antigen (HBsAg) is the serologic hallmark of HBV infection and has been the principal target for laboratory testing to identify active infection by HBV.3,4 Additional serologic and molecular tests need to be done depending upon the setting and purpose of HBV testing.5 HBsAg is typically detected by a sensitive immunoassays that uses antibody to hepatitis B surface antigen (anti-HBs) to capture antigen in the sample. Although immunoassays effectively detect HBsAg, the tests have many limitations in poor resource endemic regions of the world. These include high facility cost, need for sophisticated equipment and trained technicians, continuous supply of electricity, and long turnaround times. Point-of-care testing offers significant advantages which include reduction of facility costs, rapid delivery of results, early diagnosis and rapid initiation of treatment.6–8
Since 1990s, several rapid point-of-care tests (RPOCTs) that primarily use blood samples to test for HBsAg have been developed.9 The manufacturers claim high accuracy and utility of their respective tests. However, several vital questions about their use remain unanswered namely accuracy of individual tests, comparative efficacy of the different tests, and applicability of these tests in different scenarios of HBV evaluation.
A recent meta-analysis on accuracy of RPOCTs for HBsAg attempted to address the above mentioned questions.10 However, this study had many limitations. Two well-conducted major studies done on accuracy of RPOCTs and available by then were not included in the meta-analysis.11,12 These 2 studies had evaluated 27 tests against two international sera panels and generated 29 data points. There were errors in data entry in 2 × 2 tables. Khan et al13 while evaluating OneCheck test reported 19 of the 19 negative sera as true negative (specificity of 100%) and not as 19 false positive (specificity 0%) as shown in the study. Authors did not address the issue of inconclusive test results and how to analyze and report these data. We believe complete transparency regarding the handling of inconclusive results in the analysis phase is essential for the reader to understand how key summary statistics have been derived.14 Analytical sensitivity of the tests based on low titer and seroconversion panels performed in several included studies15–17 were not evaluated, which affected the conclusions made on the accuracy of the tests under consideration. Authors did not evaluate heterogeneity (differences in reported estimates among studies) and its potential sources, an important component in meta-analysis studies.18 We believe recommendations on use of RPOCTs can have far reaching effects on the healthcare in developing countries. For example recommending tests with low analytical sensitivity in blood banks can pose a serious threat to recipients as infected otherwise healthy donors often have low titer HBsAg viremia.19 Keeping the above in consideration, we conducted another systematic review and meta-analysis of studies pertaining to diagnostic accuracy and applicability of RPOCTs for HBsAg.
Methods
Protocol
We sought to conduct a systematic review and meta-analysis on studies which evaluated accuracy of RPOCTs for HBsAg. A protocol was written that specified several aspects of the meta-analysis (available at our website www.drkhuroo.com; Appendix Document 1) as per PRISMA (Preferred Reporting Items for Systematic Reviews and Meta-analysis) guidelines.20 Two independent reviewers made literature search, performed quality assessment of the included studies and extracted data for estimating test accuracy.21 Any discrepancies were referred to third reviewer.
Acquisition of Data
Literature search was done with the help of a metasearch engine “Mettā” which can be accessed at http://mengs1.cs.binghamton.edu/metta/search.action. Mettā is a query interface that helps systematic reviewers in retrieving, filtering and assessing articles from five leading medical databases: PubMed, EMBASE, CINAHL, PsycINFO, and the Cochrane Central Register of Controlled Trials.22 De-duplication of records returned from multiple databases is carried out in a prioritized fashion that favors retaining citations returned from PubMed. Upto several thousand retrieved records can be exported within a few minutes and the process of writing systematic reviews is accelerated. The articles can be exported in XML format for further processing by a series of other computer-based tools, or exported in BibTeX format for users who employ reference manager software.
MeSH terms used for key and text word searching included “Hepatitis B” OR “Hepatitis B Surface Antigens” AND “Point-of-Care Systems” OR “rapid test” OR “diagnostics” AND “Sensitivity and Specificity” OR “diagnostic accuracy” OR “validity”. We also searched bibliographies and reference lists of eligible papers and related reviews, consulted experts in the field, and contacted several authors from the included studies to locate additional studies. Titles and abstracts of all the above articles identified in the primary search were evaluated and a list of potential eligible studies identified. These studies were considered for full text review. Studies which fulfilled the criteria for selection were included in the systematic review and meta-analysis.
Criteria for Study Inclusion
Studies were included that employed RPOCTs for detection of HBsAg (Index test) and compared the results with a reference standard and reported results to recreate the 2 × 2 diagnostic table for estimating test accuracy. Index test was defined as any commercially available assay that identified HBsAg at or near the site of patient care. The test had to have quick turnaround time; ease of sampling, performance and reading results and no requirement of cold chain and specialized equipment. The test results are available to the patient, physician and care team within minutes, which allows for clinical management decisions to be made in the same clinical encounter.8 Acceptable reference standards included enzyme immunoassay (EIA), enzyme-linked immunosorbent assay (ELISA) or micro-particle enzyme immunoassay (MEIA) for detection of HBsAg. Additional tests (confirmatory neutralization test for HBsAg positive sera, HBsAg quantification and detection of HBV DNA) were considered to make the reference standard as perfect. We included studies conducted in adults (age > 18 years), published both as abstracts and full-text articles, using all study-designs, conducted in any study settings (laboratory or field-based) and regardless of sample size, study location, language of publication, and country of origin of test. We excluded studies which dealt with accuracy of laboratory-based tests; studies with data unable to recreate 2 × 2 diagnostic table; reports from the manufacturers and package inserts which are subjected to overt conflict of interest, and duplicate reports.
Data Extraction
Each study was subjected to following search: study author, year of publication, location of study, index test (one or more), reference standard, study design, source of sera, sample size, characteristics of the population employed for sera collection, cross reactive sera included in panel and analytical sera included for evaluating test sensitivity. Detailed information about the index test were extracted from the studies which included: name of the test, country of origin and name of the manufacturer, time taken to read results, specimen (serum, plasma or blood) needed for test, volume of the sample (μl) needed to test, storage conditions for maintaining test kit, special equipment if any needed to perform the test and shelf life of the test kit. For purposes of data synthesis we extracted raw cell numbers namely true positives, false negatives, false positive and true negatives for each test run.
Quality Assessment
We performed quality assessment of the studies using QUADAS-2 (Quality Assessment of Diagnostic Accuracy Studies) tool23 and the STARD (Standards for the Reporting of Diagnostic Accuracy Studies) checklists.24 QUADAS-2 sheet was completed by following stepwise guidelines to judge risk of bias (4 domains) and concerns about applicability (3 domains) for each study. STARD checklist consisted of 25 questions and each question was weighted equally (yes = 1, No = 0) and total score for each study calculated.
Statistical Analysis and Data Synthesis
Data was extracted to construct 2 × 2 tables (reference test results vs. index test results). We defined HBsAg positive as those with disease and HBsAg negative as those without disease based on the reference test results. Index test results were reported as true positive, false positive, false negative and true negative. To maintain transparency of the test results reporting, we searched for inconclusive index test results. We believe inconclusive test results should be analyzed depending on how these patients would be treated in the clinical context. For the present meta-analysis all valid inconclusive index test results were clubbed with either false negative results (sera which were HBsAg positive by reference test and inconclusive by index test) or false positive results (sera which were HBsAg negative by reference test and inconclusive by index test) (Appendix Document 2).14
For estimates of accuracy we calculated sensitivity & specificity, positive & negative likelihood ratio (LR) and diagnostic odds ratio (DOR) along with 95 percent confidence intervals (CIs) (see Appendix Document 2). Sensitivity of a test is defined as the probability that the index test result will be positive in a case with disease. Specificity of a test is defined as the probability that the index test result will be negative in a non-diseased case. Both Sensitivity, & Specificity were expressed as percentages. LR is used to update the pre-test probability of disease using Bayes' theorem, once the test result is known. The updated probability is referred to as the post-test probability. For a test that is informative, the post-test probability should be higher than the pre-test probability if the test result is positive, whereas the post-test probability should be lower than the pre-test probability if the test result is negative. Positive LR of >10 and negative LR of <0.1 gives conclusive evidence of test accuracy. DOR, commonly considered a global measure of test performance, was estimated by the ratio of the odds of a positive test result in a diseased subjects to odds of a positive test result in a non-diseased subjects. DOR describes how many times higher the odds are of obtaining a test positive result in a diseased rather than a non-diseased person. DORs summarizes test accuracy in a single number and makes it easy to use this in subgroup/meta-regression model to derive statistical values.
We pooled test estimates using a bivariate random-effects regression model.25 The bivariate model takes in to consideration the potential tradeoff between sensitivity and specificity by explicitly incorporating this negative correlation in the analysis. The model was used to draw hierarchical summary-operating characteristic (HSROC) curves. The curve of a test is the graph of the values of sensitivity and specificity that are obtained by varying the positivity threshold across all possible values. The graph plots sensitivity (true-positive rate) against 1–specificity (false-positive rate). The shape of the curve between these two fixed points depends on the discriminatory ability of the test. The closer the curve is to the upper left hand corner of the curve plot, the better the overall accuracy of the test.
Heterogeneity in meta-analysis refers to the degree of variability in the results across studies.26 Diagnostic accuracy studies are expected to show considerable heterogeneity and models used are by default random-effects models, taking in to account study variation as well as chance variation. To detect heterogeneity test estimates were graphically displayed using forest plots and overlap in the confidence intervals of individual studies compared. Poor overlap suggested statistical heterogeneity. Q test for heterogeneity with P value was calculated. A large Q value with P < 0.10 (rather than conventional 0.05) suggested heterogeneity. Finally the inconsistency index (I2) test was calculated. We regarded values of ≤25%, >25–50%, >50–75% and >75% as low, moderate, substantial and considerable statistical heterogeneity, respectively (See Appendix Document 2).
To investigate the sources of heterogeneity the following variables were selected a priori as potential sources of heterogeneity: year of publication (prior vs. after 2005), location of study (developed vs. developing countries), reference standard (EIA alone vs. EIA with neutralization test or nucleic acid test), study design (cross sectional vs. case control), source of sera (blood banks vs. hospitals/clinics), cross reactive sera (included vs. not included in sera panel) and study quality (high >15 vs. low ≤15 STARD score). Summary estimates for each covariate were generated, along with their 95% CIs and compared in the meta-regression model. A P value below 0.05 for DORs was defined as significant difference among the levels of particular covariate. Because the effects of some of the covariates may influence each other, multivariate meta-regression was also done to take in to account the possible interrelations among the variables.27
In order to compare relative efficacy of tests, we appreciated the studies had included different test brands and assays were conducted in different study populations and under varied laboratory conditions. Consequent to this, the accuracy of different assays varied markedly within and between different tests. To overcome this, the studies were stratified in to 2 subgroups based on location where studies had been performed (developed vs. developing countries). Pooled estimates of tests that had acquired ≥3 data points (Determine, Hepacard, BinaxNOW, Genedia, and SD) were calculated across and within the 2 subgroups and compared in the meta-regression model.
We did all statistical analysis in Meta-Analyst (Tufts Medical Centre, Boston, MA).28
Results
Literature Search
We identified 29 articles eligible for inclusion (Figure 1).11–13,15–17,29–51 Data from 2 studies had duplicate publications. Official report of International Consortium for Blood Safety 2007 (ICBS,12) was published as a full-text paper in a peer-reviewed journal.47 Sera from another study were collected and tested in Malawi44 and had shown conflicting results. The same sera were retested in UK and results published as a full-text paper in a peer-reviewed journal.47 Consequent to this we excluded 2 studies from further analysis.44,47 Of the 27 studies, 24 were published as full-length manuscripts in peer-reviewed journals, two studies were published as official reports of WHO & ICBS11,12 and two studies were reported as conference abstracts.29,33 There was unanimity between the authors about the selection of relevant articles.
Figure 1.
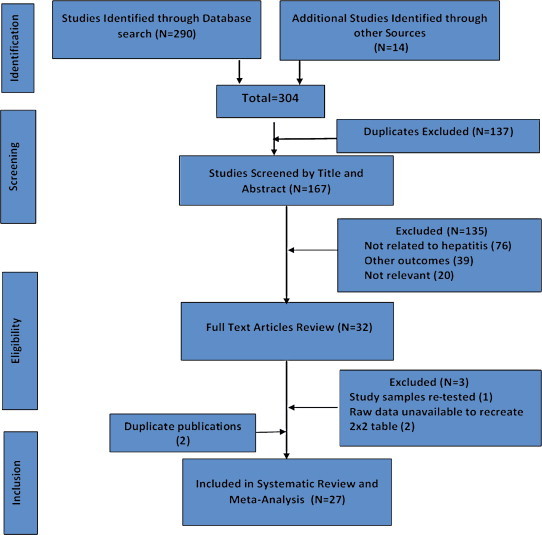
Flow diagram of study selection.
Study Characteristics
Table 1 shows the study characteristics. Of the 27 studies, 20 were conducted in developing countries and 14 were case-control. Source of sera were from blood banks in 7 studies, hospitals and medical/surgical clinics in 13 studies, and from unknown source in 7 studies. Four studies had included cross reactive sera in sera panels.35,37,46,50 Four studies had described patient's characteristics.11,16,40,50 Sample size varied from 25 to 3956. For defining analytical sensitivity of the tests, 5 studies employed low titer sera panels11,12,15–17 and 1 included seroconversion sera panels.11 None of the studies had included sera from general population, patients with acute hepatitis syndrome, fulminant hepatic failure or HBV infected patients on antiviral therapy.
Table 1.
Characteristics of the 27 Studiesa.
| Author (Reference) | Year | Location | Index test | Reference standard | Study design | Source | Size | Patient population | CRSb | Analytical analysis |
|---|---|---|---|---|---|---|---|---|---|---|
| Nakata29 | 1990 | NK | Hybritch | EIA | Cross sectional | Prison inmates | 300 | NK | No | No |
| Sato15 | 1996 | Japan | Dainascreen | EIA | Case control | Hospital samples | 462 | NK | NK | Yes; Dainabot panel |
| Mvere30 | 1996 | Zimbabwe | SimpliRed, Dipstick (PATH) | EIA | Cross sectional | Blood Bank | 206 | NK | No | No |
| Abraham31 | 1998 | India | Virucheck, QuickChaser | ELISA | Cross sectional | NK | 400 | NK | No | No |
| Oh32 | 1999 | Korea | Genedia | EIA | Case control | Blood donors | 250 | NK | NK | No |
| Palmer33 | 2000 | Honduras, Dominican Republic Trinidad, Jamaica | Determine | EIA | Case control | NK | 298 | NK | No | No |
| Kaur34 | 2000 | India | Hepacard | EIA | Cross sectional | Hospital samples | 2754 | NK | Nil | No |
| Lien35 | 2000 | Vietnam | Dainascreen, Determine, Serodia | EIA | Case control | High risk volunteers | 328 | NK | Yes, 128 sera | No |
| WHO11 | 2001 | Global | Ten testsg | EIAc | Serum panel study (Case control) | Africa, Asia, Europe, Latin America | 277 | Well described | No | Low titer panel, Seroconversion panel |
| Raj36 | 2001 | India | Hepacard | EIA/MEIA | Cross sectional | Hospital samples | 1000 | NK | No | No |
| Clement16 | 2002 | Belgium | BinaxNOW | MEIA | Cross sectional | Hospital samples | 942 | Chronic hepatitis | No | in-house standards sera panel |
| Lau37 | 2003 | USA | BinaxNOW | EIA | Cross sectional | Criminals, Hepatology clinic, Health fair, | 2463 | NK | Fresh & frozen sera | No |
| Whang38 | 2005 | Korea | Daewoong, Genedia | MEIA | Case control | NK | 200 | NK | No | No |
| Cha39 | 2006 | Korea | Asan, Genedia, SD | MEIA | Case Control | NK | 40 | NK | No | No |
| Akanmu40 | 2006 | Nigeria | Binax Now | ELISA | Cross sectional | Donors | 101 | HBV carriers | No | No |
| Ansari41 | 2007 | Iran | 6 testsh | EIA/PCR | Case control | Hospital Patients | 240 | NK | No | No |
| ICBS12 | 2007 | Global | 19 testsi | ICBS panel testingf | Serum panel study (Case control) | ICBS master panelf | 346 | NK | No | ICBS Quantitative panel |
| Lin17 | 2008 | China, Guinea | Determine, DRW | EIA | Case Control | Blood donors (Stanford & Ghana) | 1250 | NK | No | WHO sera, Seroconversion panel |
| Randrianirina42 | 2008 | Madagascar | Cypress, Determine, Hexagon, Virucheck | EIA | Case control | NK | 200 | NK | No | No |
| Torane43 | 2008 | India | Hepacard | ELISA | Case control | Blood bank | 60 | NK | No | No |
| Ola45 | 2009 | Nigeria | GWHB | ELISA | Cross sectional | Medical clinic | 25 | NK | No | No |
| Davies46 | 2010 | Malawie | Determine | EIAc | Cross sectional | HIV clinic | 75 | NK | HIV | No |
| Khan13 | 2010 | Pakistan | OneCheck, Accurate | ELISA | Case control | NK | 57 | NK | No | No |
| Maity48 | 2012 | India | Hepacard, Span, SD | ELISAc | Case control | NK | 100 | NK | No | No |
| Bottero49 | 2013 | France | Determine, QuickProfile VIKIA | ELISAd | Cross sectional | Health care centers | 3956 | NK | No | No |
| Franzeck50 | 2013 | Tanzania | Determine | EIA | Cross sectional | HIV Clinic | 272 | Chronic carriers | HIV | No |
| Chemeera51 | 2013 | Sri Lanka | Cortez Onsite | EIA | Cross sectional | Hospital samples | 50 | NK | No | No |
NK = Not known or not specified in the report, EIA = Enzyme immunoassay, MEIA = Micro-particle enzyme immunoassay, ELISA = Enzyme-Linked Immunosorbent Assay, PCR = Polymerase Chain Reaction.
2 studies44,47 were excluded for duplicate publications.
CRS = Cross reactive sera included in serum panel.
Neutralization test for all positive sera performed.
All positive sera had HBsAg quantification and HBV DNA quantification.
Sera collected in Malawi and tested in UK.
ICBS clinical master panel sera were collected in blood banks from diverse regions of world and have been extensively analyzed by serology, HBV DNA, HBV genotyping, HBV subtyping and sequencing.
WHO 10 tests: 1. Advanced, 2. Determine, 3. DoubleCheck, 4. Genedia, 5. HEP B STAT-PAK, 6. Hepacard, 7. Immunocomb II, 8. Rapid, 9. Serodia, 10. Unigold.
Ansari 6 tests: 1. Acon; 2. Atlas; 3. Intec, 4. Blue Cross, 5. DIMA, 6. Cortex.
ICBS 19 tests: 1. Acon, 2. Assure, 3. Bioline, 4. Cassette, 5. Cypress, 6. Determine, 7. Equipar, 8. HBsAg (WB), 9. Hepacard, 10. Hep-Alert-B, 11. HepaScan, 12. Hep-Check-1 Miniclip, 13. Hep-Check-1 Strip, 14. i + LAB, 15. Line test, 16. Newmarket, 17. QuickChaser, 18. QuickTest, 19. SD.
Appendix Table 1 lists the index test characteristics. Twenty-seven studies had used 49 test brands and generated 76 data points. A single data point was generated for 37 tests; 2 data points for 7 test brands (Dianascreen, ViruCheck, QuickChaser, Serodia, Cortez, Cypress & Acon), 3 data points for 2 test brands (BinaxNow, SD); 4, 6 and 9 data points for one test brand each (Genedia, Hepacard and Determine respectively). Reference standard in all studies was detection of HBsAg either by EIA, MEIA or ELISA. Neutralization test for HBsAg (CDC guideline for HBsAg testing by EIA), HBsAg quantification or molecular testing for HBV were employed in only 6 studies.11,12,41,46,48,49 All the studies administered the same reference test to all patients, thus avoiding partial or differential verification bias.
Study Quality
QUADAS-2 sheet shows major risk of bias in patient selection and index test (Table 2). Bias in patient selection resulted from: i) case-control study design, ii) poor description of patient's selection and clinical scenario. Bias in index test was mostly related to lack of reporting blinding while reading test results. The quality of study reporting ranged from poor to good (STARD scores from 8 to 23 of 25), with a number of items missing from reporting of diagnostic accuracy.
Table 2.
QUADAS-2 Assessments and STARD Scores.
| Author (Reference) |
QUADAS-2 sheet |
STARD |
||||||
|---|---|---|---|---|---|---|---|---|
| Patient selection |
Index test |
Reference standard |
Flow & timing |
Score |
||||
| Risk of bias | Concern about applicability | Risk of bias | Concern about applicability | Risk of bias | Concern about applicability | Risk of bias | Total 25 | |
| Nakata29 | Published as an abstract; data insufficient for evaluation | |||||||
| Sato15 | UC | UC | HR | LR | LR | LR | LR | 10 |
| Mvere30 | LR | LR | LR | LR | LR | LR | LR | 13 |
| Abraham31 | HR | LR | LR | LR | LR | LR | LR | 9 |
| Oh32 | UC | LR | HR | LR | LR | LR | LR | 9 |
| Palmer33 | Published as an abstract; data insufficient for evaluation | |||||||
| Kaur34 | LR | LR | HR | LR | LR | LR | LR | 11 |
| Lien35 | LR | LR | HR | LR | LR | LR | LR | 19 |
| WHO11 | LR | LR | LR | LR | LR | LR | LR | 24 |
| Raj36 | HR | LR | HR | LR | LR | LR | LR | 9 |
| Clement16 | LR | LR | HR | LR | LR | LR | LR | 17 |
| Lau37 | LR | LR | HR | LR | LR | LR | LR | 10 |
| Whang38 | HR | LR | HR | LR | LR | LR | LR | 10 |
| Cha39 | HR | LR | HR | LR | LR | LR | LR | 10 |
| Akanmu40 | HR | LR | HR | LR | LR | LR | LR | 15 |
| Ansari41 | HR | LR | HR | LR | LR | LR | LR | 12 |
| ICBS12 | LR | LR | LR | LR | LR | LR | LR | 23 |
| Lin17 | UC | LR | HR | LR | LR | LR | LR | 11 |
| Randrianirina42 | HR | LR | HR | LR | LR | LR | LR | 9 |
| Torane43 | HR | LR | HR | LR | LR | LR | LR | 8 |
| Ola45 | UC | LR | HR | LR | LR | LR | LR | 9 |
| Davies46 | HR | LR | LR | LR | LR | LR | LR | 18 |
| Khan13 | HR | LR | LR | LR | LR | LR | LR | 14 |
| Maity48 | HR | LR | HR | LR | LR | LR | LR | 14 |
| Bottero49 | LR | LR | HR | LR | LR | LR | LR | 13 |
| Franzeck50 | LR | LR | LR | LR | LR | LR | LR | 20 |
| Chemeera51 | LR | LR | HR | LR | LR | LR | LR | 14 |
LR = low risk, HR = high risk, UC = unclear.
Conflict of Interest
Two studies reported a financial relationship with or received funding from the industry,17,35 3 explicitly declared no conflict of interest,37,42,46 and 2 were independent evaluation by International Organizations.11,12 Most remaining studies omitted disclosure of conflict of interest.
Test Accuracy
Figure 2 reports on the estimates of sensitivity & specificity with 95% confidence intervals and related Forest plots stratified by type of test brand. Sensitivity of individual tests varied widely and were heterogeneous (range 43.5%–99.8%); while specificity estimates were more robust and close to 100% (range 90%–100%). Overall pooled sensitivity, specificity, positive LR, negative LR and DORs for all tests were 97.1% (95% CI, 96.1%–97.9%), 99.9% (CI, 99.8%–100%), 118.4 (CI, 84.7–165.5), 0.032 (CI, 0.023–0.045) and 4094.7 (CI, 2504.1–6600.8) respectively. This suggested high pooled accuracy for all studies. The ROC curve also indicated high sensitivity with a high specificity as the curve approached the upper left hand corner of the graph where sensitivity is 1 and specificity is 1 (Appendix Figure 1).
Figure 2.
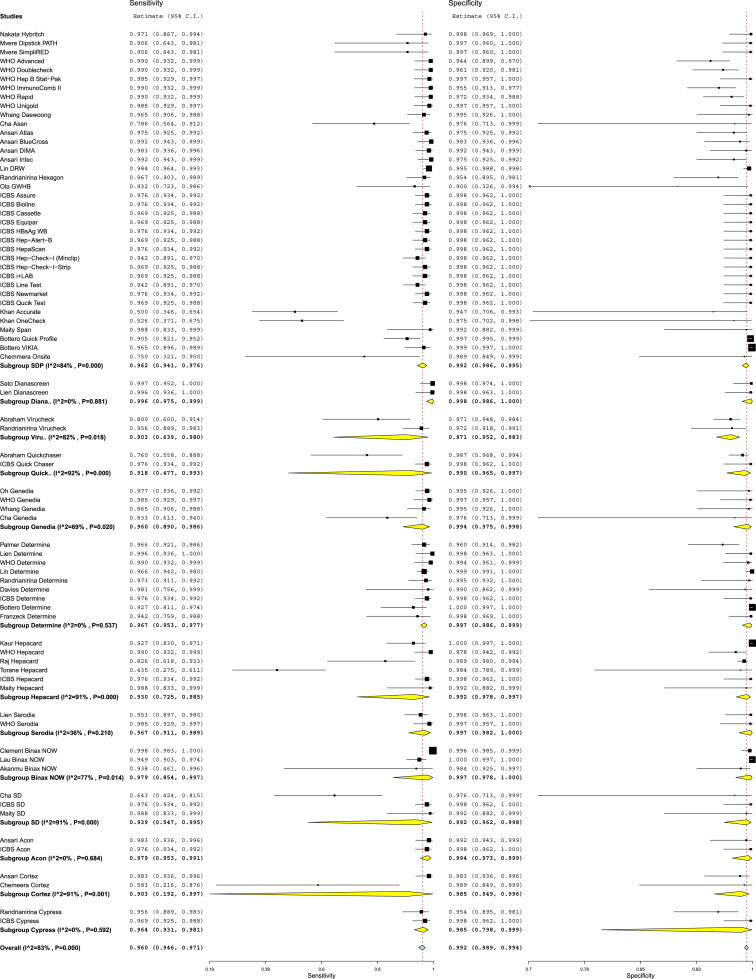
Forest plot of the sensitivity and specificity estimates and 95% confidence intervals (CIs) of 27 studies stratified by test brands. 37 test brands had generated single data point each (subgroup SDP) while 12 test brands had generated ≥2 data points each. Estimates of sensitivity and specificity from each study are shown as solid squares. Solid lines represent the 95% CIs. Squares are proportional to the weights based on the random effect model. Pooled estimates and 95% CIs is denoted by the diamond at the bottom. I2 and p values represents heterogeneity of studies.
We found substantial heterogeneity between studies when calculating the pooled sensitivity (I2 = 83%), specificity (I2 = 83%), positive LR (I2 = 64%), negative LR (I2 = 66%) and DORs (I2 = 66). Multiple covariates were used in subgroup analysis and tested statistically in meta-regression model to find out the reason/s of heterogeneity (Table 3). Three factors (location of study, reference standard and study score) appeared most strongly associated with test estimates and observed heterogeneity. In contrast study year (studies before & after 1995), study design (case control vs. cross sectional studies), source of sera (blood banks vs. hospital/clinics) and cross reactive sera (presence or absence of cross reactive sera in panels) had no significant effect on test performance and heterogeneity. Studies conducted in developed and developing countries both revealed high pooled accuracy values; however DORs were 4.5 times higher in studies conducted in the developed than in developing countries (DORs 9812.7 [CI, 6467.3–14888.7] vs. 1467.7 [CI, 762.8–2824.1] respectively; P ≤ 0.001) (Figure 3). Studies conducted in developed countries had minimal heterogeneity (I2 = 0%), while those in developing countries showed substantial heterogeneity (I2 = 69%). Studies which used additional neutralization test with or without nucleic acid testing as a reference standard had higher DORs than studies which used enzyme immunoassays alone (DORs 7179.6 [CI, 4901.5–10497.3] vs. 1663.7 [CI, 745.3–3714.0] respectively; P < 0.001) and were less heterogeneous (I2 = 0% vs. 76% respectively) (Appendix Figure 2). On a similar note, studies with STARD score of >15 had higher DORs than those with STARD score ≤15 (DORs 10414.9 [6464.8–16778.6] vs. 1838.4 [915.8–3690.2] respectively; P < 0.001) and were less heterogeneous [I2 = 0% vs. 74%] respectively) (Appendix Figure 3). We performed multivariate meta-regression to take in to account the interrelations among these 3 variables associated with test estimates and heterogeneity. Study location was the only variable which was significantly associated with test estimates and heterogeneity (Appendix Table 2).
Table 3.
Accuracy Estimates from Subgroup Analysis.
| Variable | Subgroups (no of studies/data points) | Pooled sensitivity (95% CI), % | Pooled specificity (95% CI), % | Positive LR (95% CI) | Negative LR (95% CI) | DOR (95% CI) | I2¥ | p Valuea |
|---|---|---|---|---|---|---|---|---|
| All studies | 27 studies/76 data points | 97.1 (96.1–97.9) | 99.9 (99.8–100) | 118.4 (84.7–165.5) | 0.032 (0.023–0.045) | 4094.7 (2504.1–6600.8) | 66% | – |
| Abstracts excluded | 25 full text studies/74 data points | 97.1 (96.0–97.9) | 99.9 (99.8–100) | 126.6 (90.2–177.8) | 0.03 (0.02–0.04) | 4327.2 (2753.2–6800.9) | 66% | – |
| Year | Prior 2005 (12/25) | 97.1 (95.2–98.2) | 99.0 (98.4–99.4) | 93.4 (56.8–153.6) | 0.023 (0.012–0.044) | 5931.9 (2393.4–14703.4) | 74% | Reference |
| After 2005 (15/51) | 95.4 (91.1–97.5) | 99.3 (98.9–99.5) | 129.1 (84.4–196.1) | 0.038 (0.029–0.050) | 3501.5 (2016.6–6079.2) | 59% | 0.39 | |
| Location of Testb | Developing Countries (20/39) | 94.3 (89.8–96.4) | 99.1 (98.4–99.5) | 72.2 (48.4–109.3) | 0.049 (0.032–0.077) | 1467.7 (762.8–2824.1) | 69% | Reference |
| Developed Countries (6/36) | 97.0 (96.2–97.7) | 99.4 (99.0–99.6) | 193.5 (115.8–323.6) | 0.018 (0.012–0.036) | 9812.7 (6467.3.0–14888.7) | 0% | <0.001 | |
| Reference Test | EIA/ELISA/MEIA alone (21/34) | 94.1 (90.6–96.3) | 98.9 (98.4–99.3) | 82.9 (55.5–123.7) | 0.060 (0.037–0.098) | 1663.7 (745.3–3714.0) | 76% | Reference |
| Neutralization/NAT test (6/42) | 97.0 (96.4–97.5) | 99.5 (99.1–99.7) | 185.5 (104.5–329.2) | 0.018 (0.014–0.023) | 7179.6 (4901.5–10497.3) | 0% | <0.001 | |
| Study design | Cross sectional (13/18) | 95.4 (93.3–96.8) | 99.3 (98.8–99.8) | 129.9 (84.9–196.7) | 0.078 (0.043–0.140) | 3111.7 (984.6–9833.7) | 81% | Reference |
| Case control (14/58) | 97.1 (95.2–98.2) | 99.0 (98.4–99.4) | 93.9 (56.4–153.2) | 0.021 (0.016–0.026) | 4373.0 (2656.9–7197.7) | 54% | 0.63 | |
| Source of serac | Hospital/Clinics (13/23) | 96.2 (94.0–97.6) | 99.5 (99.1–99.7) | 188.0 (103.1–344.0) | 0.027 (0.014–0.60) | 7052.4 (3063.5–16238.3) | 64% | Reference |
| Blood Banks (7/36) | 97.1 (95.9–97.9) | 99.4 (99.0–99.6) | 157.2 (94.9–260.4) | 0.015 (0.012–0.020) | 9974.1 (5115.8–12429.4) | 0% | 0.36 | |
| CRS¥ | No CRS¥ (23/70) | 95.9 (94.4–97.1) | 99.1 (98.8–99.4) | 107.6 (76.6–151.2) | 0.033 (0.024–0.047) | 3619.5 (2217–5908.4) | 66% | Reference |
| HIV Clinics with CRS¥ (4/6) | 96.2 (93.1–97.9) | 99.8 (99.4–99.9) | 493.6 (1594.7-1527.9) | 0.019 (0.006–0.059) | 24709.4 (6264.0–97467.0) | 0% | 0.18 | |
| Score | ≤15 (19/39) | 93.7 (89.9–96.2) | 99.0 (98.5–99.4) | 91.5 (58.6–142.8) | 0.053 (0.035–0.081) | 1838.4 (915.8–3690.2) | 74% | Reference |
| >15 (6/35) | 97.0 (96.5–97.5) | 99.5 (99.1–99.7) | 185.2 (107.8–318.3) | 0.012 (0.009–0.016) | 10414.9 (6464.8–16778.6) | 0% | <0.001 |
LR = Likelihood ratio, DOR = Diagnostic Odds Ratio, I2¥ = inconsistency index test for heterogeneity (<25 = low, >25–50% = moderate; >50–75% = substantial & >75% = considerable statistical heterogeneity), CRS¥ = cross reactive sera.
p Value determined from meta-regression model.
Location of one study (Reference 29) not known.
Source of sera of 7 studies (Ref 20, 22, 29, 30, 34, 40, 41) not known.
Figure 3.
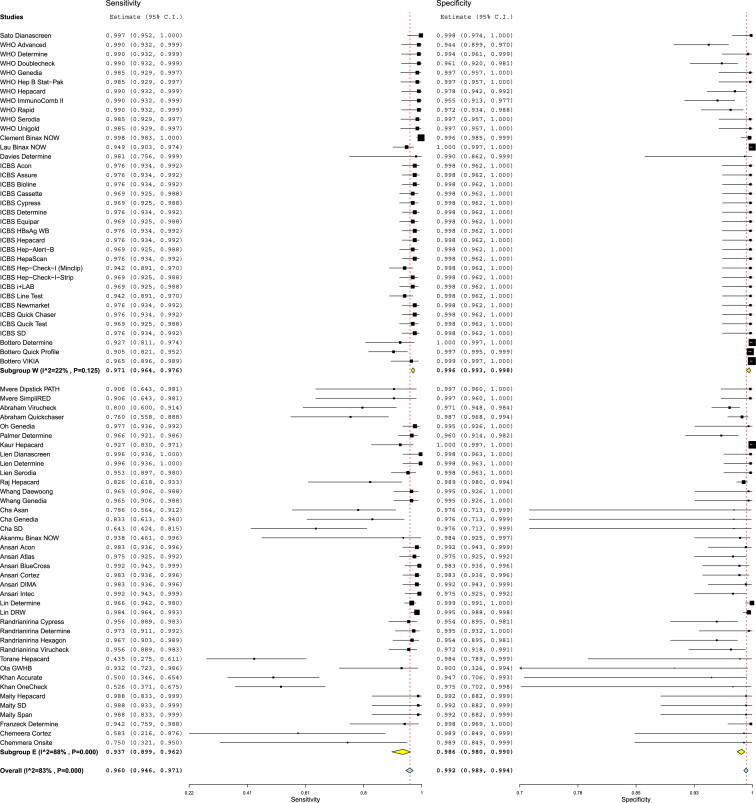
Forest plot of the sensitivity and specificity estimates and 95% confidence intervals (CIs) stratified by study location. 7 studies generating 36 data points were conducted in developed countries (Subgroup W) and 19 studies generating 39 data points were conducted in developing countries (Subgroup E). Estimates of sensitivity and specificity from each study are shown as solid squares. Solid lines represent the 95% CIs. Squares are proportional to the weights based on the random effect model. Pooled estimates and 95% CIs is denoted by the diamond at the bottom. I2 and p values represents heterogeneity of studies.
Comparative accuracy of test brands was a complex issue. Five test brands with sufficient data points (≥3) (Determine, Hepacard, Genedia, BinaxNow, and SD) showed grossly heterogeneous pooled estimates (I2 = 59%, 75%, 42%, 66% and 73% respectively) (Appendix Figure 4). Next we pooled estimates of these 5 test brands separately for developed and developing countries. Pooled estimates of all test brands showed minimal heterogeneity for studies done in developed countries (I2 for Determine 0%, Hepacard 0% and BinaxNow 0% respectively) (Appendix Figure 5) and substantial for studies done in developing countries (I2 for Determine 70%, Hepacard 80%, Genedia 43% and SD 74% respectively) (Appendix Figure 6). Accuracy estimates of all the 5 test brands were 2.3–4.3 times higher in studies done in developed vs. developing countries. Determine test estimates were consistent and revealed high sensitivity (98.0 [95.1–99.2] vs. 96.7 [95.1–97.8] respectively) and specificity (98.9 [CI, 92.1–99.9] vs. 99.6 [CI, 97.0–99.9] respectively) across developed and developing countries. Hepacard test showed inconsistency in pooled sensitivity (98.0 [CI, 95.1–99.2] vs. 85.7 [CI, 51.6–97.1] respectively) in studies between developed countries and developing countries. In contrast pooled specificity of Hepacard was consistent and high in studies done both developed vs. developing countries (98.9 [CI, 92.1–99.9] vs. 99.5 [CI, 97.2–99.9] respectively) (Appendix Table 3).
Next we compared the DOR's of these 5 tests and compared these with pooled DOR's of remaining 37 tests with single data points (reference tests) in the meta-regression model. DORs of Determine test performances were significantly higher in studies done in developed (DORs 19971.5 [CI, 4263.2–93550.1] vs. 8169.7 [CI, 5155.7–12945.7]; P = 0.01) as well as in developing countries (8505.5 [993–72849.4] vs. 1116.9 [505.3–2468.8]; P = 0.03). BinxNow also showed significantly higher test estimates in studies done in developed countries (DORs 97845.1 [CI, 155549.6–615683.0] vs. 8169.7 [CI, 5155.7–12945.7]; P = 0.007). DOR's of SD, Hepacard, and Genedia did not differ from the DOR's of the reference tests in either developed or developing countries (Appendix Table 3).
Test brands with one or 2 data points could not be evaluated in the meta-analysis statistical model. Of these 42 such test brands, 7 tests had acquired extremely poor sensitivity estimates: ViruCheck (79.0 [CI, 71.7–83.2]), QuickChaser (77.0 [CI, 71.7–83.2]), Asan (78.6 [CI, 56.4–91.2]), Accurate (50.0 [CI, 34.6–65.4]), OneCheck (52.6 [CI, 37.1–67.5]), Cortez (58.3 [CI, 21.6–87.6]), and Onsite (75.0 [CI, 32.1–95.0]). In contrast, the specificity of these tests was consistency high (97.0 [CI, 96.5–99.9], 99.0 [CI, 96.5–99.9], 97.6 [CI, 71.3–99.9], 94.7 [CI, 70.6–99.3], 97.5 [CI, 70.2–99.8], 98.9 [CI, 84.9–99.9], 98.9 [CI, 84.9–99.9] respectively).
Analytical Analysis
Five studies used panels with low titer HBsAg sera and one study used seroconversion panel to evaluate analytical sensitivity of index tests. Sato et al15 used Dainabot panel with six concentrations. Index test sensitivity was 3.1 ng/ml (HBs/ad) and 6.3 ng/ml (HBs/ay). Nine of the 10 tests failed to detect WHO HBsAg low (0.1–0.8 IU/ml) titer sera. WHO11 five seroconversion panels with 43 sera (23 positive by reference test) reacted poorly by index tests. Clement et al16 used in-house standards with HBsAg concentrations and found index test lowest detection limit of 9.5 IU/ml as against 0.2–0.7 ng/ml by reference test. Lin et al17 used 2 analytical panels (In-house sensitivity panel & WHO HBsAg reference panel) and claimed DRW test detected HBsAg with 0.2–0.5 IU/ml irrespective of the serotype. ICBS12 HBsAg quantitative panel consisted of 146 sera with 8 HBV genotypes and 14 subtypes. Of the 19 RPOCTs, most could only detect undiluted sera with HBsAg levels of >4 IU/ml. 17 test kits showed genotype (D/ayw3, E/ayw4, F/adw4 and by S gene mutants) dependent sensitivity reduction. Analytical sensitivities for HBsAg of >1 IU/ml significantly reduce the length of the HBsAg positive period which renders them less reliable for detecting HBsAg in asymptomatic HBV infections.
Discussion
The present meta-analysis had six strengths when compared to 2 earlier studies10,52: i) global and complete literature search, with strict inclusion criteria, ii) defined strategy to include and analyze inconclusive results, iii) use of Bivariate statistical model, iv) statistical comparison in meta-regression model of summary estimates of diagnostic accuracy within subgroups to make relevant conclusions, v) evaluation of heterogeneity and its potential sources in the meta-regression model, vi) assessing analytical sensitivity of tests. We do not agree with use of Bayesian hierarchical summary receiver operating characteristic (HSROC) model on the assumption that IgM antibodies to HBcAg were not included in reference standard.53 The meta-analysis was related to detection of HBsAg, which is the hallmark of HBV infection. Further serological and molecular tests follow detection of HBsAg.3 In addition use of Bivariate model was appropriate as: i) reference standards were enzyme immunoassays which employed consistent standard positive thresholds across the studies as per manufacturer's guidelines, ii) Index test yielded positive and negative results as consistent cut-offs on the device (appearance of a colored line or dot) across the studies, iii) all studies administered the same reference standard to all patients, thereby avoiding partial or differential bias.25 HSROC model widens the confidence intervals due assumed conservative ranges of sensitivity and specificity.53 Interestingly, the same authors used bivariate model in similar meta-analysis for HCV.54
Our meta-analysis showed high pooled accuracy for RPOCTs for HBsAg. However, sensitivity of individual tests showed wide range from 43.5 to 99.8%. While evaluating the high accuracy of tests, we should be cautious as our meta-analysis was subject to the detection, spectrum, and sampling bias of the original studies.18 Case-control design employed in studies is apt to overestimate accuracy, with a potential of spectrum bias. In addition, only 4 of the 27 studies explicitly mentioned blinded reading of index test results, suggesting possible detection bias in the remaining studies. This could artificially inflate sensitivity and specificity estimates of the index test.
In the present meta-analysis all tests performed better in studies conducted in developed versus developing countries. It is well known that performance characteristic of any test varies markedly with prevalence of the condition in that population. Studies conducted in developed countries showed minimal heterogeneity while those in developing countries showed substantial heterogeneity. These observations need to be kept in mind as all these tests are meant to be employed in low resource endemic regions of the World. Satisfying was the observation that cross reactive sera (for example HIV, HCV, Tuberculosis etc.) did not influence the diagnostic accuracy of the tests. Such co-infections are highly prevalent in endemic regions and this findings is significant while evaluating scope of these test usage.
We could evaluate the performances of 5 tests with ≥3 data points in our statistical model. Determine and BinaxNow tests showed significantly higher test estimates than the reference standard. In addition Determine test estimates were consistent across studies performed in the developed and developing countries. However, this finding should not underestimate tests which could not be evaluated in the statistical model. We believe that the high accuracy of some tests may have been obscured. For example, Lin et al17 made head-to-head comparison of DRW test and Determine and found DRW did better in overall accuracy, analytical and seroconversion panels.
We believe evaluation of tests by analytical and seroconversion panels gave concerning results. Analytical sensitivity of tests was around 4 IU/ml, which is much higher (<0.5 IU/ml) than claimed by most manufacturers.9 Tests performed poorly in seroconversion panels and showed sensitivity reduction with several HBV mutants. Thus these tests are likely to do poorly in situations with low concentrations of HBsAg prevalent in healthy blood donors, general populations, patients recovering from acute HBV infection and those on antiviral therapy.19
Limitations
While the included studies in the present meta-analysis addressed accuracy of RPOCTs for HBsAg, there was little information available on the evaluation of these tests on HBV-related patient centered outcomes. The most important of these is the feasibility and outcomes of these tests in various setting where HBsAg testing is routinely done. Studies need to be done how these tests shall perform in following situations: i) seroepidemiologic studies in low and high endemic zones, ii) screening of blood and blood products for HBsAg and prevention of transfusion transmitted HBV infection, iii) diagnosis and follow up of acute hepatitis and fulminant hepatic failure, iv) diagnosis of HBV-related chronic hepatitis and cirrhosis and evaluation of antiviral therapy. These outcomes are key to shaping global policy in diagnostics as it becomes more patient centered in the future. In addition we need to do studies which shall address the variability in accuracy with variable prevalence in different population and settings. Also impact of HBV e-mutants which constitute upto 30% of chronic infections in tropical regions need to be defined.55
Conclusions
RPOCTs have major benefits to offer in screening and control of HBV infection especially in far flung low resource endemic zones of the world. The tests are cheap, give rapid diagnosis, are convenient and easy to store, need small blood samples for testing, need minimal training of professionals for testing and need no or minimal expensive equipment. However, their global uptake needs to be addressed keeping in view the overall performance of the tests. With present low level of test accuracy especially sensitivity, poor performance in developing countries, poor analytical sensitivity and possible influence of HBV mutants, these tests shall significantly underdiagnose HBV infections. This is of major importance in blood banks. Many potential donors in blood banks in tropical countries are likely to have low HBsAg titers and tests are unlikely to diagnose such infections, putting huge health risks to recipients. We believe tests with better analytical sensitivity need to be developed and their feasibility and outcomes in various clinical settings need to be addressed.
Funding source
Our study was funded by the “Dr. Khuroo's Medical Trust”, a non-profit organization to promote research and help poor patients for medical treatment. The funding source had no role in the conception, design or conduct of this review.
Conflicts of interest
All authors have none to declare.
Appendix A. Supplementary data
The following are the supplementary data related to this article:
Protocol for systematic review and meta-analysis: Accuracy of rapid and point-of-care diagnostic tests for hepatitis B surface antigen: a systematic review and meta-analysis.
Systematic review methodology & definitions of relevant accuracy estimates.
Test Specifications. Characteristics of 47 test brands evaluated in the 27 included studies has been tabulated.
Multivariate Meta-regression Model Depicting inter-relationship of 3 Variables on Test Accuracy and Heterogeneity (Metric used Diagnostic Odds Ratio).
Estimates of five Test brands stratified by study location.
Appendix Figure 1.
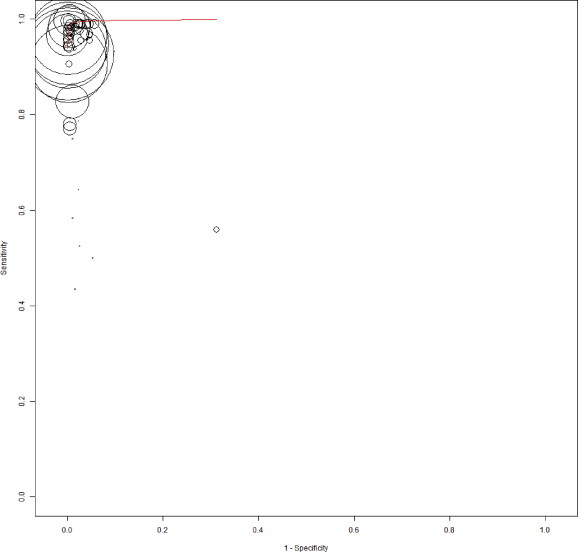
The summary receiver operating characteristic (SROC) plot based on bivariate random-effects model. The sensitivity and specificity of rapid point-of-care tests with reference test for HBsAg is shown. The sensitivity of a test is plotted against 1-specificty, allowing comparison at the same time for multiple tests. The circle represent a single data point of a test from individual studies and the size of the circle is proportional to the number of patients included in the study. The curved red line is regression summary ROC curve summarizing the overall diagnostic accuracy.
Forest plot of the sensitivity and specificity estimates and 95% confidence intervals (CIs) stratified by reference standard. Subgroup N = EIA/ELISA/MEIA alone and Subgroup Y = additional confirmatory neutralization tests, HBsAg quantification or PCR in addition to enzyme immunoassay. Estimates of sensitivity and specificity from each study are shown as solid squares. Solid lines represent the 95% CIs. Squares are proportional to the weights based on the random effect model. Pooled estimates and 95% CIs is denoted by the diamond at the bottom. I2 and P values represents heterogeneity of studies.
Forest plot of the sensitivity and specificity estimates and 95% confidence intervals (CIs) stratified by STARD score (Subgroup L = score ≤ 15 and Subgroup H = score> 15). Estimates of sensitivity and specificity from each study are shown as solid squares. Solid lines represent the 95% CIs. Squares are proportional to the weights based on the random effect model. Pooled estimates and 95% CIs is denoted by the diamond at the bottom. I2 and P values represents heterogeneity of studies.
Forest plot of the diagnostic odds ratio estimates and 95% confidence intervals (CIs) of 5 test brands (pooled data from developed and developing countries) which had generated 3 or >3 data points each and were evaluated statically in the meta-regression model. Estimates of diagnostic odds ratio from each study are shown as solid squares. Solid lines represent the 95% CIs. Squares are proportional to the weights based on the random effect model. Pooled estimates and 95% CIs is denoted by the diamond at the bottom. I2 and P values represents heterogeneity of studies.
Forest plot of the diagnostic odds ratio estimates and 95% confidence intervals (CIs) of 3 test brands in studies conducted in developed countries. Estimates of diagnostic odds ratio from each study are shown as solid squares. Solid lines represent the 95% CIs. Squares are proportional to the weights based on the random effect model. Pooled estimates and 95% CIs is denoted by the diamond at the bottom. I2 and P values represents heterogeneity of studies.
Forest plot of the diagnostic odds ratio estimates and 95% confidence intervals (CIs) of 4 test brands in studies conducted in developing countries. Estimates of diagnostic odds ratio from each study are shown as solid squares. Solid lines represent the 95% CIs. Squares are proportional to the weights based on the random effect model. Pooled estimates and 95% CIs is denoted by the diamond at the bottom. I2 and P values represents heterogeneity of studies.
References
- 1.Lee W.M. Hepatitis B virus infection. N Engl J Med. 1997;337:1733–1745. doi: 10.1056/NEJM199712113372406. [DOI] [PubMed] [Google Scholar]
- 2.Alter M.J. Epidemiology and prevention of hepatitis B. Semin Liver Dis. 2003;23:39–46. doi: 10.1055/s-2003-37583. [DOI] [PubMed] [Google Scholar]
- 3.Krajden M., McNabb G., Petric M. The laboratory diagnosis of hepatitis B virus. Can J Infect Dis Med Microbiol. 2005;16(2):65–72. doi: 10.1155/2005/450574. [DOI] [PMC free article] [PubMed] [Google Scholar]
- 4.Dufour D.R. Hepatitis B surface antigen (HBsAg) assays—are they good enough for their current uses? Clin Chem. 2006;52:1457–1459. doi: 10.1373/clinchem.2006.072504. [DOI] [PubMed] [Google Scholar]
- 5.Bayliss J., Nguyen T., Lesmana C.R., Bowden S., Revill P. Advances in the molecular diagnosis of hepatitis B infection: providing insight into the next generation of disease. Semin Liver Dis. 2013;33(2):113–121. doi: 10.1055/s-0033-1345714. [DOI] [PubMed] [Google Scholar]
- 6.John A.S., Price C.P. Economic evidence and point-of-care testing. Clin Biochem Rev. 2013;34:61–74. [PMC free article] [PubMed] [Google Scholar]
- 7.Centers for Disease Control and Prevention . vol. 47. 1995. Update: HIV Counseling and Testing Using Rapid Tests—United States; pp. 211–215. (Morbidity Mortality Weekly Report). [PubMed] [Google Scholar]
- 8.Mabey D., Peeling R.W., Perkins M.D. Rapid and simple point of care diagnostics for STIs (Editorial) Sex Transm Infect. 2001;77:397–398. doi: 10.1136/sti.77.6.397. [DOI] [PMC free article] [PubMed] [Google Scholar]
- 9.RDT Info: Current Information on Rapid Diagnostic Tests. Rapid tests for Hepatitis B. Diagnostic overview. www.rapid-diagnostics.org/rti-hepb-diag.htm.
- 10.Shivkumar S., Peeling R., Jafari Y., Joseph L., Pai N.P. Rapid point-of-care first-line screening tests for hepatitis B infection: a meta-analysis of diagnostic accuracy (1980-2010) Am J Gastroenterol. 2012;107(9):1306–1313. doi: 10.1038/ajg.2012.141. [DOI] [PubMed] [Google Scholar]
- 11.World Health Organization. Hepatitis B Surface Antigen Assays: Operational Characteristics (Phase I). http://www.who.int/diagnostics_laboratory/evaluations/en/hep_B_rep1.pdf. (Updated on July 19 2007).
- 12.International Consortium for Blood Safety (ICBS), New York, USA & ICBS-Europe, Düsseldorf, Germany: HBV Test Kit Evaluation Results; http://www.icbs-web.org/page31.html.
- 13.Khan J., Lone D., Hameed A. Evaluation of the performance of two rapid immuno chromatographic tests for detection of hepatitis B surface antigen and anti HCV antibodies using ELISA tested samples. AKEMU. 2010;16(1S1):84–87. [Google Scholar]
- 14.Shinkins B., Thompson M., Mallett S., Perera R. Diagnostic accuracy studies: how to report and analyse inconclusive test results. BMJ. 2013;346:f2778. doi: 10.1136/bmj.f2778. [DOI] [PubMed] [Google Scholar]
- 15.Sato K., Ichiyama S., Iinuma Y., Nada T., Shimokata K., Nakashima N. Evaluation of immunochromatographic assay systems for rapid detection of hepatitis B surface antigen and antibody, Dainascreen HBsAg and Dainascreen Ausab. J Clin Microbiol. 1996;34:1420–1422. doi: 10.1128/jcm.34.6.1420-1422.1996. [DOI] [PMC free article] [PubMed] [Google Scholar]
- 16.Clement F., Dewint P., Leroux-Roels G. Evaluation of a new rapid test for the combined detection of hepatitis B virus surface antigen and hepatitis B virus e antigen. J Clin Microbiol. 2002;40(12):4603–4606. doi: 10.1128/JCM.40.12.4603-4606.2002. [DOI] [PMC free article] [PubMed] [Google Scholar]
- 17.Lin Y.H., Wang Y., Loua A. Evaluation of a new hepatitis B virus surface antigen rapid test with improved sensitivity. J Clin Microbiol. 2008;46:3319–3324. doi: 10.1128/JCM.00498-08. [DOI] [PMC free article] [PubMed] [Google Scholar]
- 18.Higgins J.P., Thompson S.G. Quantifying heterogeneity in a meta-analysis. Stat Med. 2002;21:1539–1558. doi: 10.1002/sim.1186. [DOI] [PubMed] [Google Scholar]
- 19.Hadziyannis E. Quantification of HBsAg in serum: characteristics of the assays. OA Hepatol. 2013;1:1–6. [Google Scholar]
- 20., Moher D., Liberati A., Tetzlaff J., Altman D.G., The PRISMA Group Preferred reporting items for systematic reviews and meta-analyses: the PRISMA statement. PLoS Med. 2009;6(7):e1000097. doi: 10.1371/journal.pmed.1000097. [DOI] [PMC free article] [PubMed] [Google Scholar]
- 21.Khuroo M.S., Khuroo M., Farahat K.L.C., Kagevi I. Treatment with proton pump inhibitors in acute non-variceal upper gastrointestinal bleeding: a meta-analysis. J Gastroenterol Hepatol. 2005;20:11–25. doi: 10.1111/j.1440-1746.2004.03441.x. [DOI] [PubMed] [Google Scholar]
- 22.Smalheiser N.R., Lin C., Jia L. Design and implementation of metta, a metasearch engine for biomedical literature retrieval intended for systematic reviewers. Health Inf Sci Syst. 2014;2:1. doi: 10.1186/2047-2501-2-1. [DOI] [PMC free article] [PubMed] [Google Scholar]
- 23.Whiting P.F., Rutjes A.W., Westwood M.E., QUADAS-2 Group QUADAS-2: a revised tool for the quality assessment of diagnostic accuracy studies. Ann Intern Med. 2011;155(8):529–536. doi: 10.7326/0003-4819-155-8-201110180-00009. [DOI] [PubMed] [Google Scholar]
- 24.Bossuyt P.M.M., Reitsma J.B., Bruns D.E., Standards for Reporting of Diagnostic Accuracy Toward complete and accurate reporting of studies of diagnostic accuracy: the STARD initiative. Ann Intern Med. 2003;138:40–44. doi: 10.7326/0003-4819-138-1-200301070-00010. [DOI] [PubMed] [Google Scholar]
- 25.Reistma J.B., Glas A.S., Rutjes A.W., Scholten R.J., Bossuyt P.M., Zwinderman A.H. Bivariate analysis of sensitivity and specificity produces informative summary measures in diagnostic reviews. J Clin Epidemiol. 2005;58:982–990. doi: 10.1016/j.jclinepi.2005.02.022. [DOI] [PubMed] [Google Scholar]
- 26.DerSimonian R., Laird N. Meta-analysis in clinical trials. Control Clin Trials. 1986;7:177–188. doi: 10.1016/0197-2456(86)90046-2. [DOI] [PubMed] [Google Scholar]
- 27.Vamvakas E.C. Applications of meta-analysis in pathology practice. Am J Clin Pathol. 2001;116(suppl 1):S47–S64. doi: 10.1309/7PM3-HVFR-LTCW-61TE. [DOI] [PubMed] [Google Scholar]
- 28.Wallace C.B., Schmid C.H., Lau J., Trikalinos T.A. Meta-Analyst: software for meta-analysis of binary, continuous and diagnostic data. BMC Med Res Methodol. 2009;9:80. doi: 10.1186/1471-2288-9-80. [DOI] [PMC free article] [PubMed] [Google Scholar]
- 29.Nakata J.M., Johnson J.M. Annual Meeting of the American Society for Microbiology, Anaheim. 1990. Evaluation of rapid immunoconcentration assay for HBsAg in a prison inmate population. [Google Scholar]
- 30.Mvere D., Constantine N.T., Kalaswue E., Tobaiwa O., Dambire S., Corcoran P. Rapid and simple hepatitis assays: encouraging results from a blood donor population in Zimbabwe. Bull World Health Organ. 1996;74:19–24. [PMC free article] [PubMed] [Google Scholar]
- 31.Abraham P., Sujatha R., Raghuraman S., Subramaniam T., Sridharan G. Evaluation of two immunochromatographic assays in relation to RAPID screening of HbsAg. Ind J Med Microbiol. 1998;16:23–25. [Google Scholar]
- 32.Oh J., Kim T.Y., Yoon H.J., Min H.S., Lee H.R., Choi T.Y. Evaluation of Genedia HBsAg rapid and Genedia anti-HBs rapid for the screening of HBsAg and anti-HBs. Korean J Clin Pathol. 1999;19:114–117. [Google Scholar]
- 33.Palmer C., Cuadrado R., Koenig E. Interscience Conference on Antimicrobial Agents and Chemotherapy, Ft Lauderdale. 1999. Multi-center evaluation of the Determine™ rapid test for the diagnosis of HIV, hepatitis B surface antigen and syphilis. [Google Scholar]
- 34.Kaur H., Dhanao J., Oberoi A. Evaluation of rapid kits for detection of HIV, HBsAg and HCV infections. Ind J Med Sci. 2000;54:432–434. [PubMed] [Google Scholar]
- 35.Lien T.X., Tien N.T.K., Chanpong G.F. Evaluation of rapid diagnostic tests for the detection of human immunodeficiency virus types 1 and 2, hepatitis B surface antigen and syphilis in Ho Chi Minh City, Vietnam. Am J Trop Med Hyg. 2000;62(2):301–309. doi: 10.4269/ajtmh.2000.62.301. [DOI] [PubMed] [Google Scholar]
- 36.Raj A.A., Subramaniam T., Raghuraman S., Abraham P. Evaluation of an indigenously manufactured rapid immunochromatographic test for detection of HBsAg. Ind J Pathol Microbiol. 2001;44:413–414. [PubMed] [Google Scholar]
- 37.Lau D.T., Ma H., Lemon S.M. A rapid immunochromatographic assay for hepatitis B virus screening. J Viral Hepat. 2003;10:331–334. doi: 10.1046/j.1365-2893.2003.00418.x. [DOI] [PubMed] [Google Scholar]
- 38.Whang D.H., Um T. Comparison of immunochromatography assays and quantitative immunoassays for detecting HBsAg and anti-HBs. Korean J Lab Med. 2005;25:186–191. [Google Scholar]
- 39.Cha Y.J., Yang J.S., Chae S.L. Evaluation of indigenously manufactured immunochromatographic assay systems for rapid detection of hepatitis B surface antigen and antibody. Korean J Lab Med. 2006;26:52–57. doi: 10.3343/kjlm.2006.26.1.52. [DOI] [PubMed] [Google Scholar]
- 40.Akanmu A.S., Esan O.A., Adewuyi J.O. Evaluation of a rapid test kit for detection of HBsAg/eAg in whole blood: a possible method for pre-donation testing. Afr J Med Med Sci. 2006;35:5–8. [PubMed] [Google Scholar]
- 41.Ansari M., Omrani M.-D., Movahedi V. Comparative evaluation of immunochromatographic rapid diagnostic tests (Strip and Device) and PCR methods for detection of human hepatitis B surface antigens. Hepat Mon. 2007;7:87–91. [Google Scholar]
- 42.Randrianirina F., Carod J.F., Ratsima E., Chretien J.B., Richard V., Talarmin A. Evaluation of the performance of four rapid tests for detection of hepatitis B surface antigen in Antananarivo, Madagascar. J Virol Methods. 2008;151:294–297. doi: 10.1016/j.jviromet.2008.03.019. [DOI] [PubMed] [Google Scholar]
- 43.Torane V.P., Shastri J.S. Comparison of ELISA and rapid screening tests for the diagnosis of HIV, hepatitis B and hepatitis C among healthy blood donors in a tertiary care hospital in Mumbai. Ind J Med Microbiol. 2008;26:284–285. doi: 10.4103/0255-0857.42071. [DOI] [PubMed] [Google Scholar]
- 44.Nyirenda M., Beadsworth M.B.J., Stephany P. Prevalence of infection with hepatitis B and C virus and co-infection with HIV in medical inpatients in Malawi. J Infect. 2008;57:72–77. doi: 10.1016/j.jinf.2008.05.004. [DOI] [PubMed] [Google Scholar]
- 45.Ola S.O., Otegbayo J.A., Yakubu A., OAje A., Odaibo G.N., Shokunb W.I. Pitfalls in diagnosis of hepatitis B virus infection among adults Nigerians. Niger J Clin Pract. 2009;12(4):350–354. [PubMed] [Google Scholar]
- 46.Davies J., van Oosterhout J.J., Nyirenda M. Reliability of rapid testing for hepatitis B in a region of high HIV endemicity. Trans R Soc Trop Med Hyg. 2010;104(2):162–164. doi: 10.1016/j.trstmh.2009.10.010. [DOI] [PubMed] [Google Scholar]
- 47.Scheiblauer H., El-Nageh M., Diaz S. Performance evaluation of 70 hepatitis B virus (HBV) surface antigen (HBsAg) assays from around the world by a geographically diverse panel with an array of HBV genotypes and HBsAg subtypes. Vox Sang. 2010;98:403–414. doi: 10.1111/j.1423-0410.2009.01272.x. [DOI] [PMC free article] [PubMed] [Google Scholar]
- 48.Maity S., Nandi S., Biswas S., Sadhukhan S.K., Saha M.K. Performance and diagnostic usefulness of commercially available enzyme linked immunosorbent assay and rapid kits for detection of HIV, HBV and HCV in India. Virol J. 2012;9:290. doi: 10.1186/1743-422X-9-290. [DOI] [PMC free article] [PubMed] [Google Scholar]
- 49.Bottero J., Boyd A., Gozlan J. Performance of rapid tests for detection of HBsAg and anti-HBsAb in a large cohort, France. J Hepatol. 2013;58(3):473–478. doi: 10.1016/j.jhep.2012.11.016. [DOI] [PubMed] [Google Scholar]
- 50.Franzeck F.C., Ngwale R., Msongole B. Viral hepatitis and rapid diagnostic test based screening for HBsAg in HIV-infected patients in rural Tanzania. PLoS One. 2013;8(3):e58468. doi: 10.1371/journal.pone.0058468. [DOI] [PMC free article] [PubMed] [Google Scholar]
- 51.Chameera E.W.S., Noordeen F., Pandithasundara H., Abeykoon A.M.S.B. Diagnostic efficacy of rapid assays used for the detection of hepatitis B virus surface antigen. Sri Lankan J Infect Dis. 2013;3(2):21–27. [Google Scholar]
- 52.Hwang S.H., Oh H.B., Choi S.E. Meta-Analysis for the pooled sensitivity and specificity of hepatitis B surface antigen rapid tests. Korean J Lab Med. 2008;28:160–168. doi: 10.3343/kjlm.2008.28.2.160. [DOI] [PubMed] [Google Scholar]
- 53.Dendukuri N., Schiller I., Joseph L., Pai M. Bayesian meta-analysis of the accuracy of a test for tuberculous pleuritis in the absence of a gold standard reference. Biometrics. 2012;68(4):1285–1293. doi: 10.1111/j.1541-0420.2012.01773.x. [DOI] [PMC free article] [PubMed] [Google Scholar]
- 54.Shivkumar S., Peeling R., Jafari Y., Joseph L., Pai N.P. Accuracy of rapid and Point-of-Care screening tests for hepatitis C. A systematic review and meta-analysis. Ann Intern Med. 2012;157:558–566. doi: 10.7326/0003-4819-157-8-201210160-00006. [DOI] [PubMed] [Google Scholar]
- 55.Funk M.L., Rosenberg D.M., Lok A.S. World-wide epidemiology of HBsAg-negative chronic hepatitis B and associated precore and core promotor variants. J Viral Hepat. 2002;9(1):52–61. doi: 10.1046/j.1365-2893.2002.00304.x. [DOI] [PubMed] [Google Scholar]
Associated Data
This section collects any data citations, data availability statements, or supplementary materials included in this article.
Supplementary Materials
Protocol for systematic review and meta-analysis: Accuracy of rapid and point-of-care diagnostic tests for hepatitis B surface antigen: a systematic review and meta-analysis.
Systematic review methodology & definitions of relevant accuracy estimates.
Test Specifications. Characteristics of 47 test brands evaluated in the 27 included studies has been tabulated.
Multivariate Meta-regression Model Depicting inter-relationship of 3 Variables on Test Accuracy and Heterogeneity (Metric used Diagnostic Odds Ratio).
Estimates of five Test brands stratified by study location.
Forest plot of the sensitivity and specificity estimates and 95% confidence intervals (CIs) stratified by reference standard. Subgroup N = EIA/ELISA/MEIA alone and Subgroup Y = additional confirmatory neutralization tests, HBsAg quantification or PCR in addition to enzyme immunoassay. Estimates of sensitivity and specificity from each study are shown as solid squares. Solid lines represent the 95% CIs. Squares are proportional to the weights based on the random effect model. Pooled estimates and 95% CIs is denoted by the diamond at the bottom. I2 and P values represents heterogeneity of studies.
Forest plot of the sensitivity and specificity estimates and 95% confidence intervals (CIs) stratified by STARD score (Subgroup L = score ≤ 15 and Subgroup H = score> 15). Estimates of sensitivity and specificity from each study are shown as solid squares. Solid lines represent the 95% CIs. Squares are proportional to the weights based on the random effect model. Pooled estimates and 95% CIs is denoted by the diamond at the bottom. I2 and P values represents heterogeneity of studies.
Forest plot of the diagnostic odds ratio estimates and 95% confidence intervals (CIs) of 5 test brands (pooled data from developed and developing countries) which had generated 3 or >3 data points each and were evaluated statically in the meta-regression model. Estimates of diagnostic odds ratio from each study are shown as solid squares. Solid lines represent the 95% CIs. Squares are proportional to the weights based on the random effect model. Pooled estimates and 95% CIs is denoted by the diamond at the bottom. I2 and P values represents heterogeneity of studies.
Forest plot of the diagnostic odds ratio estimates and 95% confidence intervals (CIs) of 3 test brands in studies conducted in developed countries. Estimates of diagnostic odds ratio from each study are shown as solid squares. Solid lines represent the 95% CIs. Squares are proportional to the weights based on the random effect model. Pooled estimates and 95% CIs is denoted by the diamond at the bottom. I2 and P values represents heterogeneity of studies.
Forest plot of the diagnostic odds ratio estimates and 95% confidence intervals (CIs) of 4 test brands in studies conducted in developing countries. Estimates of diagnostic odds ratio from each study are shown as solid squares. Solid lines represent the 95% CIs. Squares are proportional to the weights based on the random effect model. Pooled estimates and 95% CIs is denoted by the diamond at the bottom. I2 and P values represents heterogeneity of studies.