Abstract
B-cell chronic lymphocytic leukemia (B-CLL) is the most common adult leukemia. Deregulation of the T-cell leukemia/lymphoma 1 (TCL1) oncogene in mouse B cells causes a CD5-positive leukemia similar to aggressive human B-CLLs. We recently reported that levels of TCL1 expression in B-CLL are regulated by miR-29 and miR-181 that target 3′ UTR of TCL1. To determine whether treatment with microRNAs targeting TCL1 can inhibit B-CLL in mice, we generated TCL1 transgenic mice using a construct containing the 3′ and 5′ UTRs of TCL1 under B-cell-specific Eμ promoter (Eμ-TCL1FL). At the age of 16–20 months, these mice showed B-CLL-like disease. Immunophenotyping revealed accumulation of CD5 + CD23 + B220 + population in spleens and lymph nodes. Our results show that CD5 + CD23 + B-cell populations from Eμ-TCL1FL mice actively proliferate and show significantly increased levels of phospho-Akt. El-TCL1FL mice showed immunological abnormalities similar to human B-CLL, including hypoimmunoglobulinemia, abnormal levels of cytokines and impaired immune response. These findings revealed biochemical and immunological similarities between Tcl1-driven B-CLL in mice and human B-CLL.
Keywords: B-CLL, TCL1, mouse models
Introduction
B-cell chronic lymphocytic leukemia (B-CLL) represents the most common form of leukemia in adults of Western countries, accounts for 25% of all cases of leukemia in adults.1 B-CLL is characterized by the accumulation of mature-looking B-lymphocytes in the peripheral blood and bone morrow.2 For a long time it was generally accepted that B-CLL is a disease resulting from an inherent defect in apoptosis, and that malignant cells accumulate because of diminished cell death.1,2 According to this view, B-CLL cells are relatively inert, divide minimally and accumulate until levels not supportable by a patient. However, this traditional view has changed in the past decade. Recent investigations have shown that high lymphocyte count can result from not only the prolonged survival, but also from proliferating cells originated in the bone morrow, lymph nodes or spleen.3-5 Immune incompetence is a prominent feature of B-CLL. Almost all patients develop profound hypogammaglobulinemia and impaired response to antigens.6 Abnormal cytokines production is another feature of B-CLL.7 Cytokines derived from tumor (autocrine) or from surrounding host cells (paracrine) likely have an important role in the growth of malignant cells.7
Deregulation of the TCL1 oncogene is in the pathogenesis of the aggressive form of B-CLL.8 TCL1 was discovered as a target of chromosomal aberrations (translocations and inversions) of TCL1 (T-cell leukemia/lymphoma 1) locus at 14q32.1.9 Tcl1 expression is initiated at the pro-B cells and can be detected on all stages of B cells development except post-GC (germinal center) memory B cells and plasma cells.10 Deregulation of TCL1 in mouse B cells causes a CD5-positive leukemia similar to aggressive human B-CLLs.11 Along with others, we recently reported that high Tcl1 expression in human B-CLL correlates with aggressive course of the disease showing unmutated immunoglobulin variable region genes and ZAP70 positivity.12,13
Malignant B-CLL cells express dim CD5, CD23 and IgM, dim or negative for CD27, cells are negative for FMC-7 and CD79b.14 Mantle cell lymphoma cells express CD5 and CD19, but lack CD23.14,15 CD23 is a 45-kDa type 2 transmembrane glycoprotein that is expressed on several hematopoietic cells types and functions as a low-affinity receptor for IgE. CD23 has been shown to have a role in modulating the production of IgE in B cells.16 CD23 protein is a member of the C-type lectin family, and it contains a stalk between the extracellular lectin-binding domain and transmembrane region that oligomerizes membrane-bound CD23 as a trimer.16 Extracellular domain can be cleaved resulting in the release of soluble forms of CD23 from the cell surface.16 We recently reported that TCL1 expression in B-CLL is regulated by miR-29 and miR-181.12 Another report suggested that TCL1 is also a target of miR-34.17 To determine whether treatment with microRNAs can inhibit B-CLL in mice by targeting TCL1, we generated a new TCL1 transgenic mouse model using a construct containing 3′ and 5′ UTRs of TCL1 under B-cell-specific Em promoter (Eμ-TCL1FL). Our previous Em-TCL1 mouse model lacks the 3′ and 5′ UTRs of TCL1.11 In this study, we investigated the pathological abnormalities in this new Eμ-TCL1FL transgenic mouse model.
Materials and methods
Eμ-TCL1FL transgenic mice
A 1.3-kb fragment containing human TCL1 open reading frame (ORF) and both, 5′ and 3′ UTRs was cloned into the EcoRV and SalI sites of the pBSVE6BK (pEμ) plasmid containing a mouse VH promoter (V186.2), the IgH-Em enhancer, and the poly(A) site of the human β-globin gene.11 Transgenic construct, free from vector sequences, was injected into fertilized oocytes from FVB/N animals. Transgenic mice were produced in Ohio State University transgenic mouse facility. Mice were screened for the presence of the transgene by PCR analysis on tail DNAs. Two founders were obtained (FL1 and FL4) and bred in FVB/N strain. Transgenic heterozygote mice issued from these founders were studied and compared with non-transgenic siblings raised in identical conditions. Genotyping was performed on tail DNAs by PCR. Primers were:
Tcl1Dir 5′-AGTGGTAAATATAGGGTTGTCTACAC-3′; Tcl1Rev5′-CGCAAGAGCACCCGTAACTGTAAC-3′.
Western blot analysis and mice immunization
Proteins from spleens were extracted with Nonidet P-40 lysis buffer as previously described.18 Tcl1 expression was detected using Tcl-1 antibodies (SC-32331, Santa Cruz Biotechnology, Santa Cruz, CA, USA). Ponceau-S staining was used to verify equivalent protein loading. Mice, 16–18 months old, were immunized intravenously with 2 × 10⁸ to 3 × 10⁸ sheep red blood cells (SRBCs; Colorado Serum Company, Denver CO, USA) to elicit SRBC-specific antibody immune responses. Pre-immune blood samples were obtained 2 days before immunization, blood samples were drawn and analyzed 1 week after immunization. Serum levels of anti-SRBC were measured using enzyme-linked immunoassay kit (Life Diagnostics, West Chester, PA, USA) according to manufacturer’s instructions. Briefly, 100 μl standards and mice sera were loaded to each well of a 96-well plate, incubated for 45 min at room temperature (RT) and washed five times by wash solutions. After washing, 100 μl of peroxidase-labeled anti-SRBC antibody conjugate was added to each well, incubated for 45 min at RT, and washed five times. For visualization of the antigen antibody reaction, the substrate 3,3′,5,5′-tetrametilbenzidine was added 100 μl per well and plates were left at RT for 20 min. To avoid an increase in the background, the reaction was stopped by adding 100 μl per well of 1 M HCl.
Isolation of B-lymphocytes flow cytometry and real-time reverse transcriptase-PCR
Lymphocytes from spleens and lymph nodes were isolated as previously described. B cells were isolated using B-Cell Isolation Kit (Miltenyi Biotec, Auburn, CA, USA) according to manufacturer’s instructions. Cell surface receptors were counted using QuantiBRITE PE Kit (BD Bioscience, San Jose, CA, USA) according to manufacturer’s instructions. For immunostaining, single-cell suspension was made in phosphate-buffered saline supplemented with 1% bovine calf serum (staining solution). Cells were washed in this solution, and incubated with antibodies for 30 min, at RT. Flow cytomertry was carried out on a LSR2 using BD FACSDiva software (BD Bioscience), and FACSCalibur (BD Bioscience) using CellQuestPro software (BD Bioscience). Conjugated monoclonal antibodies to CD5(53-7.3), CD19(1D3), CD23(B3B4), CD45R(RA3-6B2), CD22(Cy34.1), IgM(R6-60.2), IgD(11-26c.2a), CD79b(HM79b) were purchased from BD Biosciences. Cytokines were measured using Mouse Inflammation Kit (BD Biosciences) according to manufacturer’s instructions. Levels of phospho-Akt(Ser-473) and phospho-ERK1/2 (Thr202/Tyr204) were detected using BD Phosflow protocol (BD Biosciences), and anti-Akt(pS473)(M86-61) and anti-ERK1/2 (pT202/pY204)(20A) antibodies. Briefly, isolated spleen lymphocytes were stimulated by 200 nM PMA (phorbol 12-myristate 13-acetate) for 15 min at 37 °C, followed by fixation in BD Phosflow Fix Buffer 1 for 10 min at 37 °C, washed two times by BD Phosflow Perm/wash buffer 1 and stained with corresponding antibodies for 30 min at RT. After staining, cells were washed three times by BD Phosflow Perm/wash buffer 1 and analyzed by fluorescence-activated cell sorting. RNA extraction was carried out using the standard TRIzol method (Invitrogen, Carlsbad, CA, USA). Real-time PCR experiments were carried out using 389 (miR-15a), 391 (miR-16), 2112 (miR-29a), 413 (miR-29b), 587 (miR-29c), 2571 (miR-155), 480 (miR-181a), 1098 (miR-181b), 482 (miR-181c) assays for real-time PCR (Applied Biosystems, Foster City, CA, USA) according to manufacturer’s protocol. Sno135 was used as a control.
Measurements of immunoglobulin levels
Serum immunoglobulin levels were measured by enzyme-linked immunoassay kit (Immunology Consultant Laboratory, Newberg, OR, USA) according to manufacturer’s instructions. Briefly, 100 μl standards and mice sera were loaded to each well of a 96-well plate and incubated for 30 min at RT. After incubation, plate wells were washed four times by Wash Solutions, then 100 μl of appropriately diluted peroxidase-labeled antibody conjugate was added to each well and incubated for 30 min at RT followed by four washes by Wash Solutions. For visualization of the antigen antibody reaction, 100 μl per well of 3,3′,5,5′-tetrametilbenzidine was applied and plates were left at RT for 10 min to allow color development. To avoid an increase in the background in control wells, reactions were stopped by adding 100 μl per well of 0.3 M sulfuric acid. The quantity of immunoglobulins was calculated from the standard curve constructed from standards, and corrected for the serum dilutions.
Proliferation of CD5 + CD23 + population
In all, 1 mg of BrdU was injected in mice 24 h before proliferation and cell cycle measurement. Cell cycle and proliferation was measured using BrdU Flow Kit (BD Biosciences) according to manufacturer’s instructions.
Results
Production and characterization of Eμ-TCL1FL transgenic mice
We generated transgenic mice in which the expression of full-length TCL1 cDNA was under the control of a VH promoter-IgH-Em enhancer, along with the 3′ untranslated region and the poly(A) site of the human b-globin gene,11 which drives the expression of the TCL1 to immature and mature cells (Figure 1a). This construct included both 3′ and 5′ UTRs of TCL1 in contrast from previously reported TCL1-driven B-CLL mouse model, which used TCL1 ORF only.11 Two founders on FVB/N background designated FL1 and FL4 were generated and bred to establish the transgenic lines. Expression of Tcl1 was examined by western blot using spleen protein lysates and Tcl1 monoclonal antibody. Figure 1b shows high Tcl1 expression in both transgenic lines (FL1 and FL4), but no expression was detected in spleens of non-transgenic siblings (wild type).
Figure 1.

(a) Eμ-TCL1FL construct. (b) Tcl1 expression in Eμ-TCL1FL transgenic mouse model. Western blot analysis was carried out using anti-Tcl1 antibodies. wild-type spleen lysate from wild-type control. FL1 and FL4 spleen lysates from FL1 and FL4 transgenic lines. (c) Gross pathology of a representative 18 months old Eμ-TCL1FL transgenic mouse (right), and a wild-type control of the same age (left).
All mice at the age of 16–20 months became visibly ill and presented with enlarged spleens, livers and advanced lympho-adenopathy, a hallmark of human B-CLL (Figure 1c). Thus, these mice developed B-CLL a little bit later that our previous mouse model.11 The onset of a frank leukemia in the elderly mice provided further evidence of the establishment of a murine model of B-CLL, similar to previously reported Em-TCL1 transgenics.11
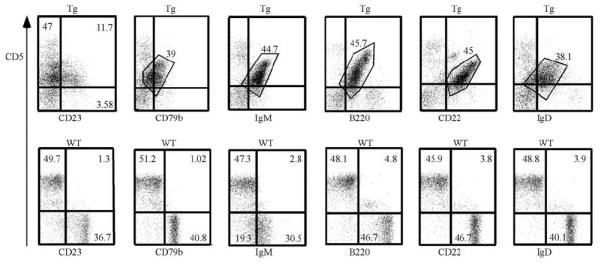
Immunofenotyping is a key tool for diagnosis of B-CLL. The typical immunophenotype of malignant cells is CD19 +/B220 + with dim surface expression of CD5, IgM, IgD, CD22 and CD23.14 A majority of B-CLL cells are CD79b negative.14 The results of immunophenotyping are shown on Figure 2. Typically, spleen lymphocytes of sick Eμ-TCL1FL transgenics contained 30–50% B220 + CD5 + B cells. The malignant cells of Eμ-TCL1FL mice showed B220 + CD5 + CD22 + IgM + IgD + phenotype. Interestingly, ~30% of these B-CLL cells were CD23 positive. These data clearly show that Eμ-TCL1FL mice developed a lymphoid malignancy closely resembling human B-CLL.
Figure 2.

Results of immunophenotyping of Eμ-TCL1FL transgenics and wild-type controls. Spleen lymphocytes were isolated from 18 months old animals. Representative images are shown from at least five mice analyzed.
Analysis of malignant B cells of Eμ-TCL1FL mice
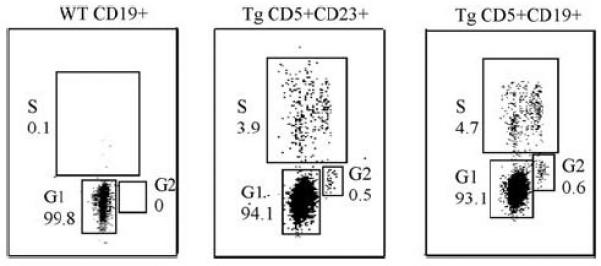
Recent investigations have shown that accumulation of B-CLL lymphocytes can result from not only the prolonged survival, but also from proliferating CD5 + CD23 + cells originated in the bone morrow, lymph nodes or spleen.3-5 To analyze whether B-CLL cells from Eμ-TCL1FL mice proliferate, we use cell cycle assay based on BrdU incorporation. We checked the proliferative capacity of CD19 + CD5 + CD23 + as well as total CD19 + CD5 + malignant spleen lymphocytes in comparison with wild-type B220 + spleen lymphocytes. Figure 3 shows that both CD19 + CD5 + CD23 + and total CD19 + CD5 + lymphocytes from Eμ-TCL1FL mice proliferate while no proliferation was detected for CD19 + wild-type lymphocytes (3.9 and 4.9% cells in S-phase versus 0.1% for wild-type B cells).
Figure 3.

Cell cycle analysis of leukemic cells from Eμ-TCL1FL transgenics and normal B cells from wild-type controls. Spleen lymphocytes were isolated from 18 months old animals. Representative images are shown from at least five mice analyzed.
As we previously reported that Tcl1 functions as co-activator of Akt,19 we analyzed the status of Akt activation in CD5 + CD19 + cells from TCL1 transgenics. The level of phospho-Akt (pS473) and phospho-ERK1/2(pT202/pY204) were measured before and after PMA stimulation. Figure 4 shows that levels of phospho-Akt(pS473) was significantly higher in malignant CD19 + CD5 + CD23 + and total CD19 + CD5 + lymphocytes from Eμ-TCL1FL mice compared with wild-type spleen B cells with or without PMA stimulation (Po0.001). Interestingly, phospho-Akt(pS473) levels in unstimulated transgenic lymphocytes were considerably higher than that in stimulated control lymphocytes. In contrast, no difference in ERK1/2(pT202/pY204) phosphorylation was observed (Figure 4).
Figure 4.

Levels of phospho-Akt (pS473) and phospho-ERK1/2(pT202/pY204) in leukemic cells from Eμ-TCL1FL transgenics and normal B cells from wild-type controls. Spleen lymphocytes were isolated from 18 months old animals. Representative images are shown from at least five mice analyzed.
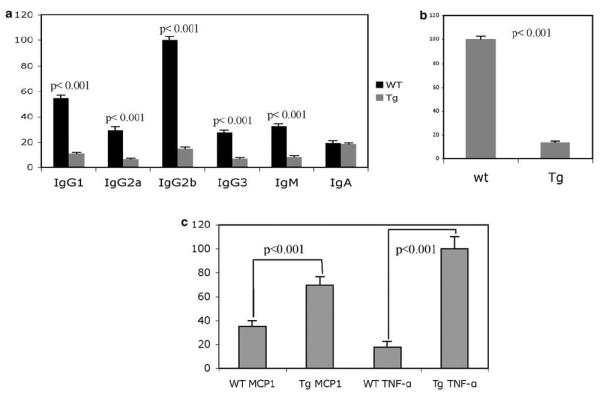
Human B-CLL is characterized by immune incompetence and a progressive severe hypogammaglobulinemia that eventually develops in all patients.6 To determine whether this is the case in Eμ-TCL1FL mice, we compared levels of serum immunoglobulins in sick transgenics of ~18 months of age versus wildtype littermates. Figure 5a shows that the levels of IgG1, IgG2a, IgG2b, IgG3 and IgM were decreased four- to eightfold in Eμ-TCL1FL transgenics versus wild-type controls. In contrast, no significant differences in levels of IgA were found (Figure 5a). To determine whether Eμ-TCL1FL mice show impaired immune response, we measured levels of anti-SRBC antibodies after injection of SRBC in TCL1 transgenics versus wild-type siblings. Figure 5b shows that serum levels of anti-SRBC antibodies were decreased ~eightfold in serum of TCL1 transgenics when compared with that of age-matched wild-type mice. These data clearly indicate that similarly to human B-CLL, B-CLL-like disease in Eμ-TCL1FL mice is characterized by severe hypogammaglobulinemia and immune incompetence.
Figure 5.

(a) Immunoglobulin levels in the serum of wild-type and transgenic animals, 16–18 months of age. The mean values are shown from five mice analyzed. (b) Levels of anti-SRBC-specific antibodies in the serum of wild-type and transgenic animals 16–18 months of age 7 days after SRBC injection. The mean values are shown from five mice analyzed. (c) Levels of Mcp1 and tumor necrosis factor (TNF)-α in the serum of wild-type and transgenic animals, 16–18 months of age. The mean values are shown from five mice analyzed.
As impaired production of cytokines is an important feature of human B-CLL,7 we analyzed serum levels of interleukin (IL)-2, IL-10, monocyte chemotactic protein (MCP)-1, tumor necrosis factor a, interferon (IFN)-γ and IL-12p70 in TCL1 transgenics. We found that the serum levels of tumor necrosis factor-α was eightfold higher and that of MCP-1 was twofold higher in TCL1 transgenics in comparison with wild-type littermates (Figure 5c). No differences in levels of IL-2, IL-10, IFN-γ and IL-12p70 were detected.
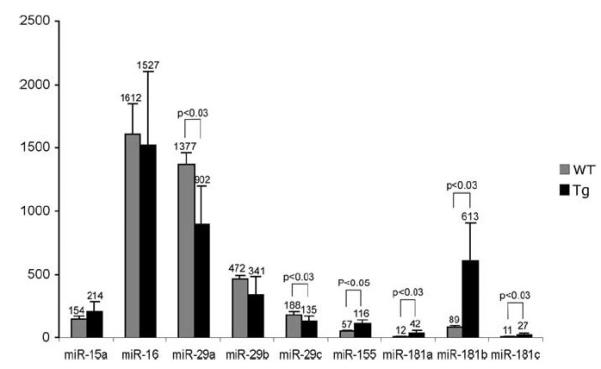
As we plan to use Eμ-TCL1FL mice to determine whether treatment with microRNAs targeting TCL1 can inhibit B-CLL, we studied expression levels of several microRNAs, previously reported differentially expressed in B-CLL by real-time reverse transcriptase-PCR. Malignant B-CLL cells from spleens and lymph nodes of Eμ-TCL1FL mice (when compared with wild-type spleen lymphocytes) showed significant increase in expression levels of miR-155, and miR-181a–c, and significant decrease in the expression of miR-29a and miR-29c (Figure 6). These results are consistent with previous reports showing that miR-155 and miR-181 are upregulated in aggressive human B-CLL, and miR-29 is downregulated.20,21 In contrast, no statistically significant difference in the expression of miR-15a and miR-16 was found (Figure 6).
Figure 6.

Expression levels of miR-15a, miR-16, miR-29a-c, miR-155 and miR-181a-c in malignant B-CLL cells from spleens and lymph nodes of Eμ-TCL1FL mice (n = 15) compared with wild-type spleen lymphocytes (n = 5). P-values are indicated wherein differences were found statistically significant.
Discussion
B-CLL is the most common leukemia in adults in Western hemisphere.1 TCL1 expression is upregulated in a substantial proportion of CLL, and deregulated expression of TCL1 in mouse B cells causes the B-CLL-like disease.11-13 We previously reported that Tcl1 functions as a co-activator of Akt and Tcl1 expression in B-CLL is regulated by miR-29 and miR-181.12,19 To determine whether treatments with microRNAs targeting TCL1 could inhibit B-CLL in mice, we generated TCL1 transgenic mice bearing 3′ and 5′ UTRs of human TCL1.
Our results are consistent with previous report describing phenotype of TCL1 transgenics lacking 5′ and 3′ UTRs.11 Eμ-TCL1FL transgenics developed B-CLL-like disease and died prematurely at the age of ~16–20 months.
Interestingly, these new TCL1 transgenics showed delayed onset of the disease compared with that of our previously reported TCL1 mice.11 This could be explained, at least in part, by targeting of TCL1 expression by microRNAs in Eμ-TCL1FL mice. In contrast, our results provide several new insights into pathogenesis of Tcl1-driven B-CLL. The most important diagnostic markers of B-CLL are CD5, CD19/B220 and CD23. Mantle cell lymphoma cells are characterized by CD5 positivity, but usually are CD23 negative.14,15 In a substantial number of transgenic mice that developed signs of illness we found CD5 + CD23 + B-cell population.
Our BrdU incorporation experiments show that B-CLL cells of TCL1 transgenics are actively dividing. These data are consistent with recent reports showing that accumulation of malignant CD5 + B cells in human B-CLL is caused not only by impaired apoptosis but also by cell proliferation of B-CLL cells.3-5 As we previously reported that Tcl1 functions as a co-activator of Akt,19 we analyzed Akt status in mouse B-CLL cells. Using a fluorescence-activated cell sorting-based approach, we were able to study Akt activation exclusively in CD5 + CD19 + cells. Our results show that Akt is indeed abnormally activated in mouse B-CLL.
Immune incompetence and a progressive severe hypogammaglobulinemia are very important characteristics of human B-CLL.6 We analyzed serum levels of immunoglobulins and the immune response to SRBC antigen in the serum of TCL1 transgenics and wild-type siblings. We found that in TCL1 transgenics levels of immunoglobulins were severely decreased and immune response to SRBC antigen was drastically decreased.
In summary, our results uncovered several previously unknown features of Tcl1-driven B-CLL: Akt activation, cell proliferation, immune incompetence, hypogammaglobulinemia and impaired production of cytokines. All these results indicate that TCL1 transgenics closely mimic human B-CLL.
Acknowledgements
The research was supported by an ACS Research Scholar grant (Y Pekarsky).
Footnotes
Conflict of interest
The authors declare no conflict of interest.
References
- 1.Sgambati M, Linet M, Devesa S. Chronic lymphocytic leukemia, epidemiological, familial, and genetic aspects. In: Cheson B, editor. Chronic Lymphocytic Leukemias. 2nd. Marcel Dekker, Inc.; New York: 2001. pp. 33–62. revised and expanded. [Google Scholar]
- 2.Bullrich F, Croce C. Molecular Biology of Chronic Lymphocytic Leukemia. In: Cheson B, editor. Chronic Lymphocytic Leukemias. 2nd. Marcel Dekker, Inc.; New York: 2001. pp. 9–32. revised and expanded. [Google Scholar]
- 3.Chiorazzi N. Cell proliferation and death: forgotten features of chronic lymphocytic leukemia B cells. Best Pract Res Clin Haematol. 2007;20:399–413. doi: 10.1016/j.beha.2007.03.007. [DOI] [PubMed] [Google Scholar]
- 4.Messmer BT, Messmer D, Allen SL, Kolitz JE, Kudalkar P, Cesar D, et al. In vivo measurements document the dynamic cellular kinetics of chronic lymphocytic leukemia B cells. J Clin Invest. 2005;115:755–764. doi: 10.1172/JCI23409. [DOI] [PMC free article] [PubMed] [Google Scholar]
- 5.Sieklucka M, Pozarowski P, Bojarska-Junak A, Hus I, Dmoszynska A, Rolinski J. Apoptosis in B-CLL: the relationship between higher ex vivo spontaneous apoptosis before treatment in III-IV Rai stage patients and poor outcome. Oncol Rep. 2008;19:1611–1620. [PubMed] [Google Scholar]
- 6.Caligaris-Cappio F, Hamblin TJ. B-cell chronic lymphocytic leukemia: a bird of a different feather. J Clin Oncol. 1999;17:399–408. doi: 10.1200/JCO.1999.17.1.399. [DOI] [PubMed] [Google Scholar]
- 7.Bojarska-Junak A, Rolinski J, Wasik-Szczepaneko E, Kaluzny Z, Dmoszynska A. Intracellular tumor necrosis factor production by T- and B-cells in B-cell chronic lymphocytic leukemia. Haematologica. 2002;87:490–499. [PubMed] [Google Scholar]
- 8.Pekarsky Y, Zanesi N, Aqeilan R, Croce CM. Tcl1 as a model for lymphomagenesis. Hematol Oncol Clin North Am. 2004;18:863–879. doi: 10.1016/j.hoc.2004.04.007. [DOI] [PubMed] [Google Scholar]
- 9.Virgilio L, Narducci MG, Isobe M, Billips LG, Cooper MD, Croce CM, et al. Identification of the TCL1 gene involved in T-cell malignancies. Proc Natl Acad Sci USA. 1994;91:12530–12534. doi: 10.1073/pnas.91.26.12530. [DOI] [PMC free article] [PubMed] [Google Scholar]
- 10.Teitell MA. The TCL1 family of oncoproteins: co-activators of transformation. Nat Rev Cancer. 2005;5:640–648. doi: 10.1038/nrc1672. [DOI] [PubMed] [Google Scholar]
- 11.Bichi R, Shinton SA, Martin ES, Koval A, Calin GA, Cesari R, et al. Human chronic lymphocytic leukemia modeled in mouse by targeted TCL1 expression. Proc Natl Acad Sci USA. 2002;99:6955–6960. doi: 10.1073/pnas.102181599. [DOI] [PMC free article] [PubMed] [Google Scholar]
- 12.Pekarsky Y, Santanam U, Cimmino A, Palamarchuk A, Efanov A, Maximov V, et al. Tcl1 expression in chronic lymphocytic leukemia is regulated by miR-29 and miR-181. Cancer Res. 2006;66:11590–11593. doi: 10.1158/0008-5472.CAN-06-3613. [DOI] [PubMed] [Google Scholar]
- 13.Herling M, Patel KA, Khalili J, Schlette E, Kobayashi R, Medeiros LJ, et al. TCL1 shows a regulated expression pattern in chronic lymphocytic leukemia that correlates with molecular subtypes and proliferative state. Leukemia. 2006;20:280–285. doi: 10.1038/sj.leu.2404017. [DOI] [PubMed] [Google Scholar]
- 14.Monaghan SA, Peterson LC, James C, Marszalek L, Khoong A, Bachta DJ, et al. Pan B-cell markers are not redundant in analysis of chronic lymphocytic leukemia (CLL) Cytometry B Clin Cytom. 2003;56:30–42. doi: 10.1002/cyto.b.10049. [DOI] [PubMed] [Google Scholar]
- 15.DiRaimondo F, Albitar M, Huh Y, O’Brien S, Montillo M, Tedeschi A, et al. The clinical and diagnostic relevance of CD23 expression in the chronic lymphoproliferative disease. Cancer. 2002;94:1721–1730. doi: 10.1002/cncr.10401. [DOI] [PubMed] [Google Scholar]
- 16.Pathan NI, Chu P, Hariharan K, Cheney C, Molina A, Byrd J. Mediation of apoptosis by and antitumor activity of lumiliximab in chronic lymphocytic leukemia cells and CD23+ lymphoma cell lines. Blood. 2008;111:1594–1602. doi: 10.1182/blood-2007-03-082024. [DOI] [PubMed] [Google Scholar]
- 17.Cardinaud B, Moreilhon C, Marcet B, Robbe-Sermesant K, LeBrigand K, Mari B, et al. miR-34b/miR-34c: a regulator of TCL1 expression in 11q-chronic lymphocytic leukaemia? Leukemia. 2009;23:2174–2177. doi: 10.1038/leu.2009.125. [DOI] [PubMed] [Google Scholar]
- 18.Palamarchuk A, Zanesi N, Aqeilan RI, Aqeilan RI, Croce CM, Pekarsky Y. Tal1 transgenic expression reveals absence of B lymphocytes. Cancer Res. 2006;66:6014–6017. doi: 10.1158/0008-5472.CAN-06-0937. [DOI] [PubMed] [Google Scholar]
- 19.Pekarsky Y, Koval A, Hallas C, Bichi R, Tresini M, Malstrom S, et al. Tcl1 enhances Akt kinase activity and mediates its nuclear translocation. Proc Natl Acad Sci USA. 2000;97:3028–3033. doi: 10.1073/pnas.040557697. [DOI] [PMC free article] [PubMed] [Google Scholar]
- 20.Calin GA, Liu CG, Sevignani C, Ferracin M, Felli N, Dumitru CD, et al. MicroRNA profiling reveals distinct signatures in B cell chronic lymphocytic leukemias. Proc Natl Acad Sci USA. 2004;101:11755–11760. doi: 10.1073/pnas.0404432101. [DOI] [PMC free article] [PubMed] [Google Scholar]
- 21.Calin GA, Ferracin M, Cimmino A, Di Leva G, Shimizu M, Wojcik SE, et al. A microRNA signature associated with prognosis and progression in chronic lymphocytic leukemia. N Engl J Med. 2005;353:1793–1801. doi: 10.1056/NEJMoa050995. [DOI] [PubMed] [Google Scholar]


