

Abstract
Background and objectives
High levels of fibroblast growth factor 23 are associated with accelerated progression of CKD. Whether high fibroblast growth factor 23 levels also predict incident CKD is uncertain.
Design, setting, participants, & measurements
A prospective case-cohort study was conducted within the Action to Control Cardiovascular Risk in Diabetes Trial. The analytic sample consisted of a random subcohort of 590 patients with type 2 diabetes without prevalent CKD at baseline, 124 of whom developed incident CKD during follow-up, and 520 additional patients with incident CKD outside the random subcohort. The association between serum intact fibroblast growth factor 23 and incident CKD, defined as the new onset of eGFR<60 ml/min per 1.73 m2 that represented a ≥25% decrease from baseline in an individual with eGFR≥60 ml/min per 1.73 m2 and no microalbuminuria (<30 mg/g creatinine) at baseline, was tested.
Results
The mean baseline eGFR in the random subcohort was 90.9±22.7 ml/min per 1.73 m2. During a median follow-up of 4.7 years, there was a total of 644 patients with incident CKD. The median baseline fibroblast growth factor 23 level was modestly higher among patients with incident CKD versus controls (43.5, interquartile range=34.7–55.1 versus 39.8, interquartile range=31.9–49.5 pg/ml; P<0.001). Higher baseline fibroblast growth factor 23 levels were associated with higher risk of incident CKD in unadjusted and demographics-adjusted models, but the effect was attenuated after additional adjustment for clinical risk factors and baseline eGFR (hazard ratio per SD of natural log fibroblast growth factor 23, 1.09; 95% confidence interval, 0.94 to 1.27), which was the strongest predictor of incident CKD. Consistent with the results of primary analyses, baseline fibroblast growth factor 23 was not associated with eGFR slope.
Conclusions
Higher fibroblast growth factor 23 levels are not independently associated with higher risk of incident CKD in patients with type 2 diabetes.
Keywords: CKD, diabetes, diabetic nephropathy
Introduction
CKD confers high risks of ESRD, cardiovascular disease, and death (1,2). Most proven approaches to decrease the public health and individual patient burden of CKD have focused on treatment of established disease. Effective strategies are needed to avert onset of CKD. These efforts require identification of novel pathogenic mechanisms that could be targeted for preventative interventions in patients who are at the highest risk of developing CKD.
Among patients with established CKD, elevated levels of the phosphate-regulating hormone, fibroblast growth factor 23 (FGF23), are independently associated with higher risk of ESRD, left ventricular hypertrophy, cardiovascular disease, and mortality (3–11). Because FGF23 levels rise early in CKD (12), high FGF23 levels may predate the onset of clinically detectable reductions in eGFR. If so, FGF23 could serve as a novel screening test for CKD, with high levels acting as either a biomarker of subclinical kidney disease not yet reflected in a reduced eGFR or a novel mechanism of direct kidney injury, akin to its purported pathogenic effects in the myocardium (13). To date, however, few studies have examined FGF23 in individuals who are at risk of developing CKD but who are initially free of clinically evident disease.
Type 2 diabetes is the leading cause of CKD in the United States (14,15). It is a robust model for studying risk factors for incident CKD because of the high frequency of events; also, the development of diabetic nephropathy often follows a predictable pattern (16). Although there are sparse reports of differences in serum phosphate and FGF23 levels among patients with and without diabetes (17–19), no studies have examined FGF23 as a risk factor for incident CKD in type 2 diabetes. Using a case-cohort study design nested within the Action to Control Cardiovascular Risk in Diabetes (ACCORD) Trial of 10,251 patients with type 2 diabetes, we measured FGF23 in banked serum samples from the baseline visit in 1110 participants in the ACCORD Trial to test the hypothesis that higher FGF23 levels are independently associated with incident CKD.
Materials and Methods
Population of the Parent Study
The ACCORD Trial compared the effects of intensive versus standard glycemic control and fibrates versus placebo or intensive versus standard BP control on major cardiovascular disease events in 10,251 patients with type 2 diabetes (20). Participants were recruited at 77 centers across the United States and Canada. Inclusion criteria were hemoglobin (Hb) A1c≥7.5% and age 40–79 years with a history of cardiovascular disease or age 55–79 years with evidence of microalbuminuria (≥30 mg/g creatinine), atherosclerosis, left ventricular hypertrophy, or two or more cardiovascular disease risk factors. Exclusion criteria were recent serious hypoglycemic events, unwillingness to monitor glucose or inject insulin, body mass index (BMI)>45 kg/m2, other serious illness, or serum creatinine >1.5 mg/dl. Randomization occurred from 2001 to 2005, and after a mean treatment period of 3.7 years, the intensive glycemia intervention was stopped in 2008 because of increased all-cause mortality (21). The lipid and BP interventions were completed in 2009. Serum creatinine measurements were obtained every 4 months during the first 1 year of follow-up and annually thereafter (22). Written informed consent was obtained from all participants in the ACCORD Trial, and Institutional Review Board approval was obtained at all sites.
Population of the Nested Case-Cohort Study
We used a case-cohort study design (23,24). The source population was comprised of participants in the ACCORD Trial who had stored baseline serum samples and were not randomized to fenofibrate, because this medication affects serum creatinine assays (25,26). From this source population of 5538 participants, we selected a random subcohort of 850 individuals (Figure 1). Within the subcohort, 260 participants had prevalent CKD, which was defined as baseline eGFR (estimated by the Modification of Diet in Renal Disease [MDRD] equation)<60 ml/min per 1.73 m2 or microalbuminuria (≥30 mg/g creatinine). These participants were excluded.
Figure 1.

Sampling strategy for the case-cohort study design. We selected a random subcohort of 850 participants in the Action to Control Cardiovascular Risk in Diabetes Trial (represented by the box shaded in dark gray) who were not randomized to fenofibrate, had baseline eGFR measurements, and had stored serum samples available for fibroblast growth factor 23 testing. After excluding 260 participants in the subcohort with prevalent CKD, there were 124 patients with incident CKD and 466 controls in the subcohort. All remaining 520 patients with incident CKD were selected from outside the subcohort. The total analytic sample for the case-cohort study of incident CKD included 1110 participants (represented in boxes shaded in light gray). In addition to excluding 260 participants with prevalent CKD, we did not study 4168 individuals who did not develop incident CKD.
We defined incident CKD as new-onset eGFR<60 ml/min per 1.73 m2 detected at a follow-up visit that also represented a ≥25% decrease from baseline in an individual with eGFR≥60 ml/min per 1.73 m2 and no microalbuminuria (<30 mg/g creatinine) at baseline. To avoid inappropriate ascertainment of incident CKD on the basis of early and reversible changes in kidney function that were likely caused by acute hemodynamic effects of the trial interventions (27), we used eGFR from the fourth month postrandomization visit as the baseline eGFR value. There were 124 participants who developed incident CKD within the subcohort. We sampled the remaining 520 patients with incident CKD outside the subcohort to reach a total of 644 patients with incident CKD. The total analytic sample included 1110 participants in the ACCORD Trial representing those from the random subcohort without prevalent CKD at baseline plus all of the additional cases outside the subcohort (Figure 1). The final study population enabled us to detect a hazard ratio (HR) for incident CKD between referent and comparator quartiles of FGF23 as small as 1.43 with 80% power and 5% two-sided α.
Measurements and Covariate Assessments
We used stored baseline frozen serum samples, shipped cold within 24 hours of collection, to measure FGF23 with an intact assay (Kainos Laboratories, Tokyo, Japan) that exclusively detects the intact hormone, because the two epitopes recognized by the ELISA flank the proteolytic cleavage site of FGF23 (28). Personnel at the University of Washington Northwest Lipid Metabolism and Diabetes Research Laboratory, who were blinded to CKD case or control status, ran all samples in duplicate after a single freeze-thaw cycle with intra- and interassay coefficients of variation <4%. Mean values are reported. Serum creatinine was measured using the Roche Creatinine Plus enzymatic method on a Modular P analyzer with coefficients of variation <2.5%. Urine creatinine was determined enzymatically on a Roche Double Modular P Analytics automated analyzer. Urine albumin was determined by immunonephelometry on a Siemens BN II nephelometer. Serum phosphate measurements were performed on a Roche Modular P chemistry analyzer. With the exception of serum creatinine and eGFR, which were performed at the month 4 follow-up visit, all laboratory measurements and other covariates were ascertained at the prerandomization baseline visit.
Statistical Analyses
We examined baseline characteristics of study participants by quartiles of FGF23 levels and incident CKD status. Because the distribution of FGF23 levels was right-skewed, we natural log (ln)–transformed it for analyses on the continuous scale. We identified predictors of baseline ln FGF23 using linear regression. We used unadjusted and multivariable-adjusted Cox proportional hazards models modified for the case-cohort design (29) to analyze time-to-incident CKD according to baseline FGF23 levels expressed as a continuous variable with HRs calculated per SD increment of ln FGF23 and in quartiles, defined by distribution in the random subcohort. For each participant, the observation period was censored at the last surveillance visit if incident CKD had not developed. Because we could not ascertain the exact time between regularly scheduled follow-up study visits when eGFR declined to a level below the threshold to be considered a case of incident CKD, we assigned the event time using the midpoint between the study visit when criteria for incident CKD were first met and the most recent prior study visit (30). We sequentially adjusted multivariable models for demographic covariates (age, sex, race, and ethnicity), month 4 eGFR, other risk factors for CKD (BP, smoking, diabetes duration, HbA1C, and BMI), use of renoprotective medications (angiotensin-converting enzyme inhibitors and angiotensin receptor blockers), glycemic control intervention arm, and level of serum phosphate. We performed stratified analyses by baseline eGFR. We used multiplicative interaction terms to test for effect modification. Additional models included further adjustments for baseline eGFR instead of and in addition to month 4 eGFR and adjustments for baseline urinary albumin-to-creatinine ratio (UACR), history of any cardiovascular disease, and randomized BP intervention.
We performed a sensitivity analysis, in which we adjusted for eGFR using estimates from the CKD Epidemiology Collaboration (CKD-EPI) equation instead of the MDRD equation (31). To account for the modest amount of missing covariate data (smoking=8%, diabetes duration=6%, systolic BP<1%, and BMI<1%), we repeated our main analyses after imputing missing data using multiple imputation with five imputed datasets. To better understand the effects of FGF23, phosphate, and eGFR on the risk of incident CKD, we generated plots of splines-based HR curves, taking a specific predictor value as reference. Finally, we used linear mixed effects models with random intercepts and slopes to generate patient-specific eGFR slopes within the random subcohort (n=590). We tested the association of baseline FGF23 (continuous) with eGFR slope and compared slopes across quartiles of baseline FGF23. The R package smoothHR was used to compute the pointwise estimates of the log-transformed HRs and their corresponding 95% confidence limits. All other analyses were performed with SAS 9.3 (SAS Institute, Cary, NC). All statistical tests were two-sided, and P values <0.05 were considered significant.
Results
The ACCORD population consisted of middle-aged and older patients with poorly controlled type 2 diabetes of long duration and multiple complications (21). The characteristics of 590 randomly selected subcohort participants without CKD at baseline (Table 1) and the full sample of 1110 participants (Supplemental Table 1) were qualitatively similar to those of the overall ACCORD population (21). Compared with participants with baseline FGF23 levels in the lowest quartile of the subcohort, participants with higher FGF23 levels in the random subcohort were more often women, had higher systolic BP and BMI, and had longer duration of diabetes. Serum creatinine and phosphate levels were modestly higher in participants with higher FGF23 levels, whereas eGFR was lower in those with higher FGF23 levels. In a multivariable model that included demographics and clinical factors, the top three determinants of higher baseline FGF23 levels were higher serum phosphate, lower eGFR, and higher BMI (Supplemental Table 2).
Table 1.
Baseline characteristics of subcohort participants according to quartiles of fibroblast growth factor 23
| Variable | Fibroblast Growth Factor 23, pg/ml | ||||
|---|---|---|---|---|---|
| All Participants (40.0; n=590) | Quartile 1 (<31.9; n=150) | Quartile 2 (31.9–39.9; n=147) | Quartile 3 (40.0–50.2; n=146) | Quartile 4 (≥50.3; n=147) | |
| Age, yr | 61.8±6.3 | 61.8±5.8 | 61.0±6.6 | 61.8±6.3 | 62.6±6.5 |
| Women (%) | 46.0 | 42.7 | 38.8 | 47.3 | 53.7 |
| Black (%) | 18.8 | 21.3 | 19.7 | 18.5 | 15.6 |
| Hispanic (%) | 4.4 | 5.3 | 6.1 | 3.4 | 2.7 |
| Hypertension (%) | 88.6 | 86.7 | 85.0 | 92.0 | 91.2 |
| History of stroke (%) | 5.8 | 8.0 | 5.4 | 4.8 | 4.8 |
| History of myocardial infarction (%) | 14.8 | 17.3 | 15.0 | 15.8 | 10.8 |
| History of heart failure (%) | 6.3 | 8.1 | 7.6 | 6.2 | 3.4 |
| Current smoking (%) | 11.7 | 10.7 | 17.0 | 11.6 | 7.5 |
| Body mass index, kg/m2 | 32.3±5.7 | 31.9±5.3 | 31.1±5.8 | 32.7±5.4 | 33.6±5.9 |
| Systolic BP, mmHg | 134.4±16.2 | 134.1±16.5 | 133.6±15.8 | 135.0±15.8 | 135.0±16.8 |
| Diabetes duration, yr | 10 (5–14) | 7 (4–12) | 10 (5–17) | 10 (6–14) | 10 (6–15) |
| Medication use (%) | |||||
| Aspirin | 54.6 | 54.7 | 53.1 | 55.5 | 55.1 |
| β-Blockers | 27.8 | 24.0 | 22.5 | 30.1 | 34.7 |
| Statins | 63.1 | 55.3 | 68.0 | 64.4 | 64.6 |
| ACEIs | 51.0 | 52.0 | 46.3 | 56.9 | 49.0 |
| Angiotensin receptor blockers | 18.3 | 14.7 | 15.7 | 21.0 | 22.5 |
| Insulin | 34.8 | 28.0 | 35.4 | 38.4 | 37.4 |
| Thiazolidinediones | 19.7 | 18.7 | 15.0 | 22.2 | 23.0 |
| Sulfonylureas | 51.0 | 53.3 | 52.4 | 47.3 | 51.0 |
| Laboratory results | |||||
| Hemoglobin A1C (%) | 8.2±1.0 | 8.3±1.2 | 8.2±0.9 | 8.2±0.9 | 8.1±0.9 |
| Creatinine, mg/dl | 0.86±0.18 | 0.84±0.20 | 0.86±0.18 | 0.87±0.18 | 0.87±0.16 |
| eGFR, ml/min per 1.73 m2 | 90.9±22.7 | 96.4±31.7 | 92.3±19.6 | 89.2±18.9 | 85.5±15.9 |
| UACR, mg/g | 8.2 (5.5–13.6) | 8.8 (6.1–12.8) | 7.9 (5.1–13.2) | 8.3 (5.6–13.7) | 8.2 (5.3–14.0) |
| Phosphate, mg/dl | 3.4±0.5 | 3.3±0.5 | 3.4±0.5 | 3.5±0.5 | 3.6±0.5 |
Values are percentages, means±SDs, or medians (interquartile ranges). Serum creatinine and eGFR values are from the month 4 follow-up visit. ACEIs, angiotensin-converting enzyme inhibitors; UACR, urine albumin-to-creatinine ratio.
The mean baseline eGFR in the subcohort was 90.9±22.7 ml/min per 1.73 m2. During a median follow-up of 4.7 years, 124 of 590 subcohort participants without prevalent CKD developed incident CKD (47.3/1000 person-years). The average eGFR slope within the subcohort was −1.6 ml/min per 1.73 m2 per year (95% confidence interval, −1.9 to −1.3), and eGFR declined progressively during follow-up (Figure 2). The median times to incident CKD among 124 cases within the subcohort and 520 additional cases were comparable (2.7 versus 2.6 years; P>0.05).
Figure 2.
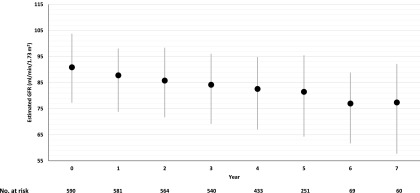
eGFR over time in 590 participants in the Action to Control Cardiovascular Risk in Diabetes Trial subcohort. Mean absolute follow-up values are shown (black circles). Error bars (gray vertical lines) indicate interquartile ranges.
Compared with controls, patients with incident CKD were slightly older, had higher BP and BMI, and had lower baseline eGFR (Table 2). Greater proportions of patients were women and individuals of white race. Median FGF23 levels were significantly higher among individuals who developed incident CKD (43.5 pg/ml; interquartile range=34.7–55.1 pg/ml) versus controls (39.8 pg/ml; interquartile range=31.9–49.5 pg/ml; P<0.001), but the difference was modest.
Table 2.
Baseline characteristics of patients with incident CKD and controls
| Variable | Patients with Incident CKD (n=644) | Controls (n=466) | P Value |
|---|---|---|---|
| Age, yr | 63.1±6.4 | 61.4±6.2 | <0.001 |
| Women (%) | 54.0 | 44.4 | 0.002 |
| Black (%) | 14.6 | 19.1 | 0.05 |
| Hispanic (%) | 5.0 | 4.7 | 0.85 |
| Hypertension (%) | 93.5 | 87.6 | 0.001 |
| Current smoking (%) | 7.6 | 13.5 | 0.001 |
| Body mass index, kg/m2 | 33.1±5.4 | 32.1±5.7 | 0.002 |
| Systolic BP, mmHg | 136.3±17.5 | 134.2±15.6 | 0.04 |
| Diabetes duration, yr | 9 (5–14) | 10 (5–14) | 0.82 |
| Hemoglobin A1C, % | 8.3±1.0 | 8.1±1.0 | 0.06 |
| Creatinine, mg/dl | 0.90±0.2 | 0.84±0.2 | <0.001 |
| eGFR, ml/min per 1.73m2 | 81.2±13.1 | 93.7±24.0 | <0.001 |
| Urine albumin-to-creatinine ratio, mg/g | 9.3 (5.9–15.7) | 8.0 (5.4–12.9) | 0.004 |
| Phosphate, mg/dl | 3.5±0.5 | 3.4±0.5 | 0.03 |
| Fibroblast growth factor 23, pg/ml | 43.5 (34.7–55.1) | 39.8 (31.9–49.5) | <0.001 |
Values are percentages, means±SDs, or medians (interquartile ranges). Serum creatinine and eGFR values are from the month 4 follow-up visit.
Higher levels of baseline FGF23 were associated with higher risk of incident CKD in unadjusted and demographics-adjusted analyses of FGF23 on a continuous scale or in quartiles (Table 3). However, additional adjustments that included eGFR attenuated the association (Table 3). In the final models, eGFR was the strongest statistical predictor of incident CKD (Figure 3), with a chi-squared statistic (as a measure of the strength of association) that was 10-fold greater than that of HbA1C, which was the second most powerful independent predictor. Serum FGF23 and phosphate levels were not associated with risk of incident CKD in the final models (Figure 3).
Table 3.
Fibroblast growth factor 23 level at baseline and risk of incident CKD
| Model | n (Total) | n (Cases) | FGF23, pg/ml | |||||||||
|---|---|---|---|---|---|---|---|---|---|---|---|---|
| Per 1 SD Increase of ln FGF23 | Quartile 1 (<31.9) | Quartile 2 (31.9–39.9) | Quartile 3 (40.0–50.2) | Quartile 4 (≥50.3) | ||||||||
| HR | 95% CI | P value | HR | 95% CI | HR | 95% CI | HR | 95% CI | ||||
| Unadjusted | 1110 | 644 | 1.26 | 1.11 to 1.43 | <0.001 | Reference | 1.08 | 0.78 to 1.50 | 1.47 | 1.06 to 2.03 | 1.81 | 1.33 to 2.48 |
| Adjusted for demographics | 1110 | 644 | 1.22 | 1.08 to 1.39 | 0.002 | Reference | 1.13 | 0.81 to 1.57 | 1.45 | 1.04 to 2.02 | 1.65 | 1.20 to 2.28 |
| Adjusted for demographics and eGFR | 1110 | 644 | 1.15 | 1.00 to 1.32 | 0.05 | Reference | 1.01 | 0.71 to 1.43 | 1.22 | 0.85 to 1.73 | 1.28 | 0.91 to 1.81 |
| Adjusted for demographics, eGFR, BP, smoking, diabetes duration, HbA1C, and BMI | 953 | 565 | 1.10 | 0.95 to 1.28 | 0.19 | Reference | 1.10 | 0.74 to 1.62 | 1.21 | 0.83 to 1.76 | 1.25 | 0.85 to 1.83 |
| Adjusted for demographics, eGFR, BP, smoking, diabetes duration, HbA1C, BMI, glycemic control arm, and ACEIs/ARBs | 953 | 565 | 1.11 | 0.95 to 1.28 | 0.18 | Reference | 1.07 | 0.73 to 1.59 | 1.20 | 0.82 to 1.76 | 1.25 | 0.85 to 1.82 |
| Adjusted for demographics, eGFR, BP, smoking, diabetes duration, HbA1C, BMI, glycemic control arm, ACEIs/ARBs, and serum phosphate | 953 | 565 | 1.09 | 0.94 to 1.27 | 0.25 | Reference | 1.06 | 0.72 to 1.57 | 1.18 | 0.81 to 1.73 | 1.20 | 0.81 to 1.76 |
HbA1C, hemoglovin A1C; BMI, body mass index; ACEI, angiotensin-converting enzyme inhibitors; ARBs, angiotensin receptor blockers; HR, hazard ratio; ln, natural log; FGF23, fibroblast growth factor 23; 95% CI, 95% confidence interval.
Figure 3.

Nonparametric estimates of the relationships between fibroblast growth factor 23 (FGF23), serum phosphate, and eGFR on the risk of incident CKD. In A, the lowest value of FGF23 level in the highest FGF23 quartile (50 pg/ml) is the reference value (hazard ratio=1.0). In B, the lowest value of phosphate in the highest phosphate quartile (3.8 mg/dl) is the reference value (hazard ratio=1.0). In C, the lowest value of eGFR in the highest eGFR quartile (91.8 ml/min per 1.732) is the reference value (hazard ratio=1.0). The solid black lines represent the nonlinear relationships between predictors and incident CKD adjusted for age, sex, race, ethnicity, month 4 eGFR, BP, smoking, diabetes duration, hemoglobin A1C, body mass index, use of angiotensin-converting enzyme inhibitors and angiotensin receptor blockers, glycemic control arm, and level of serum phosphate. The dashed lines indicate 95% confidence limits.
Although formal tests for interaction did not reveal significant effect modification by eGFR or other covariates, because eGFR was the strongest confounder of the relationship between FGF23 and incident CKD, we examined models stratified by categories of eGFR. In unadjusted stratified models, baseline FGF23 was significantly associated with risk of incident CKD only among participants with eGFR≥90 ml/min per 1.73 m2, but additional adjustment yielded no significant associations in any stratum (data not shown). Similarly, adjustment for baseline eGFR in addition to or instead of eGFR at the month 4 follow-up visit did not change the results, and models adjusted for UACR, CKD-EPI eGFR, or the randomized BP intervention arm also did not change results (Table 4). The results were unchanged in sensitivity analyses that accounted for missing data. Adjusted linear mixed effects models confirmed no significant associations of baseline FGF23 with change from baseline in eGFR over time (P for baseline ln FGF23×time interaction=0.26), and there were no significant differences in patient-specific eGFR slopes according to baseline FGF23 quartile (Figure 4) (P=0.51).
Table 4.
Associations of fibroblast growth factor 23 with incident CKD in sensitivity analyses
| Analyses | Per 1 SD Increase of ln FGF23 | ||
|---|---|---|---|
| Hazard Ratio | 95% Confidence Interval | P value | |
| 1. Main analysis of all participants (Table 3) | 1.09 | 0.94 to 1.27 | 0.25 |
| 2. Adjusted for prerandomization MDRD eGFR instead of month 4 MDRD eGFR | 1.07 | 0.92 to 1.24 | 0.38 |
| 3. Adjusted for prerandomization MDRD eGFR in addition to month 4 MDRD eGFR | 1.07 | 0.92 to 1.25 | 0.38 |
| 4. Adjusted for month 4 CKD-EPI eGFR instead of month 4 MDRD eGFR | 1.10 | 0.95 to 1.27 | 0.21 |
| 5. Adjusted for prerandomization CKD-EPI eGFR and month 4 CKD EPI eGFR | 1.08 | 0.93 to 1.25 | 0.33 |
| 6. Adjusted for baseline urine albumin-to-creatinine ratio | 1.09 | 0.93 to 1.26 | 0.29 |
| 7. Adjusted for history of any cardiovascular disease at baseline | 1.09 | 0.94 to 1.27 | 0.25 |
| 8. Adjusted for randomized BP intervention | 1.12 | 0.95 to 1.31 | 0.18 |
Main analysis results are from the fully adjusted models that included the following covariates:
age, sex, race, ethnicity, month 4 eGFR, BP, smoking, diabetes duration, hemoglobin A1C, body mass index, use of angiotensin-converting enzyme inhibitors and angiotensin receptor blockers, glycemic control arm, and level of serum phosphate. MDRD, Modification of Diet in Renal Disease; CKD-EPI, CKD Epidemiology Collaboration; ln, natural log; FGF23, fibroblast growth factor 23.
Figure 4.
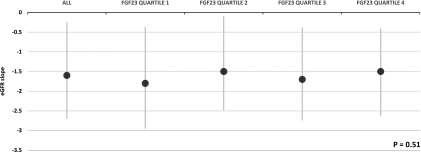
eGFR slopes in all 590 subcohort participants and according to FGF23 quartile. Mean slope values are shown (black circles). Error bars (gray vertical lines) indicate interquartile ranges. P value is for comparison across FGF23 quartiles.
Discussion
This prospective study of patients with type 2 diabetes evaluated the relationship of baseline FGF23 levels and risk of subsequent incident CKD during a median follow-up period of 4.7 years. Higher levels of baseline FGF23 were significantly associated with higher risk of incident CKD only in unadjusted and demographics-adjusted models. These associations were attenuated by additional adjustment for eGFR, which was the strongest predictor of risk of incident CKD in fully adjusted models. In secondary analyses, baseline FGF23 was not associated with eGFR slope. These results suggest that higher FGF23 is not independently associated with higher risk of incident CKD in type 2 diabetes.
Research into risk factors for incident CKD is hindered by lack of a gold standard CKD test. As a study end point, incident CKD is often defined by a certain magnitude of reduction in eGFR or when an absolute eGFR threshold is traversed. Because baseline eGFR is so strongly related to rate of CKD progression, a “horse-racing” effect can be introduced (32), where individuals with lower baseline eGFR have a head start that enables them to cross the finish line of incident CKD sooner. As a result, it is difficult for candidate biomarkers that correlate with eGFR to show independent effects in models that adjust for baseline eGFR. Although it is tempting to argue that this phenomenon may have driven the null results of this study or that adjusting analyses of FGF23 for eGFR may be an overadjustment, because they share a common causal pathway to incident CKD, it is important to emphasize that we observed a minute difference in FGF23 levels between patients with incident CKD and controls of <4 pg/ml in unadjusted analyses. Similarly, there were no significant difference in patient-specific eGFR slopes according to baseline FGF23 quartile. These data support our main conclusion that elevated FGF23 is not an independent risk factor for new-onset CKD in type 2 diabetes.
Our results differ from a prior 24-month study of 307 older women, in whom 63 women developed incident CKD that was defined as a reduction of eGFR to <60 ml/min per 1.73 m2 (33). Each 1 SD increase in baseline FGF23 was independently associated with a 1.5-fold higher risk of incident CKD. The association strengthened when a stricter definition of incident CKD was applied, but this yielded only 23 events, whereas the multivariable model included 20 covariates. In contrast, using an efficient case-cohort design, we evaluated patients with type 2 diabetes who clinically would not be labeled as having CKD at baseline and developed more stringently defined incident CKD at a high rate of 47.3 events per 1000 person-years. This allowed us to study a large number of events using robust definitions of disease among high-risk individuals while simultaneously adjusting for potential confounders. Nonetheless, a limitation of our study is that we only oversampled cases using one definition, in which criteria for incident CKD could be met on basis of a single measurement of follow-up eGFR. This precluded us from testing the relationships between baseline FGF23 and incident albuminuria or other definitions of incident CKD, including those that incorporate serial eGFR measurements (34). However, results from a sensitivity analysis that showed lack of association between FGF23 and eGFR slope support our main findings.
Another limitation is the relatively wide confidence intervals around the point estimates of incident CKD, which were not significant but trended in the direction of higher risk in association with higher FGF23. Therefore, we cannot definitively exclude the possibility that we failed to detect a small but clinically meaningful association between higher FGF23 and incident CKD. We were also unable to test whether a high prevalence of competing events, such as death, led us to underestimate the association between FGF23 and incident CKD (35). Additionally, the generalizability of our findings to different etiologies of CKD may be limited by the high burden of comorbidities in participants in the ACCORD Trial, which could have overwhelmed an effect of FGF23 that may be relevant in populations with fewer risk factors. Finally, dyssynchronous assessments of baseline eGFR and FGF23 because of a lack of stored samples at the month 4 follow-up visit may have affected our ability to detect associations. In support of our conclusions, the results did not change, regardless of whether we adjusted for eGFR using the month 4 or month 0 prerandomization values.
Another study analyzed FGF23 and risk of incident CKD and ESRD during 21 years of follow-up in the large and racially diverse Atherosclerosis Risk in Communities (ARIC) Study (36). Higher baseline FGF23 was weakly associated with higher risk of incident CKD, but the results were only of borderline significance, and the models excluded UACR, which is a known risk factor (37). In contrast, higher baseline FGF23 was independently associated with higher risk of incident ESRD in models that adjusted for baseline eGFR and analyses that were restricted to participants with baseline eGFR>90 ml/min per 1.73 m2. These results align with the body of literature that shows that elevated FGF23 levels are independently associated with more rapid progression of established CKD to ESRD (4,8–10). Possible underlying mechanisms may include enhanced FGF23-mediated phosphaturia in CKD that exposes remaining tubules to potentially toxic phosphate concentrations, negative effects of calcitriol and klotho deficiency, or perhaps, direct profibrotic effects of FGF23 that accelerate tubulointerstitial fibrosis after it is established by an underlying kidney disease (38–40). Mechanistic studies are needed to test these possibilities.
The lack of CKD in primary disorders of FGF23 excess, in which FGF23 levels are much higher than those observed in the ACCORD Trial and the ARIC Study, suggests that elevated FGF23 is unable to initiate kidney disease. When elevated FGF23 did register as an independent predictor of incident CKD in other studies, it was likely acting as a biomarker of subclinical kidney injury rather than a causal factor. In aggregate, the far less robust results for incident CKD compared with incident ESRD in prior studies along with the null findings that we report in this study suggest that elevated FGF23 may promote progression of established CKD but does not induce de novo kidney injury.
Disclosures
T.I. has received honoraria from Bayer. M.W. has received research support, honoraria, or consultant fees from Amgen, Bayer, Genzyme, Keryx, Luitpold, Opko, Pfizer, Shire, and Vifor.
Supplementary Material
Acknowledgments
This study was supported by Grants from the National Institute of Diabetes and Digestive and Kidney Diseases; K23-DK081673 (to T.I.), R01-DK081374 (to M.W.), and K24-DK093723 (to M.W.). The ACCORD trial was supported by National Heart Lung and Blood Institute contracts N01- HC-95178, N01-HC-95179, N01-HC-95180, N01-HC-95181, N01-HC-95182, N01- HC-95183, N01-HC-95184, and IAA #Y1-HC-9035 and IAA#Y1-HC-1010.
Footnotes
Published online ahead of print. Publication date available at www.cjasn.org.
This article contains supplemental material online at http://cjasn.asnjournals.org/lookup/suppl/doi:10.2215/CJN.06190614/-/DCSupplemental.
References
- 1.Landray MJ, Emberson JR, Blackwell L, Dasgupta T, Zakeri R, Morgan MD, Ferro CJ, Vickery S, Ayrton P, Nair D, Dalton RN, Lamb EJ, Baigent C, Townend JN, Wheeler DC: Prediction of ESRD and death among people with CKD: The Chronic Renal Impairment in Birmingham (CRIB) prospective cohort study. Am J Kidney Dis 56: 1082–1094, 2010 [DOI] [PMC free article] [PubMed] [Google Scholar]
- 2.Go AS, Chertow GM, Fan D, McCulloch CE, Hsu CY: Chronic kidney disease and the risks of death, cardiovascular events, and hospitalization. N Engl J Med 351: 1296–1305, 2004 [DOI] [PubMed] [Google Scholar]
- 3.Gutiérrez OM, Januzzi JL, Isakova T, Laliberte K, Smith K, Collerone G, Sarwar A, Hoffmann U, Coglianese E, Christenson R, Wang TJ, deFilippi C, Wolf M: Fibroblast growth factor 23 and left ventricular hypertrophy in chronic kidney disease. Circulation 119: 2545–2552, 2009 [DOI] [PMC free article] [PubMed] [Google Scholar]
- 4.Isakova T, Xie H, Yang W, Xie D, Anderson AH, Scialla J, Wahl P, Gutiérrez OM, Steigerwalt S, He J, Schwartz S, Lo J, Ojo A, Sondheimer J, Hsu CY, Lash J, Leonard M, Kusek JW, Feldman HI, Wolf M, Chronic Renal Insufficiency Cohort (CRIC) Study Group : Fibroblast growth factor 23 and risks of mortality and end-stage renal disease in patients with chronic kidney disease. JAMA 305: 2432–2439, 2011 [DOI] [PMC free article] [PubMed] [Google Scholar]
- 5.Gutiérrez OM, Mannstadt M, Isakova T, Rauh-Hain JA, Tamez H, Shah A, Smith K, Lee H, Thadhani R, Jüppner H, Wolf M: Fibroblast growth factor 23 and mortality among patients undergoing hemodialysis. N Engl J Med 359: 584–592, 2008 [DOI] [PMC free article] [PubMed] [Google Scholar]
- 6.Parker BD, Schurgers LJ, Brandenburg VM, Christenson RH, Vermeer C, Ketteler M, Shlipak MG, Whooley MA, Ix JH: The associations of fibroblast growth factor 23 and uncarboxylated matrix Gla protein with mortality in coronary artery disease: The Heart and Soul Study. Ann Intern Med 152: 640–648, 2010 [DOI] [PMC free article] [PubMed] [Google Scholar]
- 7.Wolf M, Molnar MZ, Amaral AP, Czira ME, Rudas A, Ujszaszi A, Kiss I, Rosivall L, Kosa J, Lakatos P, Kovesdy CP, Mucsi I: Elevated fibroblast growth factor 23 is a risk factor for kidney transplant loss and mortality. J Am Soc Nephrol 22: 956–966, 2011 [DOI] [PMC free article] [PubMed] [Google Scholar]
- 8.Scialla JJ, Astor BC, Isakova T, Xie H, Appel LJ, Wolf M: Mineral metabolites and CKD progression in African Americans. J Am Soc Nephrol 24: 125–135, 2013 [DOI] [PMC free article] [PubMed] [Google Scholar]
- 9.Kendrick J, Cheung AK, Kaufman JS, Greene T, Roberts WL, Smits G, Chonchol M, HOST Investigators : FGF-23 associates with death, cardiovascular events, and initiation of chronic dialysis. J Am Soc Nephrol 22: 1913–1922, 2011 [DOI] [PMC free article] [PubMed] [Google Scholar]
- 10.Fliser D, Kollerits B, Neyer U, Ankerst DP, Lhotta K, Lingenhel A, Ritz E, Kronenberg F, Kuen E, König P, Kraatz G, Mann JF, Müller GA, Köhler H, Riegler P, MMKD Study Group : Fibroblast growth factor 23 (FGF23) predicts progression of chronic kidney disease: The Mild to Moderate Kidney Disease (MMKD) Study. J Am Soc Nephrol 18: 2600–2608, 2007 [DOI] [PubMed] [Google Scholar]
- 11.Scialla JJ, Xie H, Rahman M, Anderson AH, Isakova T, Ojo A, Zhang X, Nessel L, Hamano T, Grunwald JE, Raj DS, Yang W, He J, Lash JP, Go AS, Kusek JW, Feldman H, Wolf M, Chronic Renal Insufficiency Cohort (CRIC) Study Investigators : Fibroblast growth factor-23 and cardiovascular events in CKD. J Am Soc Nephrol 25: 349–360, 2014 [DOI] [PMC free article] [PubMed] [Google Scholar]
- 12.Isakova T, Wahl P, Vargas GS, Gutiérrez OM, Scialla J, Xie H, Appleby D, Nessel L, Bellovich K, Chen J, Hamm L, Gadegbeku C, Horwitz E, Townsend RR, Anderson CA, Lash JP, Hsu CY, Leonard MB, Wolf M: Fibroblast growth factor 23 is elevated before parathyroid hormone and phosphate in chronic kidney disease. Kidney Int 79: 1370–1378, 2011 [DOI] [PMC free article] [PubMed] [Google Scholar]
- 13.Faul C, Amaral AP, Oskouei B, Hu MC, Sloan A, Isakova T, Gutiérrez OM, Aguillon-Prada R, Lincoln J, Hare JM, Mundel P, Morales A, Scialla J, Fischer M, Soliman EZ, Chen J, Go AS, Rosas SE, Nessel L, Townsend RR, Feldman HI, St. John Sutton M, Ojo A, Gadegbeku C, Di Marco GS, Reuter S, Kentrup D, Tiemann K, Brand M, Hill JA, Moe OW, Kuro-O M, Kusek JW, Keane MG, Wolf M: FGF23 induces left ventricular hypertrophy. J Clin Invest 121: 4393–4408, 2011 [DOI] [PMC free article] [PubMed] [Google Scholar]
- 14.Bash LD, Selvin E, Steffes M, Coresh J, Astor BC: Poor glycemic control in diabetes and the risk of incident chronic kidney disease even in the absence of albuminuria and retinopathy: Atherosclerosis Risk in Communities (ARIC) Study. Arch Intern Med 168: 2440–2447, 2008 [DOI] [PMC free article] [PubMed] [Google Scholar]
- 15.de Boer IH, Rue TC, Hall YN, Heagerty PJ, Weiss NS, Himmelfarb J: Temporal trends in the prevalence of diabetic kidney disease in the United States. JAMA 305: 2532–2539, 2011 [DOI] [PMC free article] [PubMed] [Google Scholar]
- 16.Molitch ME, Adler AI, Flyvbjerg A, Nelson RG, So WY, Wanner C, Kasiske BL, Wheeler DC, de Zeeuw D, Mogensen CE: Diabetic kidney disease: A clinical update from Kidney Disease: Improving Global Outcomes [published online ahead of print April 30, 2014]. Kidney Int 10.1038/ki.2014.128 [DOI] [PMC free article] [PubMed] [Google Scholar]
- 17.Manghat P, Fraser WD, Wierzbicki AS, Fogelman I, Goldsmith DJ, Hampson G: Fibroblast growth factor-23 is associated with C-reactive protein, serum phosphate and bone mineral density in chronic kidney disease. Osteoporos Int 21: 1853–1861, 2010 [DOI] [PubMed] [Google Scholar]
- 18.Tanaka H, Hamano T, Fujii N, Tomida K, Matsui I, Mikami S, Nagasawa Y, Ito T, Moriyama T, Horio M, Imai E, Isaka Y, Rakugi H: The impact of diabetes mellitus on vitamin D metabolism in predialysis patients. Bone 45: 949–955, 2009 [DOI] [PubMed] [Google Scholar]
- 19.Wahl P, Xie H, Scialla J, Anderson CA, Bellovich K, Brecklin C, Chen J, Feldman H, Gutierrez OM, Lash J, Leonard MB, Negrea L, Rosas SE, Anderson AH, Townsend RR, Wolf M, Isakova T, Chronic Renal Insufficiency Cohort Study Group : Earlier onset and greater severity of disordered mineral metabolism in diabetic patients with chronic kidney disease. Diabetes Care 35: 994–1001, 2012 [DOI] [PMC free article] [PubMed] [Google Scholar]
- 20.Buse JB, Bigger JT, Byington RP, Cooper LS, Cushman WC, Friedewald WT, Genuth S, Gerstein HC, Ginsberg HN, Goff DC, Jr., Grimm RH, Jr., Margolis KL, Probstfield JL, Simons-Morton DG, Sullivan MD, ACCORD Study Group : Action to Control Cardiovascular Risk in Diabetes (ACCORD) trial: Design and methods. Am J Cardiol 99: 21i–33i, 2007 [DOI] [PubMed] [Google Scholar]
- 21.Gerstein HC, Miller ME, Byington RP, Goff DC, Jr., Bigger JT, Buse JB, Cushman WC, Genuth S, Ismail-Beigi F, Grimm RH, Jr., Probstfield JL, Simons-Morton DG, Friedewald WT, Action to Control Cardiovascular Risk in Diabetes Study Group : Effects of intensive glucose lowering in type 2 diabetes. N Engl J Med 358: 2545–2559, 2008 [DOI] [PMC free article] [PubMed] [Google Scholar]
- 22.Ismail-Beigi F, Craven T, Banerji MA, Basile J, Calles J, Cohen RM, Cuddihy R, Cushman WC, Genuth S, Grimm RH, Jr., Hamilton BP, Hoogwerf B, Karl D, Katz L, Krikorian A, O’Connor P, Pop-Busui R, Schubart U, Simmons D, Taylor H, Thomas A, Weiss D, Hramiak I, ACCORD trial group : Effect of intensive treatment of hyperglycaemia on microvascular outcomes in type 2 diabetes: An analysis of the ACCORD randomised trial. Lancet 376: 419–430, 2010 [DOI] [PMC free article] [PubMed] [Google Scholar]
- 23.Prentice RL: A case-cohort design for epidemiologic cohort studies and disease prevention trials. Biometrika 73: 1–11, 1986 [Google Scholar]
- 24.Davis CE: Efficient means of studying ancillary questions in clinical trials. Stat Med 9: 97–100, 1990 [DOI] [PubMed] [Google Scholar]
- 25.Davis TM, Ting R, Best JD, Donoghoe MW, Drury PL, Sullivan DR, Jenkins AJ, O’Connell RL, Whiting MJ, Glasziou PP, Simes RJ, Kesäniemi YA, Gebski VJ, Scott RS, Keech AC, Fenofibrate Intervention and Event Lowering in Diabetes Study investigators : Effects of fenofibrate on renal function in patients with type 2 diabetes mellitus: The Fenofibrate Intervention and Event Lowering in Diabetes (FIELD) Study. Diabetologia 54: 280–290, 2011 [DOI] [PubMed] [Google Scholar]
- 26.Mychaleckyj JC, Craven T, Nayak U, Buse J, Crouse JR, Elam M, Kirchner K, Lorber D, Marcovina S, Sivitz W, Sperl-Hillen J, Bonds DE, Ginsberg HN: Reversibility of fenofibrate therapy-induced renal function impairment in ACCORD type 2 diabetic participants. Diabetes Care 35: 1008–1014, 2012 [DOI] [PMC free article] [PubMed] [Google Scholar]
- 27.Bonds DE, Craven TE, Buse J, Crouse JR, Cuddihy R, Elam M, Ginsberg HN, Kirchner K, Marcovina S, Mychaleckyj JC, O’Connor PJ, Sperl-Hillen JA: Fenofibrate-associated changes in renal function and relationship to clinical outcomes among individuals with type 2 diabetes: The Action to Control Cardiovascular Risk in Diabetes (ACCORD) experience. Diabetologia 55: 1641–1650, 2012 [DOI] [PMC free article] [PubMed] [Google Scholar]
- 28.Burnett SM, Gunawardene SC, Bringhurst FR, Jüppner H, Lee H, Finkelstein JS: Regulation of C-terminal and intact FGF-23 by dietary phosphate in men and women. J Bone Miner Res 21: 1187–1196, 2006 [DOI] [PubMed] [Google Scholar]
- 29.Barlow WE, Ichikawa L, Rosner D, Izumi S: Analysis of case-cohort designs. J Clin Epidemiol 52: 1165–1172, 1999 [DOI] [PubMed] [Google Scholar]
- 30.Law CG, Brookmeyer R: Effects of mid-point imputation on the analysis of doubly censored data. Stat Med 11: 1569–1578, 1992 [DOI] [PubMed] [Google Scholar]
- 31.Levey AS, Stevens LA, Schmid CH, Zhang YL, Castro AF, 3rd, Feldman HI, Kusek JW, Eggers P, Van Lente F, Greene T, Coresh J, CKD-EPI (Chronic Kidney Disease Epidemiology Collaboration) : A new equation to estimate glomerular filtration rate. Ann Intern Med 150: 604–612, 2009 [DOI] [PMC free article] [PubMed] [Google Scholar]
- 32.Peto R: The horse-racing effect. Lancet 2: 467–468, 1981 [DOI] [PubMed] [Google Scholar]
- 33.Semba RD, Fink JC, Sun K, Cappola AR, Dalal M, Crasto C, Ferrucci L, Fried LP: Serum fibroblast growth factor-23 and risk of incident chronic kidney disease in older community-dwelling women. Clin J Am Soc Nephrol 7: 85–91, 2012 [DOI] [PMC free article] [PubMed] [Google Scholar]
- 34.Grams ME, Rebholz CM, McMahon B, Whelton S, Ballew SH, Selvin E, Wruck L, Coresh J: Identification of incident CKD stage 3 in research studies. Am J Kidney Dis 64: 214–221, 2014 [DOI] [PMC free article] [PubMed] [Google Scholar]
- 35.Bash LD, Coresh J, Köttgen A, Parekh RS, Fulop T, Wang Y, Astor BC: Defining incident chronic kidney disease in the research setting: The ARIC Study. Am J Epidemiol 170: 414–424, 2009 [DOI] [PMC free article] [PubMed] [Google Scholar]
- 36.Rebholz CM, Grams ME, Coresh J, Selvin E, Inker LA, Levey AS, Kimmel PL, Vasan RS, Eckfeldt JH, Feldman HI, Hsu CY, Lutsey PL, for the Chronic Kidney Disease Biomarkers Consortium : Serum fibroblast growth factor-23 is associated with incident kidney disease [published online ahead of print July 24, 2014]. J Am Soc Nephrol doi:ASN.2014020218 [DOI] [PMC free article] [PubMed] [Google Scholar]
- 37.Kidney Disease: Improving Global Outcomes (KDIGO) CKD Work Group : KDIGO 2012 clinical practice guideline for the evaluation and management of chronic kidney disease. Kidney Int Suppl 3: 1–150, 2013 [Google Scholar]
- 38.Haut LL, Alfrey AC, Guggenheim S, Buddington B, Schrier N: Renal toxicity of phosphate in rats. Kidney Int 17: 722–731, 1980 [DOI] [PubMed] [Google Scholar]
- 39.Hu MC, Shi M, Zhang J, Quiñones H, Kuro-o M, Moe OW: Klotho deficiency is an early biomarker of renal ischemia-reperfusion injury and its replacement is protective. Kidney Int 78: 1240–1251, 2010 [DOI] [PMC free article] [PubMed] [Google Scholar]
- 40.Kuhlmann A, Haas CS, Gross ML, Reulbach U, Holzinger M, Schwarz U, Ritz E, Amann K: 1,25-Dihydroxyvitamin D3 decreases podocyte loss and podocyte hypertrophy in the subtotally nephrectomized rat. Am J Physiol Renal Physiol 286: F526–F533, 2004 [DOI] [PubMed] [Google Scholar]
Associated Data
This section collects any data citations, data availability statements, or supplementary materials included in this article.