Abstract
NO produced in tumors can either positively or negatively regulate growth. To examine this dichotomy, effects of NO concentration and duration on the posttranslational regulation of several key proteins were examined in human breast MCF7 cells under aerobic conditions. We found that different concentration thresholds of NO appear to elicit a discrete set of signal transduction pathways. At low steady-state concentrations of NO (<50 nM), extracellular signal-regulated kinase (ERK) phosphorylation was induced via a guanylate cyclase-dependent mechanism. Hypoxic inducible factor 1α (HIF-1α) accumulation was associated with an intermediate amount of NO (>100 nM), whereas p53 serine 15 phosphorylation occurred at considerably higher levels (>300 nM). ERK phosphorylation was transient during NO exposure. HIF-1α stabilization paralleled the presence of NO, whereas p53 serine 15 phosphorylation was detected during, and persisted after, NO exposure. The dose-dependent effects of synthetic NO donors were mimicked by activated macrophages cocultured with MCF7 cells at varying ratios. ERK and HIF-1α activation was similar in breast cancer cell lines either mutant (MB231) or null (MB157) in p53. The stabilization of HIF-1α by NO was not observed with increased MCF7 cell density, demonstrating the interrelationship between NO and O2 consumption. The findings show that concentration and duration of NO exposure are critical determinants in the regulation of tumor-related proteins.
Keywords: cancer, hypoxia, macrophage, inducible NO synthase
Nitric oxide (NO) has been shown to participate in numerous physiological functions important to tumor survival and propagation. Over the last decade, many reports have presented both positive and negative aspects of NO in tumor biology. Whereas NO was found to be either cytostatic or cytotoxic (1–5), other reports provide evidence that NO promotes cancer propagation by increasing tumor growth angiogenesis and metastasis (6–16). NO appears to be two-sided: beneficial or deleterious. In vivo transfection models have demonstrated inducible NO synthase (iNOS) can slow the growth in murine melanoma cells (17), whereas human colon DLD-1 cells showed a more aggressive phenotype (18). It was found that the relative iNOS activities from these melanoma cells were considerably higher than those reported for the DLD-1 cell line. Because of the complex chemistry of NO, its concentration and the cellular redox environment can dictate the biological outcome (19, 20). These factors suggest that perhaps the rate of NO production is a critical determinant. Most of the current data has focused on whether NO can regulate specific signal transduction pathways. Little is known regarding NO dose and concentration effects on these mechanisms. Because in vivo NO concentrations can vary considerably depending on the location and conditions of its production, we felt that it was of great importance to investigate this aspect on the regulation of key proteins. In this study, we have examined the concentration and temporal effects of NO on a wide range of proteins associated with cell growth and apoptosis.
Tumor development involves an intricate set of molecular events ultimately leading to proliferation, angiogenesis, metastasis, and progression. Despite the immense complexity, several key proteins, such as p53 and hypoxic inducible factor 1α (HIF-1α), have been identified as playing key roles in these processes. Both are strongly implicated in modulating tumor survival through regulating cellular division and proliferation (21–23). Interestingly, NO is known to activate both p53 and HIF-1α (20, 24–29). Insight into the mechanisms and cellular environments that promote the NO activation of p53 and HIF-1α is key to understanding its role in tumor biology. Herein we present data supporting the quantized (concentration-dependent) nature for the basic chemical and biophysical parameters that govern the activation of p53 and HIF-1α in response to NO.
Materials and Methods
Diethylene pentacetic acid and dimethylformamide were obtained from Fisher Scientific. 3-(5′-hydroxymethyl-2′-furyl)-1-benzylindazole, 1H-[1,2,4]oxadiazolo[4,3,-a]quinoxalin-1-one, and geldanamycin were obtained from (Sigma–Aldrich). 1,4-diamino-2,3-dicyano-1, 4-bis[2-aminophenylthio]butadiene was from Cell Signaling Technology (Beverly, MA). Stock solutions were prepared fresh daily at 100× in MilliQ-filtered H2O unless otherwise noted. Diazenium diolates [spermine NONOate (Sper/NO), diethylamine NONOate (Dea/NO), and diethyltryamine NONOate (Deta/NO)] were a generous gift from J. Saavedra and J. A. Hrabie (National Cancer Institute–Frederick Cancer Research and Development Center, Frederick, MD). Dilutions were made into media from 100 mM stock solutions in 10 mM NaOH. The stock concentration was determined immediately before use by measuring the absorbance at 250 nm (ε = 8,000 M–1·cm–1) (31).
Cell Culture. MCF7 human breast carcinoma cells (American Type Culture Collection) were plated and grown to 85% confluency in RPMI medium 1640 (Life Technologies, Grand Island, NY) containing 10% FBS (HyClone). Before treatment (NONOate or coculture), the cells were incubated with serum-free RPMI medium 1640 overnight. To induce iNOS expression, ANA-1 murine macrophages were activated with IFN-γ (Sigma) and LPS (Sigma) as described in ref. 30. For coculture experiments, ANA-1 cells were trypsinized, counted, and seeded on top of MCF7 cells at the indicated density in serum-free media supplemented with either l-arginine (1 mM) or aminoguanidine (5 mM).
NO and O2 Quantification. The steady-state concentration of NO produced during NONOate degradation was verified by two independent methods: electrochemically and by a NO gas analyzer. Electrochemical analysis was accomplished with either a NO probe (World Precision Instruments, Sarasota, FL) or O2 electrode (Yellow Springs Instruments) suspended in constantly stirred serum-free media (2 ml) maintained at 37°C. MCF7 cells were trypsinized, centrifuged, and added at the desired concentration. Signals were calibrated by using argon-purged 100 mM phosphate solutions of saturated NO (Matheson) after determination of NO concentration with 2,2′-azino-bis(ethylbenzothiazoline-6-sulfonic acid) (660 nm, ε = 12,000 M–1·cm–1) (33). NO gas analysis was accomplished by using a Seivers (Boulder, CO) NO gas analyzer. Aliquots of media (100 μl) from NONOate-treated cells were injected into the reaction chamber containing 0.5 mM NaOH to stop NONOate decomposition, and the chamber was continually purged with He gas to eliminate NO autooxidation. Steady-state molar NO concentrations were calculated from the absolute amounts of NO detected. Steady-state concentrations of NO in the media produced from activated macrophages were measured by the same method.
Cell Proliferation Assay. MCF7 cells were seeded into 96-well microtiter plates (Costar) and treated for 24 h in serum-free medium with either 4–1,000 μM Sper/NO or 4–1,000 μM Deta/NO. Cell growth was monitored by reduction of Alamar blue to its fluorescence product (λEx/Em = 550/595 nm) (31) after 24, 48, and 72 h.
cGMP Measurements. MCF7 cells were grown to 50% confluency in 96-well microtitter plates. Cells were serum-starved overnight and treated with NO donors accordingly. The cells were lysed at the indicated time points, and cell extracts were assayed for cGMP by enzyme immunoassay (Amersham Biosciences).
Western Blot. Protein cell extracts were made by washing cells in cold PBS, scraping of plates, centrifuging, and resuspending in lysis buffer [1% Nonidet P-40/0.5% sodium deoxycholate/0.1% SDS and protease inhibitor mixture (Calbiochem)]. After a 30-min incubation on ice, the samples were centrifuged at 14,000 × g, and the supernatant protein concentration was determined by the bichoncinic acid method (Pierce). Protein samples were subjected to polyacrylamide gel electrophoresis on 10% Tris-glycine acrylamide gels (NOVEX–Invitrogen, Carlsbad, CA). After transfer to polyvinylidene fluoride Immunolon P membranes (Millipore), samples were probed with rabbit polyclonal or mouse monoclonal antibodies (HIF, p53 P-Ser-15, actin, DO1 cell signaling). Bands were visualized with horseradish peroxidase-conjugated secondary antibodies (1:2,000–10,000; Sigma) and chemiluminescent substrate (Pierce). Actin protein-loading controls were run for each gel (data not shown). Gel images were scanned by using an Agfa DuoScan hiD scanner, and relevant bands were cropped to size by using photoshop 7.0 (Adobe Systems, San Jose, CA) with no further manipulation. Figures are representative of n ≥ 3 individual experiments.
Results
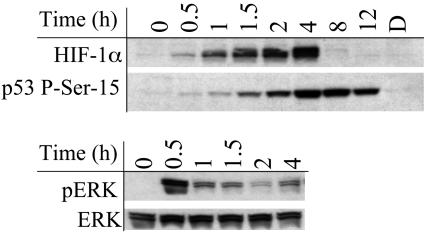
We surveyed the effects of NO, H2O2, HNO, O–2/NO, and NO2 on a variety of proteins in MCF7 cells (unpublished observation). Among the >20 proteins examined, only a few demonstrated significant differences in regulation and only in response to varying concentrations of NO (Table 1). Consistent with previous reports, we observed that both HIF-1α and p53 phosphoserine 15 (P-Ser-15) proteins accumulated in response to NO exposure (25–29). MCF7 cells exposed to 100 μM Sper/NO caused a time-dependent increase in both HIF-1α and p53 P-Ser-15 (Fig. 1). These conditions also resulted in phosphorylation of p42 and p44 extracellular signal-regulated kinase (pERK), members of the mitogen-activated protein kinase superfamily (Fig. 1), consistent with previous reports (32, 33). In response to NO, p53 P-Ser-15 protein was present for >12 h, whereas the HIF-1α was completely degraded after 4 h and ERK was only transiently phosphorylated.
Table 1. Changes in protein levels in MCF7 cells after NO treatment.
| Protein | Change in protein level |
|---|---|
| Actin | No |
| AKT | No |
| ATM | No |
| CD 71 (H-300) | No |
| Cytochrome c | No |
| EGFr | No |
| HIF-1α | Yes |
| HSP 90 (F-8) | No |
| Mdm2 | No |
| p44/42 MAPK | No |
| p53 | Yes |
| p53 (P-Ser-15) | Yes |
| Phospho-Akt (Ser-473) | No |
| Phospho-Akt (Thr-308) | No |
| Phospho-SAP/JNK | No |
| Phospho-p38 MAPK | No |
| Phospho-p44/42 MAPK | Yes |
| STAT 3 (Tyr-705) | No |
| WAF | Yes |
Fig. 1.
Temporal relationship between NO exposure and protein accumulation in MCF7 cells. Representative immunoblot of p53 P-Ser-15, HIF-1α, and pERK from MCF7 cell protein extracts after NO exposure (n > 3). Cells grown to 85% confluence in 150-mm Petri dishes were serum-starved overnight, treated with Sper/NO (100 μM), and harvested at the indicated time points. D, decomposed Sper/NO, 100 μM for 12 h; representative of all time points (data not shown).
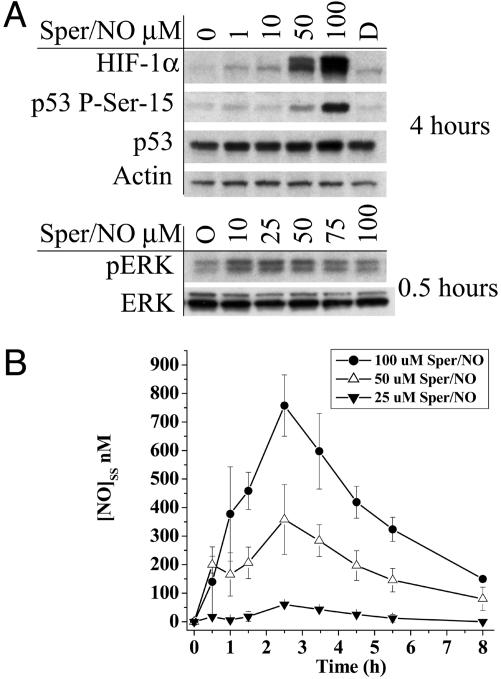
To determine whether the activation or stabilization of p53 P-Ser-15, HIF-1α, and pERK depended on discrete NO concentrations, MCF7 cells were exposed to varying concentrations of Sper/NO. Each protein demonstrated a different threshold sensitivity to NO (Fig. 2A). Phosphorylation of ERK was observed with as little as 10 μM Sper/NO. In contrast, HIF-1α stabilization was observed at exposures of ≥50 μM Sper/NO, and formation of p53 P-Ser-15 required ≥100 μM Sper/NO.
Fig. 2.
Protein accumulation as a function of NO concentration in MCF7 cells. (A) Cells grown to 85% confluence in 150-mm Petri dishes were serum-starved overnight and treated with Sper/NO as indicated. Time points were chosen corresponding to maximal protein accumulation (Fig. 1). D, decomposed Sper/NO (100 μM). (B) Cells were grown and treated with Sper/NO as in A. NO concentrations were determined from 100-μl sample aliquots of medium withdrawn from the Petri dish by gas-tight syringe without agitation and analyzed by chemiluminescence at the indicated time points. Representative data are shown as the mean ± SE (n = 3).
The steady-state concentration of NO depends on both its rate of production and its rate of disappearance. NO liberation (production) from diazenium diolates (Sper/NO, Deta/NO, and Dea/NO) is solely dictated by temperature and pH level (34), whereas NO disappearance depends on chemical reactions (NO reaction with oxygen) and physical factors (vessel size and head space). To quantitate the precise steady-state levels within our system, the concentration of NO in the media above MCF7 cells treated with different donor amounts was measured over time (Fig. 2B). These data provided the approximate threshold concentration limits for pERK, HIF-1α, and p53 P-Ser-15 activation and stabilization by NO.
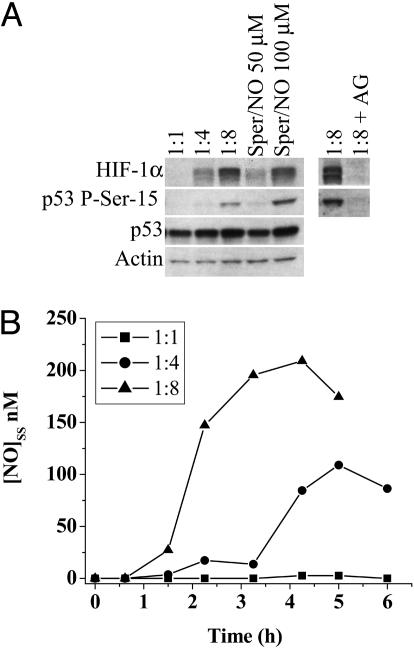
The cellular composition of tumors is heterogeneous and may contain leukocytic infiltrates that express iNOS. To model this interaction, MCF7 cells were cocultured with activated NO producing ANA-1 macrophages (p53 and HIF-1α-null). HIF-1α stabilization in MCF7 cells became evident at a cell ratio of 1:4 (MCF7/ANA-1) with an intensity equivalent to 50 μM Sper/NO exposure. In contrast, p53 P-Ser-15 was seen in MCF7 cells at a ratio of 1:8, similar to levels observed with 100 μM Sper/NO (Fig. 3A). Protein accumulation or stabilization was not observed in the presence of aminoguanodine, an iNOS inhibitor. Steady-state NO levels were measured in the media above the MCF7/ANA-1 cells cocultured at various ratios (Fig. 3B). These results suggested that MCF7 protein stabilization by steady-state NO was a function of threshold levels rather than the source of NO; synthetic donors or activated macrophages. The NO levels measured in media necessary to stabilize both HIF-1α and p53 were approximately half in the coculture experiments than what was measured in the donor experiments. These data indicate that the NO levels are considerably higher around the microenvironment of the MCF7 cells where the NO-producing macrophages lie in comparison to the release of NO from donors in a homogenous solution.
Fig. 3.
Comparison of HIF-1α and p53 P-Ser-15 accumulation by NO from either Sper/NO or activated macrophages. MCF7 cells were grown as in Fig. 1. (A) Four-hour treatment of MCF7 cells with either Sper/NO (50 and 100 μM) or ratios of activated NO-producing ANA-1 macrophages (MCF7:ANA-1) as indicated. 1:8 + AG = MCF7:ANA-1 1:8 + iNOS inhibitor aminoguanidine. (B) NO concentration from cocultured MCF7 and ANA-1 cells was determined as described in Fig. 2B. Representative data are shown (n = 3).
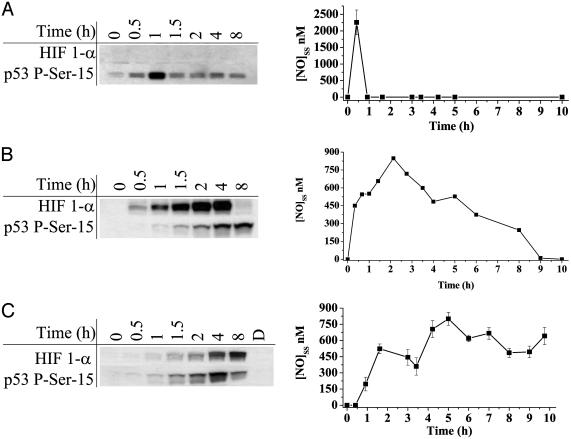
Having established that a steady-state threshold concentration of NO was an important determinant for protein stabilization, we tested the hypothesis that duration of NO exposure should also have an effect. MCF7 cells were treated with the synthetic NO donors DEA/NO 100 μM(t1/2 ≈ 2 min), Sper/NO 100 μM(t1/2 ≈ 39 min), and DETA/NO 1,000 μM(t1/2 ≈ 24 h). These concentrations were chosen to give approximately equal maxima steady-state levels of NO (Fig. 4) (34). These data showed that HIF-1α was only stabilized when NO was present or that HIF-1α was transiently stabilized below the sensitivity of our assay. P53 P-Ser-15 however, remained stabilized during, and persisted after, the disappearance of NO. ERK was only phosphorylated transiently in the presence of NO for any duration of exposure (Fig. 1 and data not shown).
Fig. 4.
HIF-1α and p53 P-Ser-15 accumulation in response to various durations of NO exposure and real-time quantification of NO concentration. MCF7 cells were grown as in Fig. 1 and exposed to the NO donors. (A) 100 μM DEA/NO. (B) 100 μM Sper/NO. (C) 1,000 μM DETA/NO. NO steady-state levels were quantified as in Fig. 2B.
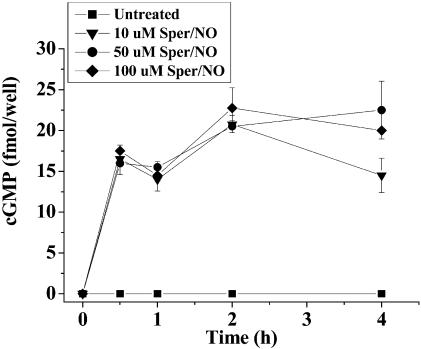
To elucidate some of the mechanistic aspects of these NO effects, several inhibitor studies were performed. Previous reports suggest ERK phosphorylation involves a cGMP mechanism consistent with NO activation of guanylate cyclase (32). cGMP was increased within a 30-min exposure to Sper/NO (10–100 μM) and remained elevated for >4 h (Fig. 5). In the presence of the potent soluble guanylate cyclase inhibitor 1h-[1,2,4]oxadiazolo[4,3,-a]quinoxalin-1-one (35), cGMP was decreased and ERK phosphorylation was not detected (data not shown). Addition of the soluble guanylate cyclase agonist 3-(5′-hydroxymethyl-2′-furyl)-1-benzylindazole (36) increased cGMP levels, and pERK remained elevated for >4 h (data not shown). Furthermore, 1,4-diamino-2,3-dicyano-1, 4-bis[2-aminophenylthio]butadiene, a mitogen-activated protein kinase inhibitor (37, 38), completely blocked NO-stimulated ERK phosphorylation, suggesting that it also occurs through a traditional Raf–mitogen-activated protein kinase–ERK cascade and not through inhibition of an ERK phosphatase (data not shown). We also found that p21 (WAF-1) was increased by NO (data not shown).
Fig. 5.
cGMP accumulation in MCF7 cells in response to various concentrations of the NO donor Sper/NO. MCF7 cells were grown to 50% confluency in a 96-well microtiter plates, serum-starved overnight, and treated with Sper/NO for the indicated time points (n = 3).
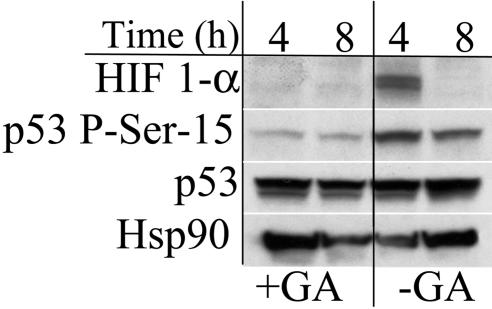
It has been previously reported that the chaperone protein Hsp90 is important in the activation and accumulation of both p53 and HIF-1α. Geldanamycin prevents Hsp90 client protein interactions (39). Treatment of MCF7 cells with geldanamycin prevented detectable increases in p53 P-Ser-15 and HIF-1α by NO (Fig. 6). Interestingly, the overall levels of p53 did not change, and Hsp90 levels changed independent of geldanamycin treatment. These results suggest that dissociation with Hsp90 either prevents phosphorylation of p53 or permits dephosphorylation or degradation. Moreover, this demonstrates that factors in addition to NO are necessary for HIF-1α stabilization. Mdm2 mediates p53 degradation by acting as an E3 ubiquitin ligase (40). In contrast to previous studies (25), Mdm2 protein levels were relatively unaffected by NO exposure under our conditions (data not shown).
Fig. 6.
Effect of Hsp90 inhibition on NO-induced protein stabilization. MCF7 cells were grown as in Fig. 1. Cells were treated with Sper/NO (100 μM) ± geldanamycin (10 μM) and harvested at the indicated time points. HIF-1α and p53 P-Ser-15 were undetectable in untreated controls (data not shown).
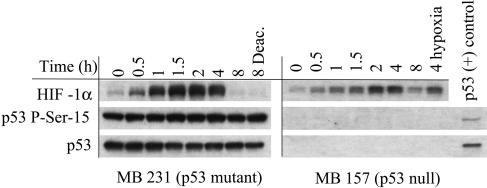
The p53 status (mutated, null, or wild-type) of tumors often correlates with its metastatic potential (41). The effect of NO on MB231 (mutant p53) and MB 157 (p53-null) human breast cancer cell lines was evaluated. In MB231 cells, HIF-1α was stabilized by NO and responded identically to the MCF7 cells (Fig. 7). In addition to p53 being mutated in this cell line, we found that the protein was already heavily phosphorylated at the serine 15 residue, and no additional effect by NO on p53 stabilization was observed. HIF-1α in MB 157 cells was also stabilized in response to NO exposure (Fig. 7). These data suggest that HIF-1α stabilization by NO is independent of p53 status.
Fig. 7.
Effect of p53 status on NO-mediated HIF-1α stabilization. MB 231 and MB 157 breast cancer cells were grown as in Fig. 1, treated with Sper/NO (100 μM), and harvested at the indicated time points. MB 157 cells were grown in hypoxia for 4 h without Sper/NO as a HIF-1α positive control (4 hypoxia). A p53 P-Ser-15-positive MCF7 sample was blotted for an internal p53 control [p53 (+) control].
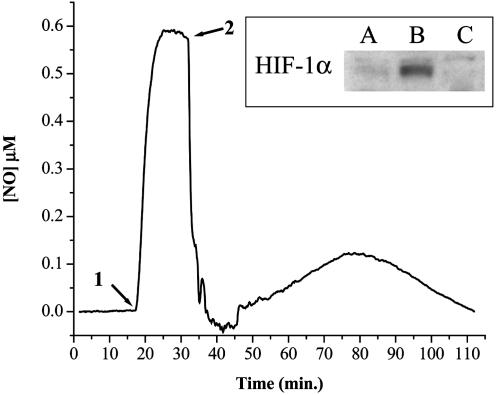
No change in cell viability or cell number was observed after 0.5- to 12-h NO donor treatments. Differences in cell proliferation after various NO donor treatments were measured by using a dye reduction assay. After 72 h, the IC50 values for Sper/NO and Deta/NO were ≈125 μM and ≈250 μM, respectively. In vitro cell culture systems can provide important information regarding responses to NO. However, increases in cell density will effect these responses by accelerating the consumption of both NO and oxygen. MCF7 cells were harvested and placed in suspension to test the influence of increased cell density on NO-induced HIF-1α accumulation. Cellular oxygen and NO consumption were measured simultaneously in the presence or absence of Sper/NO (100 μM), and endpoint HIF-1α analysis was performed. Although MCF7 cells consume NO and O2, NO also inhibits cellular respiration. There exists a balance between cellular NO consumption and respiratory inhibition. HIF-1α stabilization was not evident in MCF7 cells (3 × 10⁶ per ml) supplemented with O2 to maintain normoxic conditions [≈21% O2; 200–600 mmHg (1 mmHg = 133 Pa)] for 2 h in the absence of NO (Fig. 8A). When an equivalent amount of cells was allowed to consume all of the O2 in the absence of NO, HIF-1α protein was stabilized and accumulated after a 2 h period (Fig. 8B). In a similar experiment, 100 μM Sper/NO was added after MCF7 cells consumed approximately half the total O2 (pO2 ≈ 100 mmHg). Subsequently, O2 consumption was inhibited and remained unchanged for the duration of the experiment. HIF-1α was not detected under these conditions of intermediate O2 tension in the presence of NO (Fig. 8C). For a given donor concentration (e.g., 100 μM Sper/NO), NO is produced at a constant rate. This study shows that cell density modulates HIF-1α accumulation through cellular consumptive pathways that limit NO bioavailability.
Fig. 8.
Electrochemical detection of NO in the presence of MCF7 cells. MCF7 cells were added in suspension (3 × 10⁶/ml) as described in Materials and Methods. O2 was monitored continuously for 120 min (data not shown). Cells were isolated, and proteins were immunoblotted for HIF-1α. (A) Normoxia (≈21% O2); (B) hypoxia (<1% O2); (C) intermediate (≈10% O2). Representative NO electrode data for condition C are shown (n = 3). Sper/NO (100 μM) was added to the chamber (1). MCF7 cells were added after a steady-state NO level was achieved (2).
Discussion
The effect of NO formation in tumor biology has generated much discussion because of the great variability in results. The presence and type of NOS in tumor endothelial and stromal cells have been correlated with decreased tumor growth and progression (42–45). On the other hand, there are many reports that suggest proangiogenic and tumor-promoting properties of NO (47–52). This dichotomy can in part be explained by the current study in which NO-stimulated posttranslational modification of key signal transduction proteins depended on defined threshold concentrations of NO as well as the duration of exposure.
Through our quantification of NO steady-state levels, we found that distinct concentrations of NO exposure resulted in differential signal transduction responses in MCF7 cells. At low NO concentrations (≥10 μM SperNO, ≈10–50 nM [NO]SS), ERK phosphorylation was induced, whereas HIF-1α accumulation occurred at higher NO steady-state levels (≥50 μM Sper/NO, ≈150–300 nM [NO]SS) (Fig. 2). Phosphorylation of p53 P-Ser-15 required the highest relative NO exposure concentration (≥100 μM Sper/NO, ≈300–700 nM [NO]SS). The NO levels necessary to induce p53 P-Ser-15 may actually reflect NO-induced DNA strand breaks as shown by Hofseth et al. (25). It is interesting to note that ERK and HIF-1α signaling mechanisms are generally associated with tumor proliferation and differentiation, whereas phosphorylation of p53 predominantly results in growth arrest or apoptosis. These findings demonstrate that select signal transduction cascades respond to NO exposure with different threshold sensitivities, resulting in distinct phenotypic responses.
In addition to concentration, the duration of NO exposure affected the signal transduction responses. NO-induced phosphorylation of ERK was rapid, but also transient, despite sustained exposure (Fig. 1). Unlike the transitory activation of ERK, HIF-1α accumulation continued only in the presence of sufficient and sustained NO flux. These differences are illustrated by the data in Fig. 4. DEA/NO, which gave a burst of NO (2 μM for <1 h), did not result in detectable HIF-1α. However, prolonged NO exposure from either Sper/NO or Deta/NO caused HIF-1α to accumulate. In contrast, p53 P-Ser-15 was detected long after (12 h) the termination of NO exposure (Figs. 1 and 4).
Potential mechanisms involved in NO signaling were examined. Mitogen-activated protein kinase and guanylate cyclase inhibition blocked NO-stimulated pERK formation, whereas HIF-1α and p53 P-Ser-15 were unaffected (data not shown). ERK phosphorylation through NO was transient, whereas soluble guanylate cyclase activation by 3-(5′-hydroxymethyl-2′-furyl)-1-benzylindazole resulted in sustained pERK. This result is consistent with previous observations showing that NO induces dephosphorylation of pERK through activation of specific phosphatases in addition to activating soluble guanylate cyclase (53). Disruption of Hsp90–client protein interactions with geldanamycin (54) showed that this chaperone protein plays a critical role in the stabilization of HIF-1α and p53 P-Ser-15 induced by NO (Fig. 6). Significantly, Hsp90 levels were not affected by NO exposure. Although HIF-1α and p53 stabilization is a function of NO exposure, the stability of these proteins is due to their association with Hsp90. This finding suggests that geldanamycin therapy may target HIF-1α- and p53-dependent processes.
Stabilization of HIF-1α has been reported to be due to its association with p53 (55). We observed that the ability of NO to stabilize HIF-1α was not dependent on the presence of p53 (Fig. 7). HIF-1α in MB231 cells, which expressed mutated hyperphosphorylated p53 P-Ser-15, responded to NO exposure similar to MCF7. NO did not further enhance or decrease the p53 hyperphosphorylation status. These data suggest that tumors expressing mutated p53 may be unable to respond to the normal growth-arresting properties of high NO exposure and that the pro-growth signaling of HIF-1α may predominate. This supposition is consistent with studies in which wild-type p53 cancer cell lines expressing iNOS showed reduced tumor growth but cell lines with mutated p53 showed accelerated growth and neovascularization (7).
Despite the complexity of NO chemistry, these findings implicate a simpler model where distinct biological responses result from specific incremental NO levels. NO is a diffusible gas whose concentration is determined partially by its distance from the point of synthesis (56). We used increasing ratios of activated ANA-1 (p53 and HIF-1α-null) macrophage to MCF7 cells as a model to illustrate this. As seen in Fig. 3, increasing the density of NOS-containing cells increased expression of p53 P-Ser-15 and HIF-1α. In a solid tumor, cells close to a NO source may be more prone to cell cycle arrest or death through p53, whereas cells at greater distances may respond with increased levels of HIF-1α relative to p53. Moreover, tumor heterogeneity and NO produced from immune cells may be an important and essential determinant of protein profiles in a tumor.
In addition to its rate of synthesis, cellular NO consumptive pathways also dictate its concentration and contribute to signal transduction responses. All known cellular NO consumptive mechanisms require oxygen (57). As O2 concentrations decline, NO consumption decreases. However, this decline leads to increased NO and inhibition of mitochondrial respiration. This relationship suggests that there is a delicate balance and interdependence between oxygen and NO concentrations and protein stability. For a specific rate of NO production (e.g., 100 μM Sper/NO) HIF-1α is not stabilized at high cell density suspensions because of the limitations on NO's bioavailability by cellular consumptive pathways (Fig. 8) when compared to low cell density experiments (Fig. 1). This finding emphasizes why the differential response of proteins to NO must be considered in the context of a solid tumor where oxygen gradients exist. Hypoxic regions have been thought to increase the aggressiveness of some tumors (58), areas in which NO may stabilize key proteins such as HIF-1α. This effect may be significant not only in cancer but in chronic and acute diseases ranging from ischemia reperfusion injury to inflammation.
We have shown that p53 P-Ser-15 and HIF-1α in cancer cells are responsive to NO in both a concentration- and duration-dependent manner. Regulation by NO within tumors may act through a series of thresholds, each eliciting a discrete set of signal transduction cascades. Therefore, the role of NO as either growth promoting or cytotoxic in tumors may be explained by differences in the rates of NO production versus its disappearance. These processes will change according to tumor heterogeneity and degree of vascularity. We emphasize the importance of O2- on NO-mediated responses. NO consumption is increased with higher relative O2 concentrations and cell densities (Fig. 8) (58). Despite high concentrations of NO delivered by either donors or macrophages, the consumption of NO is faster than its stabilizing effect on HIF-1α and p53 in cell-dense solutions and possibly tumors. Our data show that the relative concentrations and durations of NO exposure must be carefully evaluated in the context of signal-transduction pathways.
This paper was submitted directly (Track II) to the PNAS office.
Abbreviations: iNOS, inducible NO synthase; ERK, extracellular signal-regulated kinase; pERK, p42 and p44 ERK; HIF-1α, hypoxic inducible factor 1α; Sper/NO, spermine NONOate; Dea/NO, diethylamine NONOate; Deta/NO, diethyltryamine NONOate; P-Ser-15, phosphoserine 15.
References
- 1.Juang, S. H., Xie, K., Xu, L., Shi, Q., Wang, Y., Yoneda, J. & Fidler, I. J. (1998) Hum. Gene. Ther. 9, 845–854. [DOI] [PubMed] [Google Scholar]
- 2.Reveneau, S., Arnould, L., Jolimoy, G., Hilpert, S., Lejeune, P., Saint-Giorgio, V., Belichard, C. & Jeannin, J. F. (1999) Lab. Invest. 79, 1215–1225. [PubMed] [Google Scholar]
- 3.Pervin, S., Singh, R. & Chaudhuri, G. (2001) Proc. Natl. Acad. Sci. USA 98, 3583–3588. [DOI] [PMC free article] [PubMed] [Google Scholar]
- 4.Scott, D. J., Hull, M. A., Cartwright, E. J., Lam, W. K., Tisbury, A., Poulsom, R., Markham, A. F., Bonifer, C. & Coletta, P. L. (2001) Gastroenterology 121, 889–899. [DOI] [PubMed] [Google Scholar]
- 5.Wei, D., Richardson, E. L., Zhu, K., Wang, L., Le, X., He, Y., Huang, S. & Xie, K. (2003) Cancer Res. 63, 3855–3859. [PubMed] [Google Scholar]
- 6.Forrester, K., Ambs, S., Lupold, S. E., Kapust, R. B., Spillare, E. A., Weinberg, W. C., Felley-Bosco, E., Wang, X. W., Geller, D. A., Tzeng, E., et al. (1996) Proc. Natl. Acad. Sci. USA 93, 2442–2447. [DOI] [PMC free article] [PubMed] [Google Scholar]
- 7.Ambs, S., Merriam, W. G., Ogunfusika, M. O., Bennett, W. P., Ishibe, N., Hussain, S. P., Tzeng, E. E., Geller, D. A., Billiar, T. R. & Harris, C. C. (1998) Nat. Med. 4, 1371–1376. [DOI] [PubMed] [Google Scholar]
- 8.Ambs, S., Merriam, W. G., Bennett, W. P., Felley-Bosco, E., Ogunfusika, M. O., Oser, S. M., Klein, S., Shields, P. G., Billiar, T. R. & Harris, C. C. (1998) Cancer Res. 58, 334–341. [PubMed] [Google Scholar]
- 9.Ambs, S., Ogunfusika, M. O., Merriam, W. G., Bennett, W. P., Billiar, T. R. & Harris, C. C. (1998) Proc. Natl. Acad. Sci. USA 95, 8823–8828. [DOI] [PMC free article] [PubMed] [Google Scholar]
- 10.Martin, J. H., Begum, S., Alalami, O., Harrison, A. & Scott, K. W. (2000) Tumour Biol. 21, 90–97. [DOI] [PubMed] [Google Scholar]
- 11.Vakkala, M., Kahlos, K., Lakari, E., Paakko, P., Kinnula, V. & Soini, Y. (2000) Clin. Cancer Res. 6, 2408–2416. [PubMed] [Google Scholar]
- 12.Wang, B., Xiong, Q., Shi, Q., Le, X., Abbruzzese, J. L. & Xie, K. (2001) Cancer Res. 61, 71–75. [PubMed] [Google Scholar]
- 13.Wang, B., Xiong, Q., Shi, Q., Tan, D., Le, X. & Xie, K. (2001) Int. J. Cancer 91, 607–611. [PubMed] [Google Scholar]
- 14.Loibl, S., von Minckwitz, G., Weber, S., Sinn, H. P., Schini-Kerth, V. B., Lobysheva, I., Nepveu, F., Wolf, G., Strebhardt, K. & Kaufmann, M. (2002) Cancer 95, 1191–1198. [DOI] [PubMed] [Google Scholar]
- 15.Ellies, L. G., Fishman, M., Hardison, J., Kleeman, J., Maglione, J. E., Manner, C. K., Cardiff, R. D. & MacLeod, C. L. (2003) Int. J. Cancer 106, 1–7. [DOI] [PubMed] [Google Scholar]
- 16.Jadeski, L. C., Chakraborty, C. & Lala, P. K. (2003) Int. J. Cancer 106, 496–504. [DOI] [PubMed] [Google Scholar]
- 17.Xie, K., Huang, S., Dong, Z., Juang, S. H., Gutman, M., Xie, Q. W., Nathan, C. & Fidler, I. J. (1995) J. Exp. Med. 181, 1333–1343. [DOI] [PMC free article] [PubMed] [Google Scholar]
- 18.Jenkins, D. C., Charles, I. G., Thomsen, L. L., Moss, D. W., Holmes, L. S., Baylis, S. A., Rhodes, P., Westmore, K., Emson, P. C. & Moncada, S. (1995) Proc. Natl. Acad. Sci. USA 92, 4392–4396. [DOI] [PMC free article] [PubMed] [Google Scholar]
- 19.Wink, D. A. & Mitchell, J. B. (1998) Free Radical Biol. Med. 25, 434–456. [DOI] [PubMed] [Google Scholar]
- 20.Hofseth, L. J., Hussain, S. P., Wogan, G. N. & Harris, C. C. (2003) Free Radical Biol. Med. 34, 955–968. [DOI] [PubMed] [Google Scholar]
- 21.Semenza, G. L. (2002) Trends Mol. Med. 8, S62–S67. [DOI] [PubMed] [Google Scholar]
- 22.Semenza, G. L. (2002) Intern. Med. 41, 79–83. [DOI] [PubMed] [Google Scholar]
- 23.Hollstein, M., Sidransky, D., Vogelstein, B. & Harris, C. C. (1991) Science 253, 49–53. [DOI] [PubMed] [Google Scholar]
- 24.Hussain, S. P., Hofseth, L. J. & Harris, C. C. (2003) Nat. Rev. Cancer 3, 276–285. [DOI] [PubMed] [Google Scholar]
- 25.Hofseth, L. J., Saito, S., Hussain, S. P., Espey, M. G., Miranda, K. M., Araki, Y., Jhappan, C., Higashimoto, Y., He, P., Linke, S. P., et al. (2003) Proc. Natl. Acad. Sci. USA 100, 143–148. [DOI] [PMC free article] [PubMed] [Google Scholar]
- 26.Sandau, K. B., Fandrey, J. & Brune, B. (2001) Blood 97, 1009–1015. [DOI] [PubMed] [Google Scholar]
- 27.Brune, B. & Zhou, J. (2003) Curr. Med. Chem. 10, 845–855. [DOI] [PubMed] [Google Scholar]
- 28.Sandau, K. B., Faus, H. G. & Brune, B. (2000) Biochem. Biophys. Res. Commun. 278, 263–267. [DOI] [PubMed] [Google Scholar]
- 29.Brune, B., von Knethen, A. & Sandau, K. B. (2001) Cell. Signalling 13, 525–533. [DOI] [PubMed] [Google Scholar]
- 30.Espey, M. G., Miranda, K. M., Pluta, R. M. & Wink, D. A. (2000) J. Biol. Chem. 275, 11341–11347. [DOI] [PubMed] [Google Scholar]
- 31.Ahmed, S. A., Gogal, R. M., Jr., & Walsh, J. E. (1994) J. Immunol. Methods 170, 211–224. [DOI] [PubMed] [Google Scholar]
- 32.Callsen, D., Pfeilschifter, J. & Brune, B. (1998) J. Immunol. 161, 4852–4858. [PubMed] [Google Scholar]
- 33.Callsen, D. & Brune, B. (1999) Biochemistry 38, 2279–2286. [DOI] [PubMed] [Google Scholar]
- 34.Thomas, D. D., Miranda, K. M., Espey, M. G., Citrin, D., Jourd'heuil, D., Paolocci, N., Hewett, S. J., Colton, C. A., Grisham, M. B., Feelisch, M., et al. (2002) Methods Enzymol. 359, 84–105. [DOI] [PubMed] [Google Scholar]
- 35.Brunner, F., Stessel, H. & Kukovetz, W. R. (1995) FEBS Lett. 376, 262–266. [DOI] [PubMed] [Google Scholar]
- 36.Ko, F. N., Wu, C. C., Kuo, S. C., Lee, F. Y. & Teng, C. M. (1994) Blood 84, 4226–4233. [PubMed] [Google Scholar]
- 37.Favata, M. F., Horiuchi, K. Y., Manos, E. J., Daulerio, A. J., Stradley, D. A., Feeser, W. S., Van Dyk, D. E., Pitts, W. J., Earl, R. A., Hobbs, F., et al. (1998) J. Biol. Chem. 273, 18623–18632. [DOI] [PubMed] [Google Scholar]
- 38.Duncia, J. V., Santella, J. B., III, Higley, C. A., Pitts, W. J., Wityak, J., Frietze, W. E., Rankin, F. W., Sun, J. H., Earl, R. A., Tabaka, A. C., et al. (1998) Bioorg. Med. Chem. Lett. 8, 2839–2844. [DOI] [PubMed] [Google Scholar]
- 39.Whitesell, L., Mimnaugh, E. G., De Costa, B., Myers, C. E. & Neckers, L. M. (1994) Proc. Natl. Acad. Sci. USA 91, 8324–8328. [DOI] [PMC free article] [PubMed] [Google Scholar]
- 40.Haupt, Y., Maya, R., Kazaz, A. & Oren, M. (1997) Nature 387, 296–299. [DOI] [PubMed] [Google Scholar]
- 41.Bozcuk, H., Uslu, G., Pestereli, E., Samur, M., Ozdogan, M., Karaveli, S., Sargin, F. & Savas, B. (2001) Breast Cancer Res. Treat. 68, 239–248. [DOI] [PubMed] [Google Scholar]
- 42.Chhatwal, V. J., Ngoi, S. S., Chan, S. T., Chia, Y. W. & Moochhala, S. M. (1994) Carcinogenesis 15, 2081–2085. [DOI] [PubMed] [Google Scholar]
- 43.Dong, Z., Staroselsky, A. H., Qi, X., Xie, K. & Fidler, I. J. (1994) Cancer Res. 54, 789–793. [PubMed] [Google Scholar]
- 44.Jadeski, L. C., Chakraborty, C. & Lala, P. K. (2002) Can. J. Physiol. Pharmacol. 80, 125–135. [DOI] [PubMed] [Google Scholar]
- 45.Farias-Eisner, R., Sherman, M. P., Aeberhard, E. & Chaudhuri, G. (1994) Proc. Natl. Acad. Sci. USA 91, 9407–9411. [DOI] [PMC free article] [PubMed] [Google Scholar]
- 46.Thomsen, L. L., Lawton, F. G., Knowles, R. G., Beesley, J. E., Riveros-Moreno, V. & Moncada, S. (1994) Cancer Res. 54, 1352–1354. [PubMed] [Google Scholar]
- 47.Thomsen, L. L., Miles, D. W., Happerfield, L., Bobrow, L. G., Knowles, R. G. & Moncada, S. (1995) Br. J. Cancer 72, 41–44. [DOI] [PMC free article] [PubMed] [Google Scholar]
- 48.Duenas-Gonzalez, A., Isales, C. M., Mar Abad-Hernandez, M., Gonzalez-Sarmiento, R., Sangueza, O. & Rodriguez-Commes, J. (1997) Mod. Pathol. 10, 645–649. [PubMed] [Google Scholar]
- 49.Cobbs, C. S., Brenman, J. E., Aldape, K. D., Bredt, D. S. & Israel, M. A. (1995) Cancer Res. 55, 727–730. [PubMed] [Google Scholar]
- 50.Bentz, B. G., Haines, G. K., III, Lingen, M. W., Pelzer, H. J., Hanson, D. G. & Radosevich, J. A. (1999) Ann. Otol. Rhinol. Laryngol. 108, 781–787. [DOI] [PubMed] [Google Scholar]
- 51.Bentz, B. G., Barnes, M. N., Haines, G. K., Lurain, J. R., Hanson, D. G. & Radosevich, J. A. (1997) Tumour Biol. 18, 290–300. [DOI] [PubMed] [Google Scholar]
- 52.Bentz, B. G., Haines, G. K., III, Hanson, D. G. & Radosevich, J. A. (1998) Head Neck 20, 304–309. [DOI] [PubMed] [Google Scholar]
- 53.Pervin, S., Singh, R., Freije, W. A. & Chaudhuri, G. (2003) Cancer Res. 63, 8853–8860. [PubMed] [Google Scholar]
- 54.Marcu, M. G. & Neckers, L. M. (2003) Curr. Cancer Drug Targets 3, 343–347. [DOI] [PubMed] [Google Scholar]
- 55.An, W. G., Kanekal, M., Simon, M. C., Maltepe, E., Blagosklonny, M. V. & Neckers, L. M. (1998) Nature 392, 405–408. [DOI] [PubMed] [Google Scholar]
- 56.Lancaster, J. R., Jr. (1997) Nitric Oxide 1, 18–30. [DOI] [PubMed] [Google Scholar]
- 57.Thomas, D. D., Liu, X., Kantrow, S. P. & Lancaster, J. R., Jr. (2001) Proc. Natl. Acad. Sci. USA 98, 355–360. [DOI] [PMC free article] [PubMed] [Google Scholar]
- 58.Evans, S. M. & Koch, C. J. (2003) Cancer Lett. 195, 1–16. [DOI] [PubMed] [Google Scholar]


