

Significance
Most eukaryotic genomes harbor large amounts of highly repetitive satellite DNA primarily in centromeric regions. Closely related Drosophila species have nearly complete turnover of the types and quantities of simple sequence repeats. However, the detailed dynamics of turnover remains unclear, in part due to technical challenges in examining these highly repetitive sequences. We present a method (k-Seek) that identifies and quantifies simple sequence repeats from whole genome sequences. By characterizing natural variation in tandem repeats within Drosophila melanogaster, we identified many novel repeats and found that geographically isolated populations show differentiation patterns that are, unexpectedly, incongruous with demographic history. Moreover, repeats undergo correlated change in abundance, providing additional insight into the dynamics of satellite DNA and genome evolution.
Keywords: satellite DNA, population differentiation, rapid evolution
Abstract
Tandemly repeating satellite DNA elements in heterochromatin occupy a substantial portion of many eukaryotic genomes. Although often characterized as genomic parasites deleterious to the host, they also can be crucial for essential processes such as chromosome segregation. Adding to their interest, satellite DNA elements evolve at high rates; among Drosophila, closely related species often differ drastically in both the types and abundances of satellite repeats. However, due to technical challenges, the evolutionary mechanisms driving this rapid turnover remain unclear. Here we characterize natural variation in simple-sequence repeats of 2–10 bp from inbred Drosophila melanogaster lines derived from multiple populations, using a method we developed called k-Seek that analyzes unassembled Illumina sequence reads. In addition to quantifying all previously described satellite repeats, we identified many novel repeats of low to medium abundance. Many of the repeats show population differentiation, including two that are present in only some populations. Interestingly, the population structure inferred from overall satellite quantities does not recapitulate the expected population relationships based on the demographic history of D. melanogaster. We also find that some satellites of similar sequence composition are correlated across lines, revealing concerted evolution. Moreover, correlated satellites tend to be interspersed with each other, further suggesting that concerted change is partially driven by higher order structure. Surprisingly, we identified negative correlations among some satellites, suggesting antagonistic interactions. Our study demonstrates that current genome assemblies vastly underestimate the complexity, abundance, and variation of highly repetitive satellite DNA and presents approaches to understand their rapid evolutionary divergence.
Heterochromatin occupies a substantial portion of most eukaryotic genomes and contains vast quantities of tandemly repeating, noncoding DNA elements known as satellite DNA. These sequences, along with transposable elements, are often described as selfish elements or genomic parasites, as they can increase their copy numbers irrespective of host fitness (1, 2). Indeed, they can be highly deleterious for the host genome; for example, ectopic recombination between homologous satellite repeats can lead to devastating chromosomal rearrangements (3, 4). Consequently, these elements are mostly sequestered in repressive chromatin environments around the centromeres and telomeres where there is minimal recombination and transcriptional activity. However, paradoxically, repetitive sequences are also crucial components of euchromatic genomes, as they recruit the centromeric histone H3 variant to form centromeres in many species (5, 6), thereby affecting the fidelity of chromosome segregation (7, 8).
Adding to the perplexity, satellite DNA turns over at remarkably high rates between species (9, 10). In Drosophila melanogaster, satellite DNA is estimated to occupy over 20% of the genome. With the exception of the 359-bp (11), responder (12), and dodeca (13) satellites, most known satellites are tandem repeats of simple sequences (≤10 bp); the most abundant include AAGAG (aka GAGA-satellite), AACATAGAAT (aka 2L3L), and AATAT (11, 14, 15). In comparison, the genome of its sister species Drosophila simulans, from which D. melanogaster diverged ∼2.5 mya, is estimated to have only 5% satellite DNA, more than 10-fold less AAGAG, and little to no AACATAGAAT (16). For further contrast, nearly 50% of the Drosophila virilis and less than 0.5% of Drosophila erecta genomes are satellite DNA (16, 17). Strikingly, such rapid changes in genomes have been implicated in postzygotic isolation of species in the form of hybrid incompatibility in several species of flies (18–20), demonstrating the critical role satellite DNA has on the evolution of genomes and species.
The expansions and contractions of satellite sequences are thought to result from a combination of molecular events such as unequal crossing over (21), rolling circle replication (22), and polymerase slippage (23). Early population genetic studies assumed that satellite DNA has no function and that small changes in copy number are neutral, although total abundance may be under constraint due to the potential burden on metabolism, nuclear volume, and DNA replication (24). Under such assumptions, early simulation studies demonstrated that unequal crossing over, drift, and reduced recombination are sufficient to generate long stretches of satellite DNA from random sequences (21, 25). Nevertheless, selection also appears to play an important role in shaping satellite DNA. For example, Stephan and Cho (1993) showed that selection is important in determining the length and heterogeneity of satellites, suggesting that the drastic interspecific differences may not be neutral (26). Since then, multiple authors have emphasized the importance of both genetic drift and natural selection in the evolution of repetitive DNA (27, 28). Furthermore, recent studies have shown that repetitive sequences can have remarkable effects on the rest of the genome. For example, natural variation in the Y chromosome, which is nearly entirely heterochromatic, can modulate differential gene expression and cause variable phenotypes including differences in immune response (29, 30). These results reveal that changes in repetitive sequences can have fitness consequences on which selection will act. Meiotic drive models have also been proposed, in which centromeric satellites that bias the rate of transmission in female meiosis will quickly fix in the population (8, 31), providing an additional mechanism for rapid turnover of satellite DNA.
However, technical challenges have hindered research on heterochromatin. Because heterochromatic regions do not recombine, common genetic manipulations are mostly ineffective. Repetitive sequences, particularly low complexity satellite DNA, present severe challenges for making sequence assemblies and unique alignments (32). A handful of techniques have been applied to study heterochromatin. High-density cesium–chloride gradient centrifugation has been instrumental in identifying major satellite blocks of different buoyancy, but fails to isolate less abundant repeats (11). Hybridization approaches can only label known repeats and are often difficult to quantify precisely. More recently, flow cytometry has been used to indirectly estimate heterochromatic content, but it cannot distinguish the different types of satellites contributing to the observed total (33).
To address these shortfalls, we developed a computational method, named k-Seek, that exhaustively identifies and quantifies short tandemly repeating sequences (kmers) from whole genome sequences. We applied this method to 84 inbred D. melanogaster lines derived from natural populations and characterized the natural variation in satellite DNA. This allowed us to answer three questions: (i) What are the abundances of all simple tandem repeat sequences in D. melanogaster? (ii) How are their quantities changing within species and populations? (iii) How do they change with respect to each other?
Results
Identification and Quantification of Tandem Repeats.
We developed and validated a software package (k-Seek) that identifies and quantifies tandem repeats of 2 to 10mers from short read-based whole genome sequences (Fig. 1A). In short, each raw read is first broken into small fragments of equal lengths. Identical fragments are then clustered. Whereas complex sequences are expected to yield clusters with very few members, short repetitive fragments will form a large cluster. Once the kmer is identified, the number of repeats from the read is then tallied based on a word-search procedure. To capture tandem counts, only kmers that are either immediately preceded or followed by the same kmer are scored. Additionally, we exclude tandem repeats that span less than 50 bp to avoid microsatellites and to guard against ascertainment bias for small kmers (2–4mers), as they are easier to identify from short stretches of DNA than larger kmers. Counts are summed across all reads and divided by the average read depth of the uniquely mapped autosomal genome, allowing us to estimate the abundance of every identified kmer in the genome (for detailed description, see SI Appendix). Benchmarking with simulated reads reveals that k-Seek is highly accurate at identifying tandem repeats from 100-bp reads, and the counts are robust against point mutations and indels (Fig. 1B and SI Appendix, Fig. S1).
Fig. 1.

The k-Seek package identifies and quantifies tandem kmers. (A) k-finder identifies kmers de novo by fragmenting short reads and grouping them. k-counter then quantifies the number of tandem occurrences. (B) k-Seek applied to simulated 100-bp reads containing tandem arrays of kmers of different lengths. Simulated tandem arrays contained either perfect repeats, up to four substitutions (subs), or indels. Frequency of correct identification is plotted. (C) Variability of kmers between three independent library preparations is plotted against the kmer abundance. Some of the highly variable kmers are labeled. Dotted line depicts the line of best fit. (D) Dot blot with DNA from 27 lines hybridized with a probe targeting AACATAAGAT. Signal intensity is plotted against abundance inferred by k-Seek, both relative to a reference line, with regression line plotted in red. Error bars are SEs calculated from three replicates of each sample in the dot blot.
To determine the reproducibility of k-Seek across library preparations, we applied it to three DNA libraries independently generated from line ZW155. The kmer quantities are highly correlated (Pearson’s r ranges from 0.976 to 0.988; SI Appendix, Fig. S2). Furthermore, the variability is not influenced by the abundance of the repeat (Fig. 1C). Nevertheless, several kmers have an elevated degree of variation. To independently assess the accuracy of k-Seek, we quantified the abundance of the 10mer AACATAGAAT by measuring the radioactivity of [32]P-labeled probes hybridized to blotted DNA from 27 lines. We found significant correlation between the methods (Fig. 1D; Pearson’s r = 0.559, P < 0.005). We also attempted to quantify the 5mer AAGAG using the same approach. However, this probe was problematic, and we were unable to obtain consistent results across replicates and experiments (SI Appendix, Fig. S3).
Identification of Known and Novel kmers.
We applied k-Seek to a collection of 84 inbred D. melanogaster lines sampled from Beijing, Ithaca, Netherlands, Tasmania, and Zimbabwe, known as the Global Diversity lines. Although there are 73,001 possible 2–10mers, we only identified 72 distinct kmers with a population median abundance of more than 100 bp per 1× depth across all lines (SI Appendix, Table S1). This list includes all previously identified kmers (Fig. 2A and SI Appendix, Dataset S1). As expected, AAGAG and AACATAGAAT have the largest quantities, as they are two of the most abundant satellites known in D. melanogaster. Curiously, we detected AATAT at substantially lower abundance than expected. This is likely due to underamplification of sequences depleted of CGs during the PCR stage of library preparation (34). The most abundant kmer lengths were 5mers and 10mers, whereas only a single 4mer was found. Most but not all (58/72) follow the (RRN)m(RN)n formula, where R represents a purine and N represents any nucleotide, thought to be canonical for D. melanogaster satellites (11).
Fig. 2.
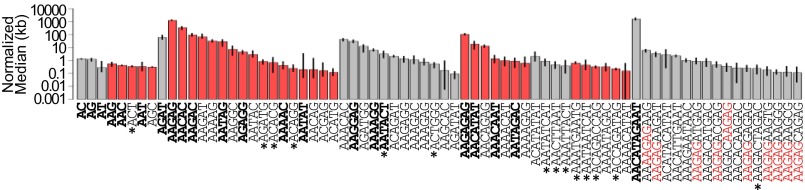
kmer abundance. Medians of the top kmers across all strains are plotted in log10 scale. Error bars represent the first and third quartiles. Gray and red bars are even- and odd-number kmers, respectively. Previously characterized kmers are labeled in bold. kmers not following (RRN)m(RN)n are labeled by an asterisk. AAGAG-containing 10mers are in red.
Among the 72 kmers, 50 were previously unknown. Most are 5 and 10mers ranging from a normalized mean abundance of 105 bp (AAGAGCAGAG) to 66,564 bp (AAGAT). Eleven of the 16 new 10mers contain AAGAG, suggesting that they originated from a mutation in one copy of AAGAG, followed by amplification of it and its nonmutated neighbor. Additionally, we find four 8mers and six 9mers, lengths that had not previously been identified. Notably, most of the 8–9mers (7/10) do not follow the (RRN)m(RN)n formula and may therefore represent a qualitatively distinct group of satellite sequences.
Population Structure.
Across all Global Diversity lines, the average total kmer count is 4.03 Mb per 1× read depth. Strikingly, the lowest and highest lines differ by 2.50-fold (equating to 4.29 Mb difference), indicating high intraspecific variability (SI Appendix, Fig. S4). AAGAG and AACATAGAAT, the two most abundant kmers, comprise 74% of the total kmer counts on average but can be as high as 88% and as low as 57%, revealing marked differences in the repeat composition among lines.
The phylogenetic relationships of the lines were inferred from genome-wide SNP calls, and that analysis largely recapitulates the expected demographic history of D. melanogaster, with an African origin and a relatively recent global spreading along human trade routes (for review, see ref. 35). The simple expectation is that kmer abundance will also reflect the same population structure. However, hierarchical clustering of kmer abundances failed to differentiate the lines into their respective populations (SI Appendix, Fig. S5). To further investigate, we applied principal components analysis on the top 100 kmers (Fig. 3A). The Zimbabwe lines fall into a diffuse cluster with minimal overlap with other populations, as expected. The Netherlands lines broadly cluster with the Tasmanian lines, consistent with the introduction of D. melanogaster to Australia by European settlers (36). Surprisingly, although, the Beijing lines largely overlap with the Ithaca lines, even though North American populations are thought to be of European origin (36, 37) and distinct from Asian populations established shortly after the initial out-of-Africa migration (38). These discrepancies suggest that satellite DNA abundance is subject to a distinct evolutionary history from the rest of the genome.
Fig. 3.

Population structure of kmers. (A) Lines are plotted based on the first three principal components derived from the top 100 kmers. Lines from the same populations are circled with the respective colors. (B) Distribution of population differentiation index RST. (C–E) Distribution of abundance of selected kmers in the five populations. (F) Abundance of AACATATAAT and AAAATAGAAT across lines. (G) FISH applied to mitotic chromosomes of lines from Beijing and Tasmania. Probes for AAGAG are labeled green, AACATATAAT red, and DAPI blue. Arrowheads indicate red foci.
To infer the population differences for each kmer, we applied Rst statistics, assuming a step-wise mutational model (Fig. 3B) (39, 40). Of the top 100 kmers, the majority (n = 54) display very little population differentiation; many (n = 46) have an Rst of >0.1, showing appreciable population differentiation; and some (n = 7) have an Rst of >0.4, revealing high population differences. For example, the AT 2mer has a startlingly high Rst of 0.554, which appears to be due to elevated levels in the Netherlands and Tasmania populations (Fig. 3C). AAGAG and AACATAGAAT, the most abundant kmers, have moderate levels of differentiation, with the Zimbabwe population having the highest and lowest abundance, respectively (Fig. 3 D and E). Because different kmers have distinct patterns of population differentiation, we conclude that they experience different evolutionary dynamics.
Among the most differentiated kmers, two 10mers (AACATATAAT and AAAATAGAAT) are surprisingly found only in the Netherlands, Tasmania, and Zimbabwe populations, while being completely absent in the Beijing and Ithaca populations (Fig. 3F). Within the Tasmania and Netherlands populations, there is high variation even among individual lines, which suggests high turnover rates. To confirm the presence/absence of polymorphism, we designed FISH probes targeting AACATATAAT and observed fluorescent foci from mitotic chromosomes of the Netherland and Tasmania but not the Beijing lines (Fig. 3G and SI Appendix, Fig. S6). The foci are autosomal and appear to be centromeric, as they are located near the primary constriction and do not overlap with the predominantly pericentric AAGAG foci. This finding provides, to our knowledge, the first report of population-specific satellite DNA in Drosophila and further underscores the high rate of satellite DNA turnover.
Concerted Evolution of kmer Abundance.
Interestingly, the two population-specific 10mers are highly positively correlated across lines (Fig. 3G; Pearson’s r = 0.993, P < 2.2 × 10⁻¹⁶), suggesting that they undergo coordinated changes in copy number. To comprehensively identify kmers that are evolving in a concerted fashion, we generated a pairwise correlation matrix for the top 100 kmers and clustered those that are highly correlated (Fig. 4A and SI Appendix, Fig. S7). This was accomplished using Modulated Modularity Clustering, which rearranges rows and columns of the correlation matrix to identify clusters of variables with maximal pairwise correlations among all cluster members (in this case, kmers) without predetermined knowledge or an arbitrary decision on number of clusters (41). Overall, we find nine major clusters of correlated kmers. As expected, the two population-specific 10mers are found within the same cluster along with the AATAT 5mer (Fig. 4C). Clustering appears to be driven in part by sequence similarity; several clusters are either AT-rich, AG-rich, or AC-rich. For example, the AG-rich cluster contains AAGAG, as well as related sequences AAGAGAG and AAGAGAGAG. However, many highly related kmers fall into separate clusters—for example, AACATAGAAT (the most abundant 10mer) and AACATATAAT (one of the two population-specific kmers)—even though they only differ by one nucleotide. Surprisingly, we also observe relatively weak but significant negative correlations among a small number of kmers (Fig. 4A and SI Appendix, Fig. S8). Notably, the AG-rich kmers are negatively correlated with the AT-rich kmers; not only are the two respective clusters anticorrelated (Fig. 4A, arrowhead), the 10mer AAGAGCAGAG that is grouped within the AT-rich cluster is also negatively correlated with all other AT-rich kmers (Fig. 4B). These negative correlations suggest that kmers can have antagonistic relationships such that expansion of one comes at the expense of another.
Fig. 4.

Correlation structure of kmer variation. (A) Pair-wise correlation matrix is reorganized such that kmers with correlated change across lines are clustered into groups demarcated by boxes. Colors represent strength of Spearman’s correlation. Arrowhead indicates clusters that are negatively correlated. (B–D) Magnified clusters with AT-rich, the two population-specific (bold), and AG-rich kmers, respectively. For the fully labeled matrix, see SI Appendix, Fig. S6.
Interspersion of kmer Blocks Drives Correlation.
One possible cause of the observed positive correlations is that correlated kmers represent physically linked and interspersed satellite blocks. Therefore, deletions or duplications of these repetitive blocks will decrease and increase both kmers in concert. To test this possibility, we identified, across all lines, paired-end reads where kmers are found in both mate pairs and determined the frequency of their occurrences relative to the abundance of the identified kmers (Fig. 5A). As expected, almost every kmer is most frequently paired with itself, reflecting that many comprise sizeable and homogenous blocks. However, kmers found within positively correlated clusters tend to be found in mate pairs more frequently than those outside (Fig. 5 B–D), consistent with our hypothesis. For example, kmers within the AG-rich cluster are highly interspersed with one another. This is further supported by a significant and positive association between the correlation values and the interspersion frequency of the kmers (Fig. 5E).
Fig. 5.

Interspersed kmer blocks. (A) Paired-end reads are used to infer interspersion. Interspersed kmers will have many mate pairs spanning the junctions (Left). Large kmer blocks are in tandem and will have few mate pairs containing different kmers (Middle). Interspersion of small blocks (∼450 bp) will yield only mate-pair gapping junctions (Right). (B) Interspersion frequency matrix for kmers organized as in Fig. 4A. (C and D) Magnified cluster containing the two population-specific 10mers (in bold) and AG-rich cluster, respectively. (E) The correlation strength for each kmer pair (from Fig. 4A) is plotted against the interspersed frequency (from B). Self-correlation and interspersion (cells across the diagonal) and pairs with no interspersion are excluded. Regression line is plotted in red (Pearson's r = 0.325, P = 9.77 x 10⁻¹⁵).
The two population-specific 10mers identified are also highly interspersed (Fig. 5C). Interestingly, they are most frequently paired with each other, and mate pairs containing the same 10mer are rarely found. This result suggests that the two 10mers are interspersed with each other in small blocks that are roughly the length of the insert size, which is ∼450 bp (Fig. 5A). This is also true for the AAC 3mer and the AAAATAACAT 10mer, suggesting that they also exist in small interdigitated blocks.
We note that there are many instances where interspersed kmers are not correlated. This is unsurprising, as interspersion itself is insufficient to drive correlated change if the blocks do not experience duplication and/or deletion. Additionally, for kmers that are found interspersed with many other kmers, presumably in separate blocks, independent indels in different blocks will result in local concerted change in abundance, but their abundances aggregated across the genome will likely be uncorrelated. Of further interest are correlated kmers that are not interspersed, such as the two population-specific 10mers and the 5mer AATAT, as they indicate additional mechanisms underlying the concerted change. However, it is difficult to distinguish these from interspersion that we fail to capture due to low coverage or underrepresentation. Furthermore, any junction between satellite blocks that is gapped by complex sequences, such as transposable elements, will also likely be missed.
Discussion
Many important questions in heterochromatin biology are now accessible using our software pipeline (k-Seek). Previously, identification of satellite sequences was mostly accomplished through labor-intensive methods that have low sensitivity (16). As a result, the current catalog of satellite DNA contains exclusively kmers that are present in large quantities. Our method is accurate at identifying tandem kmers and discovered many previously unknown kmers of low to medium abundance. We expected that PCR would be a major source of bias during library preparation as the polymerase underamplifies AT-rich sequences, and we indeed found lower abundance of AATAT compared with previous characterizations (11). Nevertheless, using three replicate libraries made from a single sample, we found such bias to be consistent across the libraries, allowing us to characterize population variation of individual kmers.
Potential Causes of Population Variation.
By applying k-Seek to the Drosophila Global Diversity lines, we characterized natural variation in heterochromatin repeat structure. The mean satellite abundance in a population is expected to approximate an equilibrium determined by the mutation rate, the degree of selective constraint, potentially positive selection, and population size (24, 25). For many kmers, the difference between populations is small, and the low Rst suggests a high rate of migration or turnover. Nevertheless, we identified multiple kmers with appreciable to high population differentiation. Notably, the pattern of interpopulation differentiation is also variable among repeats, revealing that some kmers evolve relatively independently of others. The process driving the population differences could be either neutral drift or natural selection. According to the out-of-Africa model, the Zimbabwe population is expected to have the highest level of genetic variation, provided that the differences are nearly neutral. Although this is, as expected, true for all kmers considered together (SI Appendix, Fig. S9), we found many exceptions that may be revealing of their modes of evolution. For example, the Netherlands population not only has a significantly higher abundance of the AT 2mer compared with Zimbabwe, but the between-line variability is also substantially greater. These differences may be indicative of a relaxation of constraint within the Netherlands population, allowing for labile expansion and contraction. In contrast, the differentiation pattern of AAGAG shows significant reduction in the non-African populations, potentially reflecting an increase in the level of selective constraint after the out-of-Africa migration, or reduced variability due to the out-of-Africa bottleneck as is seen for most of the genome (42).
The incongruity between the population structure inferred from kmer abundance and from demographic history and SNPs is intriguing. This is reminiscent of the well-documented phenomenon of the homogenization of multicopy gene families and tandemly arrayed genes such as rDNA, a process that has been called “molecular drive” (43). Resulting from sequence exchanges via gene conversion, paralogs that predate the species split may display a high degree of within-species sequence homogeneity. Depending on the stochastic or biased dynamics of the process, phylogenetic relationships of arrays between species and by extension populations may not be preserved in these sequences.
Alternatively, the discrepancy may be due to incomplete lineage sorting (44) of some repeats. In one possible scenario, individuals without the correlated AT-rich repeats segregated at low frequency in the European population and were subsequently introduced by chance only to North American but not to Australia. Additionally, we cannot rule out the possibility that the similarity between the Beijing and Ithaca lines is due to selection from a common environmental pressure.
Meiotic drive and segregation distortion present an additional explanation of strong population-specific patterns. In these scenarios, chromosomes with a particular kmer abundance or composition can have a segregation advantage in some populations. If these repetitive sequences have pleiotropic deleterious effects, fixation of a suppressor can quickly purge these sequences from populations. Our discovery of the two population-specific 10mers (Fig. 3G) is particularly striking and suggestive of the rapid evolution predicted by most models of meiotic drive. Notably, these lines provide genetic material for direct empirical tests of possible segregation differences (now underway).
Concerted Change of kmer Abundances.
We identified several groups of highly correlated repeats, revealing that different satellites undergo concerted evolution in abundance. The fact that kmers within a correlated group have sequence similarity is suggestive of the potential underlying mechanism. Several DNA binding proteins have been identified to target satellite DNA (for review, see ref. 45). GAGA-factor is a transcription factor responsible for key developmental regulation (46), heat-shock response, and chromatin remodeling (47, 48) that localizes to AAGAG and AAGAGAG satellites during mitosis (49, 50). Here, we showed that these two are correlated along with other AG-rich kmers, thus raising the possibility that binding to a common protein drives concerted change. In one scenario, an increase in GAGA-factor more effectively packages AG-rich repeats into heterochromatin, thereby raising host tolerance to the repeats. Subsequently, both repeats will increase in number. Conversely, a decrease in the protein level may result in suboptimal regulation of repeats and reduction in organismal fitness; therefore, selection will favor individuals with less of the targeted repeats, resulting in correlated contraction. Similarly, the concerted change between AT-rich kmers may reflect proteins that recognize AT-rich satellites, including origin recognition complex subunit 2, an essential component of the complex that initiates DNA replication (51), and D1, an essential protein implicated in chromatin remodeling (52). Additionally, the PROD protein (proliferation disrupter) binds to the AACATAGAAT 10mer on mitotic chromosomes (53). Our results suggest that it may also bind to other satellites, as several kmers are correlated with this 10mer.
However, the observed concerted changes are not necessarily driven by selection. We demonstrate that the structure of kmers can also account for some of the observed correlated patterns. For satellite blocks that are interspersed with each other, duplications or deletions of the region will increase or decrease the kmers together. Indeed, kmers that are highly interspersed tend to have higher correlation in abundance, and the high interspersion of the two population-specific 10mers serves as a prime example. AAGAG and AAGAGAG are also moderately interspersed, suggesting that GAGA-factor binding may not be the only mechanism driving their correlation. We therefore conclude that the complex architecture of satellite DNA is likely the result of both neutral and selected mutational changes.
Surprisingly, we also identified negative correlations, albeit weak ones, notably between the AT- and AG-rich kmers. We speculate that such antagonistic interactions reflect an optimal load of satellite DNA that genomes can tolerate. Therefore, the deleterious effect of an increase in one satellite DNA group can be alleviated by a decrease in a different group. This load may be determined by the fitness benefits of maintaining an optimal genome size (24), but we find this unlikely given the variability of genome sizes among as well as within species (54) and that total kmer quantities differ greatly between lines. Alternatively, the load may be chromosome-specific, as satellite DNAs often have chromosome-specific distributions. An optimal load of satellite DNA may ensure faithful chromosomal transmission or prevent deleterious rearrangements, as lengthy satellite blocks may be more prone to unequal crossing over or ectopic recombination. Regardless of the specific molecular and evolutionary mechanism, the observed antagonistic relationships intimate the curious possibility that satellite DNAs are at odds not only with the host genome but also with each other.
Materials and Methods
Fly Lines and Sequence Reads.
The 84 lines of D. melanogaster used in this study were sib-mated from isofemales lines (55). Whole genome shotgun sequencing was done on the Illumina platform with DNA extracted from adult females, sequenced to a depth of 12.5× for each line using paired-end 100-bp reads.
Normalizing Tandem kmer Counts.
To normalize kmer counts between lines, we divided all counts by the average read depth at autosomal regions and then multiplied the counts by the kmer length, to obtain number of nucleotides per 1× depth (SI Appendix, Dataset S1). Average read depth was obtained by mapping sequences with BWA to D. melanogaster reference r.546 (Flybase). We used Picard tools to compute the read depth distribution and averaged across the autosomes. We note that very few reads map to the Y chromosome (sequences were of females), indicating very little contribution from sperm in the reproductive tracts.
Simulation of Reads with Tandem Repeats.
For each kmer length (k = 2–10), we generated 600,000 100-bp reads. Each read contained a random number of tandem occurrences for a randomly generated kmer. One-third of the reads contained perfect tandem repeats, one-third contained 1–4 point mutations in the tandem repeats, and one-third contained an indel of varying size within the tandem repeats. k-Seek was applied to the simulated reads, and correct identification for tandem repeats greater than 50 bp was recorded. We also generated 200,000 100-bp reads containing random sequences from which no kmers were identified.
Quantifying Satellites with Dot Blots.
We radiolabeled 50 pmol of AACATAAGATAACATAAGATAACATAAGAT (Sigma) with [γ-32]ATP using T4 polynucleotide kinase (NEB), followed by clean-up with Micro Bio-Spin P30 Column (Bio-Rad). The probe was denatured at 95 °C for 10 min and immediately put on ice. We extracted the DNA of 50 females from 27 lines with the DNeasy kit (Qiagen). Using a Bio-Dot Microfiltration Apparatus (Bio-Rad), we loaded 100 ng of each sample in 0.4 M NaOH and 10 mM EDTA in triplicate onto a Zeta-Probe GT membrane (Bio-Rad) following the manufacturer’s instructions, in addition to a threefold serial dilution of DNA from line B10. The placement of samples was randomized. After drying at 80 °C for 30 min, the membrane was incubated in 25 mL of hybridization buffer [0.5 M sodium phosphate, 7% (wt/vol) SDS] with 100 µL of denatured salmon sperm DNA (10 mg/mL) for 30 min at 60 °C in a rotating oven. The buffer was then replaced with 25 mL of fresh hybridization buffer containing the denatured probe and incubated overnight. The membrane was washed at 68 °C twice with 50 mL 1× SSC and 0.1% SDS followed by two washes with 0.1× SSC and 0.1% SDS. The membrane was wrapped with plastic wrap, placed into a phosphoimager for 48 h, and scanned with a Typhoon 9400. Signal intensity was processed in ImageJ with background subtraction. The intensity of each sample was calculated according to the standard curve constructed from the dilution series.
In Situ Hybridization.
Brains from wandering third instar larvae were dissected and washed in 0.7% NaCl, transferred to 0.5% sodium citrate for 10 min, followed by fixation in 20 μL of 50% acetic acid and 4% paraformaldehyde for 2 min on a siliconized coverslip. The samples were then squashed onto a glass slide and flash frozen in liquid nitrogen. Slides were then immersed in 100% EtOH for 10 min and air-dried at room temperature for 2–3 d with the coverslip removed. Hybridization procedure was conducted as in ref. 56. We used 250 ng of AAGAGAAGAGAAGAGAAGAGAAGAG-Cy3 and AAAATAGAATAAAATAGAATAAAATAGAAT-Cy5 probes (Sigma) for the probe mixture. The samples were imaged on a Zeiss confocal microscope, and images were processed on Zen software.
kmer Correlation Matrix.
We applied the publicly available software Modulated Modularity Clustering (41) on the normalized counts of the top 100 kmers to generate the clustered correlation matrix.
Interspersed kmer Analysis.
Using custom Perl scripts on .sep outputs from k_counter.pl, we identified the number of mate pairs where both reads contain kmers and tallied across all lines to obtain , the number of mate pairs containing kmer and kmer . Interspersed frequency is calculated as , where and and are number of pairs where at least one of the reads contains kmer and kmer , respectively.
Supplementary Material
Acknowledgments
We thank J. Lis and J. Werner for help with probe labeling, and the Cornell Biotechnology Resource Center Imaging Facility for assistance with the FISH imaging. This work was supported by National Institutes of Health Grants R01 GM074737 (to D.A.B.) and R01 GM64590 (to A.G.C.).
Footnotes
The authors declare no conflict of interest.
This article contains supporting information online at www.pnas.org/lookup/suppl/doi:10.1073/pnas.1421951112/-/DCSupplemental.
References
- 1.Doolittle WF, Sapienza C. Selfish genes, the phenotype paradigm and genome evolution. Nature. 1980;284(5757):601–603. doi: 10.1038/284601a0. [DOI] [PubMed] [Google Scholar]
- 2.Orgel LE, Crick FH. Selfish DNA: The ultimate parasite. Nature. 1980;284(5757):604–607. doi: 10.1038/284604a0. [DOI] [PubMed] [Google Scholar]
- 3.Peng JC, Karpen GH. H3K9 methylation and RNA interference regulate nucleolar organization and repeated DNA stability. Nat Cell Biol. 2007;9(1):25–35. doi: 10.1038/ncb1514. [DOI] [PMC free article] [PubMed] [Google Scholar]
- 4.Bzymek M, Lovett ST. Instability of repetitive DNA sequences: The role of replication in multiple mechanisms. Proc Natl Acad Sci USA. 2001;98(15):8319–8325. doi: 10.1073/pnas.111008398. [DOI] [PMC free article] [PubMed] [Google Scholar]
- 5.Shelby RD, Vafa O, Sullivan KF. Assembly of CENP-A into centromeric chromatin requires a cooperative array of nucleosomal DNA contact sites. J Cell Biol. 1997;136(3):501–513. doi: 10.1083/jcb.136.3.501. [DOI] [PMC free article] [PubMed] [Google Scholar]
- 6.Malik HS, Henikoff S. Adaptive evolution of Cid, a centromere-specific histone in Drosophila. Genetics. 2001;157(3):1293–1298. doi: 10.1093/genetics/157.3.1293. [DOI] [PMC free article] [PubMed] [Google Scholar]
- 7.Karpen GH, Le MH, Le H. Centric heterochromatin and the efficiency of achiasmate disjunction in Drosophila female meiosis. Science. 1996;273(5271):118–122. doi: 10.1126/science.273.5271.118. [DOI] [PubMed] [Google Scholar]
- 8.Henikoff S, Ahmad K, Malik HS. The centromere paradox: Stable inheritance with rapidly evolving DNA. Science. 2001;293(5532):1098–1102. doi: 10.1126/science.1062939. [DOI] [PubMed] [Google Scholar]
- 9.Lohe AR, Roberts PA. Evolution of DNA in heterochromatin: The Drosophila melanogaster sibling species subgroup as a resource. Genetica. 2000;109(1-2):125–130. doi: 10.1023/a:1026588217432. [DOI] [PubMed] [Google Scholar]
- 10.Kamm A, Galasso I, Schmidt T, Heslop-Harrison JS. Analysis of a repetitive DNA family from Arabidopsis arenosa and relationships between Arabidopsis species. Plant Mol Biol. 1995;27(5):853–862. doi: 10.1007/BF00037014. [DOI] [PubMed] [Google Scholar]
- 11.Lohe AR, Brutlag DL. Multiplicity of satellite DNA sequences in Drosophila melanogaster. Proc Natl Acad Sci USA. 1986;83(3):696–700. doi: 10.1073/pnas.83.3.696. [DOI] [PMC free article] [PubMed] [Google Scholar]
- 12.Wu C-I, Lyttle TW, Wu M-L, Lin G-F. Association between a satellite DNA sequence and the Responder of Segregation Distorter in D. melanogaster. Cell. 1988;54(2):179–189. doi: 10.1016/0092-8674(88)90550-8. [DOI] [PubMed] [Google Scholar]
- 13.Abad JP, et al. Dodeca satellite: A conserved G+C-rich satellite from the centromeric heterochromatin of Drosophila melanogaster. Proc Natl Acad Sci USA. 1992;89(10):4663–4667. doi: 10.1073/pnas.89.10.4663. [DOI] [PMC free article] [PubMed] [Google Scholar]
- 14.Peacock WJ, et al. The organization of highly repeated DNA sequences in Drosophila melanogaster chromosomes. Cold Spring Harb Symp Quant Biol. 1974;38:405–416. doi: 10.1101/sqb.1974.038.01.043. [DOI] [PubMed] [Google Scholar]
- 15.Lohe AR, Hilliker AJ, Roberts PA. Mapping simple repeated DNA sequences in heterochromatin of Drosophila melanogaster. Genetics. 1993;134(4):1149–1174. doi: 10.1093/genetics/134.4.1149. [DOI] [PMC free article] [PubMed] [Google Scholar]
- 16.Lohe AR, Brutlag DL. Identical satellite DNA sequences in sibling species of Drosophila. J Mol Biol. 1987;194(2):161–170. doi: 10.1016/0022-2836(87)90365-2. [DOI] [PubMed] [Google Scholar]
- 17.Gall JG, Cohen EH, Polan ML. Reptitive DNA sequences in drosophila. Chromosoma. 1971;33(3):319–344. doi: 10.1007/BF00284948. [DOI] [PubMed] [Google Scholar]
- 18.Ferree PM, Barbash DA. Species-specific heterochromatin prevents mitotic chromosome segregation to cause hybrid lethality in Drosophila. PLoS Biol. 2009;7(10):e1000234. doi: 10.1371/journal.pbio.1000234. [DOI] [PMC free article] [PubMed] [Google Scholar]
- 19.Bayes JJ, Malik HS. Altered heterochromatin binding by a hybrid sterility protein in Drosophila sibling species. Science. 2009;326(5959):1538–1541. doi: 10.1126/science.1181756. [DOI] [PMC free article] [PubMed] [Google Scholar]
- 20.Satyaki PRV, et al. The Hmr and Lhr hybrid incompatibility genes suppress a broad range of heterochromatic repeats. PLoS Genet. 2014;10(3):e1004240. doi: 10.1371/journal.pgen.1004240. [DOI] [PMC free article] [PubMed] [Google Scholar]
- 21.Smith GP. Evolution of repeated DNA sequences by unequal crossover. Science. 1976;191(4227):528–535. doi: 10.1126/science.1251186. [DOI] [PubMed] [Google Scholar]
- 22.Okumura K, Kiyama R, Oishi M. Sequence analyses of extrachromosomal Sau3A and related family DNA: Analysis of recombination in the excision event. Nucleic Acids Res. 1987;15(18):7477–7489. doi: 10.1093/nar/15.18.7477. [DOI] [PMC free article] [PubMed] [Google Scholar]
- 23.Levinson G, Gutman GA. Slipped-strand mispairing: A major mechanism for DNA sequence evolution. Mol Biol Evol. 1987;4(3):203–221. doi: 10.1093/oxfordjournals.molbev.a040442. [DOI] [PubMed] [Google Scholar]
- 24.Charlesworth B, Sniegowski P, Stephan W. The evolutionary dynamics of repetitive DNA in eukaryotes. Nature. 1994;371(6494):215–220. doi: 10.1038/371215a0. [DOI] [PubMed] [Google Scholar]
- 25.Stephan W. Recombination and the evolution of satellite DNA. Genet Res. 1986;47(3):167–174. doi: 10.1017/s0016672300023089. [DOI] [PubMed] [Google Scholar]
- 26.Stephan W, Cho S. Possible role of natural selection in the formation of tandem-repetitive noncoding DNA. Genetics. 1994;136(1):333–341. doi: 10.1093/genetics/136.1.333. [DOI] [PMC free article] [PubMed] [Google Scholar]
- 27.Hartl DL. Molecular melodies in high and low C. Nat Rev Genet. 2000;1(2):145–149. doi: 10.1038/35038580. [DOI] [PubMed] [Google Scholar]
- 28.Petrov DA. Evolution of genome size: New approaches to an old problem. Trends Genet. 2001;17(1):23–28. doi: 10.1016/s0168-9525(00)02157-0. [DOI] [PubMed] [Google Scholar]
- 29.Lemos B, Araripe LO, Hartl DL. Polymorphic Y chromosomes harbor cryptic variation with manifold functional consequences. Science. 2008;319(5859):91–93. doi: 10.1126/science.1148861. [DOI] [PubMed] [Google Scholar]
- 30.Lemos B, Branco AT, Hartl DL. Epigenetic effects of polymorphic Y chromosomes modulate chromatin components, immune response, and sexual conflict. Proc Natl Acad Sci USA. 2010;107(36):15826–15831. doi: 10.1073/pnas.1010383107. [DOI] [PMC free article] [PubMed] [Google Scholar]
- 31.Malik HS. The centromere-drive hypothesis: A simple basis for centromere complexity. Prog Mol Subcell Biol. 2009;48:33–52. doi: 10.1007/978-3-642-00182-6_2. [DOI] [PubMed] [Google Scholar]
- 32.Hoskins RA, et al. Sequence finishing and mapping of Drosophila melanogaster heterochromatin. Science. 2007;316(5831):1625–1628. doi: 10.1126/science.1139816. [DOI] [PMC free article] [PubMed] [Google Scholar]
- 33.Bosco G, Campbell P, Leiva-Neto JT, Markow TA. Analysis of Drosophila species genome size and satellite DNA content reveals significant differences among strains as well as between species. Genetics. 2007;177(3):1277–1290. doi: 10.1534/genetics.107.075069. [DOI] [PMC free article] [PubMed] [Google Scholar]
- 34.Aird D, et al. Analyzing and minimizing PCR amplification bias in Illumina sequencing libraries. Genome Biol. 2011;12(2):R18. doi: 10.1186/gb-2011-12-2-r18. [DOI] [PMC free article] [PubMed] [Google Scholar]
- 35.Stephan W, Li H. The recent demographic and adaptive history of Drosophila melanogaster. Heredity (Edinb) 2007;98(2):65–68. doi: 10.1038/sj.hdy.6800901. [DOI] [PubMed] [Google Scholar]
- 36.David JR, Capy P. Genetic variation of Drosophila melanogaster natural populations. Trends Genet. 1988;4(4):106–111. doi: 10.1016/0168-9525(88)90098-4. [DOI] [PubMed] [Google Scholar]
- 37.Begun DJ, Aquadro CF. African and North American populations of Drosophila melanogaster are very different at the DNA level. Nature. 1993;365(6446):548–550. doi: 10.1038/365548a0. [DOI] [PubMed] [Google Scholar]
- 38.Schlötterer C, Neumeier H, Sousa C, Nolte V. Highly structured Asian Drosophila melanogaster populations: A new tool for hitchhiking mapping? Genetics. 2006;172(1):287–292. doi: 10.1534/genetics.105.045831. [DOI] [PMC free article] [PubMed] [Google Scholar]
- 39.Slatkin M. A measure of population subdivision based on microsatellite allele frequencies. Genetics. 1995;139(1):457–462. doi: 10.1093/genetics/139.1.457. [DOI] [PMC free article] [PubMed] [Google Scholar]
- 40.Hardy OJ, Charbonnel N, Fréville H, Heuertz M. Microsatellite allele sizes: A simple test to assess their significance on genetic differentiation. Genetics. 2003;163(4):1467–1482. doi: 10.1093/genetics/163.4.1467. [DOI] [PMC free article] [PubMed] [Google Scholar]
- 41.Stone EA, Ayroles JF. Modulated modularity clustering as an exploratory tool for functional genomic inference. PLoS Genet. 2009;5(5):e1000479. doi: 10.1371/journal.pgen.1000479. [DOI] [PMC free article] [PubMed] [Google Scholar]
- 42.Pool JE, et al. Population genomics of sub-saharan Drosophila melanogaster: African diversity and non-African admixture. PLoS Genet. 2012;8(12):e1003080. doi: 10.1371/journal.pgen.1003080. [DOI] [PMC free article] [PubMed] [Google Scholar]
- 43.Dover G. Molecular drive: A cohesive mode of species evolution. Nature. 1982;299(5879):111–117. doi: 10.1038/299111a0. [DOI] [PubMed] [Google Scholar]
- 44.Pollard DA, Iyer VN, Moses AM, Eisen MB. Widespread discordance of gene trees with species tree in Drosophila: Evidence for incomplete lineage sorting. PLoS Genet. 2006;2(10):e173. doi: 10.1371/journal.pgen.0020173. [DOI] [PMC free article] [PubMed] [Google Scholar]
- 45.Csink AK, Henikoff S. Something from nothing: The evolution and utility of satellite repeats. Trends Genet. 1998;14(5):200–204. doi: 10.1016/s0168-9525(98)01444-9. [DOI] [PubMed] [Google Scholar]
- 46.Biggin MD, Tjian R. Transcription factors that activate the Ultrabithorax promoter in developmentally staged extracts. Cell. 1988;53(5):699–711. doi: 10.1016/0092-8674(88)90088-8. [DOI] [PubMed] [Google Scholar]
- 47.Kerrigan LA, Croston GE, Lira LM, Kadonaga JT. Sequence-specific transcriptional antirepression of the Drosophila Krüppel gene by the GAGA factor. J Biol Chem. 1991;266(1):574–582. [PubMed] [Google Scholar]
- 48.Lu Q, Wallrath LL, Granok H, Elgin SC. (CT)n (GA)n repeats and heat shock elements have distinct roles in chromatin structure and transcriptional activation of the Drosophila hsp26 gene. Mol Cell Biol. 1993;13(5):2802–2814. doi: 10.1128/mcb.13.5.2802. [DOI] [PMC free article] [PubMed] [Google Scholar]
- 49.Raff JW, Kellum R, Alberts B. The Drosophila GAGA transcription factor is associated with specific regions of heterochromatin throughout the cell cycle. EMBO J. 1994;13(24):5977–5983. doi: 10.1002/j.1460-2075.1994.tb06943.x. [DOI] [PMC free article] [PubMed] [Google Scholar]
- 50.Platero JS, Csink AK, Quintanilla A, Henikoff S. Changes in chromosomal localization of heterochromatin-binding proteins during the cell cycle in Drosophila. J Cell Biol. 1998;140(6):1297–1306. doi: 10.1083/jcb.140.6.1297. [DOI] [PMC free article] [PubMed] [Google Scholar]
- 51.Pak DT, et al. Association of the origin recognition complex with heterochromatin and HP1 in higher eukaryotes. Cell. 1997;91(3):311–323. doi: 10.1016/s0092-8674(00)80415-8. [DOI] [PubMed] [Google Scholar]
- 52.Rodriguez Alfageme C, Rudkin GT, Cohen LH. Isolation, properties and cellular distribution of D1, a chromosomal protein of Drosophila. Chromosoma. 1980;78(1):1–31. doi: 10.1007/BF00291907. [DOI] [PubMed] [Google Scholar]
- 53.Török T, Harvie PD, Buratovich M, Bryant PJ. The product of proliferation disrupter is concentrated at centromeres and required for mitotic chromosome condensation and cell proliferation in Drosophila. Genes Dev. 1997;11(2):213–225. doi: 10.1101/gad.11.2.213. [DOI] [PubMed] [Google Scholar]
- 54.Ellis LL, et al. Intrapopulation genome size variation in D. melanogaster reflects life history variation and plasticity. PLoS Genet. 2014;10(7):e1004522. doi: 10.1371/journal.pgen.1004522. [DOI] [PMC free article] [PubMed] [Google Scholar]
- 55.Greenberg AJ, Hackett SR, Harshman LG, Clark AG. Environmental and genetic perturbations reveal different networks of metabolic regulation. Mol Syst Biol. 2011;7:563. doi: 10.1038/msb.2011.96. [DOI] [PMC free article] [PubMed] [Google Scholar]
- 56.Dernburg AF. In situ hybridization to somatic chromosomes in Drosophila. Cold Spring Harb Protoc. 2011;2011(9):pii: pdb.top065540. doi: 10.1101/pdb.top065540. [DOI] [PubMed] [Google Scholar]
Associated Data
This section collects any data citations, data availability statements, or supplementary materials included in this article.