

Abstract
Purpose
To evaluate the advantages and disadvantages of pre-approval requirements for safety data to detect cardiovascular (CV) risk contained in the December 2008 U.S. Food and Drug Administration (FDA) guidance for developing type 2 diabetes drugs compared with the February 2008 FDA draft guidance from the perspective of diabetes population health.
Methods
We applied the incremental net health benefit (INHB) framework to quantify the benefits and risks of investigational diabetes drugs using a common survival metric (life-years [LYs]). We constructed a decision analytic model for clinical program development consistent with the requirements of each guidance and simulated diabetes drugs, some of which had elevated CV risk. Assuming constant research budgets, we estimate the impact of increased trial size on drugs investigated. We aggregate treatment benefit and CV risks for each approved drug over a 35-year horizon under each guidance.
Results
The quantitative analysis suggests that the December 2008 guidance adversely impacts diabetes population health. INHB was −1.80 million LYs, attributable to delayed access to diabetes therapies (−0.18 million LYs) and fewer drugs (−1.64 million LYs), but partially offset by reduced CV risk exposure (0.02 million LYs). Results were robust in sensitivity analyses.
Conclusion
The health outcomes impact of all potential benefits and risks should be evaluated in a common survival measure, including health gain from avoided adverse events, lost health benefits from delayed or forgone efficacious products, and impact of alternative policy approaches. Quantitative analysis of the December 2008 FDA guidance for diabetes therapies indicates that negative impact on patient health will result. © 2014 The Authors. Pharmacoepidemiology and Drug Safety published by John Wiley & Sons, Ltd.
Keywords: INHB, benefit, risk, CV, evaluation, pharmacoepidemiology
INTRODUCTION
Over the last decade, drug safety has become an increasingly important regulatory issue. Drug withdrawals have raised concerns about the adequacy of benefit–risk assessment,1 and numerous reports have considered or advocated changes in risk management (WHO/UNESCO joint report,2 PDUFA III,3 IOM report,4 and U.S. Food and Drug Administration (FDA) guidance documents5–8). Although the need to consider benefits as well as risks has been a major theme in FDA guidance, concerns about excess acute myocardial infarctions and sudden deaths associated with rofecoxib9 and potentially elevated cardiovascular (CV) risk for patients treated with rosiglitazone10 have increased focus on risk11 and contributed to re-evaluation of CV risk associated with the sulfonylurea class, which has been available for over 50 years.12
Partially in response to these concerns, the FDA published draft guidance for developing type 2 diabetes drugs in February 2008.13 In this draft, the FDA increased pre-approval safety data requirements but did not suggest a specific CV clinical endpoint in the absence of an adverse signal (Table 1). In December 2008, the FDA published final guidance14 that recommended endpoints pre-approval and post-approval to rule out specific levels of CV risk without explicit consideration of drug benefits. Implementation of the February 2008 draft guidance would have increased clinical trial size compared with the status quo. The endpoints recommended in the final December 2008 guidance, however, require substantially larger and longer clinical studies, with recent launches having CV endpoint studies to address this requirement totaling approximately 25 000–50 000 patient life-years (LYs) and at least one compound (dutogliptin) apparently stopping development in part due to the increased expense to meet this requirement.15,16 Few studies, however, have evaluated the cost-effectiveness of pharmaceutical regulation; one recent example compared a regulation to no regulation scenario for QT/QTc studies for drugs under development.15–17
Table 1.
Summary of FDA February 2008 draft guidance and December 2008 guidance
| February 2008 draft guidance | December 2008 guidance | |
|---|---|---|
| Purpose | Guidance for developing drugs and therapeutic biologics for treating and preventing diabetes | Guidance for evaluating CV risk when developing drugs and therapeutic biologics for treating and preventing type 2 diabetes |
| Phase III clinical trial considerations | Pivotal efficacy trials for investigational diabetes therapies | Expanded existing pivotal efficacy trials or separate CV outcomes trial |
| Efficacy endpoint | Reduction in HbA1c to support a glycemic control label | Reduction in HbA1c to support a glycemic control label |
| CV event risk endpoint | CV risk not a primary endpoint | Number of composite CV events (fatal and non-fatal MI, non-fatal stroke) |
| Study population considerations | Representative samples of higher-risk diabetes populations (certain ethnic and elderly groups) | Enriched samples of populations at higher CV risk (advanced disease, elderly, or with renal impairment) |
| Study duration | Duration largely ≤12 months, but ≥18 months for some patients | Extended trial duration with ≥24 months for some patients |
| Trial size | At least 2500 patients exposed, 1300–1500 for more than 12 months, and 300–500 for at least 18 months | Size powered for primary efficacy and CV risk endpoints. Powered to detect a CV RRR of 1.3 with 80% probability |
| Approval evaluation | Supported by overall benefit–risk analysis | Supported by overall benefit–risk analysis with the upper bound of the estimated CV RRR < 1.80 |
| Post-marketing clinical trial considerations | CV trial may be required | Required CV outcomes trial if approved when the upper bound of the estimated CV RRR ≥ 1.30 |
FDA = U.S. Food and Drug Administration; MI = myocardial infarction; CV = cardiovascular; RRR = relative risk ratio.
The new requirements bring advantages through early detection of risk but also impose costs through larger and longer clinical trials that can slow access for patients and reduce the incentives to develop new drugs. The reduction in speed of access to drugs with favorable risk–benefit profiles provides a first-order cost to patients, whereas reduced investment in diabetes treatments would lead to an additional second-order cost to patients. Against these costs must be weighed the benefits from reduced exposure to drugs with less favorable risk–benefit profiles that might be detected earlier.
Joint evaluation of these factors requires a complex model of the ecosystem and many assumptions about critical variables. Published quantitative analyses of celecoxib and rofecoxib (COX-2 inhibitors) used such models to compare benefits and risks of these treatments with other NSAIDs among rheumatoid arthritis (RA) populations.18,19 Using discrete-event simulation modeling of CV and gastrointestinal risks, these studies found that COX-2 inhibitors increased RA population health (as measured by quality-adjusted LYs) over a 1-year horizon. When evaluating the consequences of additional safety testing on adverse events based on the rofecoxib withdrawal, expanded pre-approval studies could have reduced adverse events, but an evaluation of both benefits and risks was beyond the study scope.20 Expanding pre-approval studies can always increase the likelihood of detecting putative adverse effects of a drug, but a more comprehensive assessment of the benefits and risks specific to a particular situation is needed to determine what trial size provides the appropriate balance.21 In addition, whether it is more efficient to conduct these studies pre-approval or post-approval needs to be considered, recognizing that the trade-off may vary across drugs.22
In this paper, we discuss the merits of decision modeling as a tool to explore and clarify the broader potential impacts of a decision, using the FDA guidance on testing for CV risk of diabetes therapies as a case study. Previous research examining the impact of this guidance found large increases in review time (2×), trial size (2.5×), and trial patient-years (4×) after the December 2008 guidance.23 In other research, it has been suggested that including additional types of CV risk in the safety endpoint might mitigate this impact by allowing more efficient detection of CV-related risk.24 Our evaluation is unique in that it provides a more complete quantitative analysis of the long-term impacts of this policy decision on diabetes population health. Although the assumptions and approaches used herein are subject to debate, the need to model the impacts of major regulatory changes is clear. Decision modeling can provide insight into whether a change in policy is likely to achieve its key objectives without offsetting consequences.
METHODS
We used a decision analysis model to estimate health benefits and risks associated with development under the two policy frameworks—the December 2008 guidance and the February 2008 draft guidance—to calculate incremental net health benefit (INHB), measured in LYs, for the diabetes population over a 35-year horizon (20 years during which the drug is commonly used, 3 years of use by a particular patient, and 12 years of subsequent impact on that patient [with declining benefit over time]). Specifically, we applied a validated and structured, quantitative health outcomes approach25 to estimate INHB by simulating investigational drugs with constant treatment benefit but variable CV risk. The key drivers are the time to detection of CV risks and the foregone benefits associated with treatments that might be delayed, not reach market, or not be investigated.
Decision analysis model structure
The decision analysis model was based on decision trees that represent the least costly of several approaches to meet the recommendations of each guidance (see Figure 1). We developed a simulation model in Microsoft Excel based on the decision trees, following a set of diabetes drugs through development and approval and calculating their net impact on the diabetes population. Individual drugs were assumed to have a constant effect on survival associated with HbA1c control but could have either no CV risk or elevated CV risk drawn from a specified distribution; drugs with elevated CV risk had higher Phase III attrition, particularly under the December 2008 guidance, and were withdrawn from the market when the risk was identified. The constant base-case survival impact of improved HbA1c control derives from a published estimate for 0.5% improvement,26 and this assumption is consistent with decreasing HbA1c improvement averaging 0.5% over 3 years use by a patient. The HbA1c effect on survival (LYs) is varied in sensitivity analyses.
Figure 1.
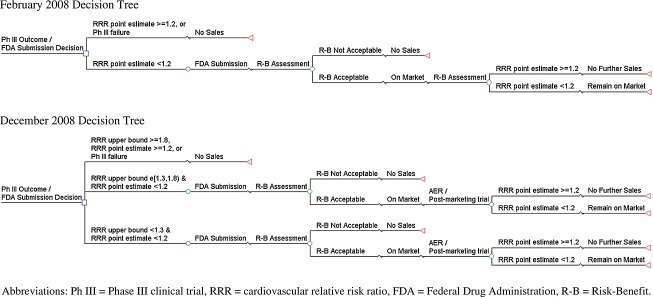
Drug development, regulatory submission, and marketing approval pathways under the February 2008 draft guidance and the December 2008 guidance
In the base case, overall research and development budgets for diabetes drugs were held constant, leading to a reduction in the number of investigated drugs. This assumption is based on pharmaceutical research budgets having been a relatively constant proportion of sales over the past 20 years and relatively flat in absolute terms in the last 2 years,27 leading to trade-offs in research portfolios. This assumption may be conservative, as companies would be expected to shift investment away from diabetes if the cost/benefit ratio for that area becomes more negative relative to other potential investments.
The supporting information provides details of the decision analysis model and policy frameworks.
Model inputs
Where possible, we used historical or published data on type 2 diabetes drugs, drug development, and costs (Table 2 and supporting information). The probability a drug had any elevated CV risk (CV death, myocardial infarction, and stroke), 4.4%, was based on the combined percentage of investigational compounds entering Phase III that failed (1987–1992), the percentage of terminations at least 4 years from initial filing of the new drug due to safety problems (1981–1992), and the percentage of marketed drugs that were withdrawn or restricted due to safety signals (1969–2002, 1993–2006).1,28,29 In the absence of information on the magnitude of CV relative risk ratio (RRR) in investigational diabetes drugs that have elevated risk, we used a beta distribution (α = 0.80; β = 2.46) parameterized to advantage the safety benefit provided by the December 2008 guidance by setting the mean RRR equal to the lower risk threshold (1.3) specified in that guidance and the 97.5th percentile equal to the upper risk threshold (1.8) specified in that guidance; drugs with moderate risk—as opposed to those likely to be detected under either scenario—would accordingly be well represented in our modeling exercise.
Table 2.
Model inputs
| Definition | Base-case value | Reference |
|---|---|---|
| Benefit of treatment with investigational type 2 diabetes drug | ||
| Reduction in HbA1c, percentage point | 0.5 | Assumption |
| 10-year discounted benefit of 0.5 percentage points reduction in HbA1c control, LY | 0.05 | 26 |
| Treatment durability, years | 3 | 35 |
| CV risk, type 2 diabetes patients | ||
| Non-fatal CV event rate, annual mean | 0.0060 | Estimate36 |
| Fatal CV event rate, annual mean | 0.0096 | Estimate36 |
| Relative risk ratio (RRR) for high-risk patients | 1.90 | Estimate37 |
| CV risk, investigational type 2 diabetes drugs | ||
| Drugs with elevated CV event risk, % | 4.4 | Estimate1,28,29; |
| Distribution of CV RRR for drugs with elevated CV risk | Beta | Assumption |
| RRR of drugs with elevated CV event risk, mean | 1.30 | Assumption |
| RRR of drugs with elevated CV event risk, 95%CI | 1.059–1.800 | Estimate14 |
| Clinical program for investigational type 2 diabetes drugs | ||
| February 2008 draft guidance Phase III trial enrollment, treatment (control) | 2500 (2500) | 13 |
| December 2008 guidance Phase III trial enrollment, treatment (control) | 9209 (4959) | Estimate13,14 |
| December 2008 guidance; delay to market due to extended duration of Phase III trial, years | 0.5 | Assumption |
| Capitalized preclinical, Phase I, and Phase II cost, 2010 $millions | 515 | Estimate31 |
| February 2008 draft guidance Phase III cost, 2010 $millions | 189 | Estimate31 |
| December 2008 guidance Phase III cost, 2010 $millions | 576 | Estimate28 |
| Transition probabilities | ||
| February 2008 Phase III failure rate, % | 24.2 | Estimate31,32 |
| February 2008 FDA approval rate, % | 90.3 | 32 |
| Type 2 diabetes, treated population | ||
| Annual treated population | 1 333 433 | Estimate10,38,39 |
| Annual treatment uptake, % | 33.3 | Assumption |
| Number of annual treated cohorts (drug useful life) | 20 | Assumption |
| Participation in PM surveillance, % of treated population | 0.065 | Estimate29 |
| Drug research for type 2 diabetes drugs | ||
| Research period impacted by change in FDA guidance, years | 12 | Assumption |
| Diabetes drugs initiating Phase III clinical trial, annual no. | 2.20 | 39 |
CV = cardiovascular; LY = life-year; RRR = relative risk ratio; CI = confidence interval; PM = post-marketing; FDA = U.S. Food and Drug Administration.
We based our inputs for the design, duration, and cost of the clinical trial programs on requirements in the guidance frameworks and estimates of new drug development costs (in 2010 dollars).13,14,29–32 We used 0.5 years as a conservative estimate of the additional time required to run the larger Phase III trials. The probability of detecting elevated CV risk was calculated based on the estimated power of the clinical trial programs to detect elevated incidence of CV events for the simulated CV RRR.
The base case assumes that each simulated drug reduces a long-term blood glucose measure (HbA1c) compared with standard of care for appropriately targeted patients by 0.5 percentage points (an assumed value so that effectiveness exceeds non-inferiority of 0.3 to 0.413), is effective at controlling glucose levels for 3 years per patient, and has no residual effects beyond 10 years. Risk and benefit are assumed proportional to exposure time, so duration of maintained control is unlikely to affect risk–benefit comparison. We assume these parameter values to illustrate the impact of the policy change on effective agents. Although not all agents would confer the assumed level and duration of control, we explore variation in effectiveness assumptions through sensitivity analysis.
Sensitivity analysis
We conducted sensitivity analyses to assess the impact of parameter uncertainty. For CV risk assumptions, we varied the mean risk, risk variance, and risk distribution to consider risk scenarios favorable to increased pre-approval scrutiny. We adjusted treatment efficacy and survival assumptions, we considered alternative assumptions for delay to market, and we relaxed the fixed pharmaceutical budget assumption. Parameter values were varied by plus and minus 25% in the sensitivity analyses, except for share of drugs (+50%) and delay to market (−0.25 years/+1.0 years) to reflect greater uncertainty in future drug development. To control for sampling variation, all sensitivity analyses used the same 10 000 random elevated CV risks drawn from the CV relative risk distribution.
RESULTS
Base-case analyses
The December 2008 guidance results in greater detection of diabetes drugs with elevated CV risk in Phase III: 67% to 48% for drugs with any elevation, and 98% versus 67% for drugs with a CV RRR ≥ 1.30. The increased CV risk detection reduces risk of a CV event by 28% for individual treated patients under the December 2008 guidance (see Table 3). In addition, the December 2008 guidance also leads to a reduction in the number of drugs investigated (see Methods), which further reduces the number of CV events.
Base-case analysis average results,* by policy framework
| February 2008 draft guidance | December 2008 guidance† | Difference (%) | 95% confidence interval for difference‡ | |
|---|---|---|---|---|
| Number of drugs, no.§ | ||||
| Investigated | 21.90 | 14.13 | −7.77 (−35.5) | |
| Approved | 14.83 | 9.44 | −5.39 (−36.3) | |
| Incremental CV events, no.¶ | ||||
| Per treated patient | 0.00015 | 0.00010 | −0.00004 (−28.3) | [−0.000052, −0.000030] |
| Per investigated drug | 582 | 402 | −180 (−30.9) | [−223, −136] |
| Total | 12 746 | 5682 | −7064 (−55.4) | [−5788, −8340] |
| Incremental net health benefit (INHB), LY** | ||||
| Per treated patient | 0.0545 | 0.0547 | 0.00020 (0.4) | [0.0017, 0.00023] |
| Per investigated drug | 218 651 | 211 346 | −7304 (−3.3) | [−7464, −7144] |
| Total | 4 788 189 | 2 985 946 | −1 802 243 (−37.6) | [−1 813 311, −1 790 942] |
FDA = U.S. Food and Drug Administration; CV = cardiovascular; LY = life-year.
Results are simulation averages (10 000 simulations) weighted by the share of investigational drugs without elevated CV risk. All results discounted at 3.0% annual rate.
Results for the December 2008 guidance are for the “expanded existing trial” because that approach is associated with lower clinical and economic impact than a “separate safety trial.”
Confidence intervals calculated using nonparametric bootstrapping from the 10 000 simulated drugs using sample sizes of 22 drugs (the estimated number of diabetes drugs investigated under the February 2008 guidance). Specifically, each measure was calculated for 22 drugs randomly selected with replacement from the 10 000 simulated drugs. This was repeated 200 times and the values ordered. The confidence intervals are the 5th and 195th largest, respectively.
The number of drugs is over a 12-year period, starting in 2010 for Phase III investigated drugs and in 2014 for approved drugs.
Additional CV events associated with the incremental CV risk of investigated drugs compared with standard of care. Results are weighted average based on expected number of treated patients.
Treatment benefit incorporates mortality impact of elevated CV event risk of investigational drugs. Results are weighted averages based on expected number of treated patients.
Total INHB equals the difference in INHB per investigated drug times the number of investigated drugs plus the total LYs per investigated drug times the difference in number of drugs investigated.
The increased safety requirements have a modest survival impact. Model estimates indicate a 0.4% increase in LYs for individual treated patients due to the increased safety requirements. This perspective ignores survival benefits from reductions in time on market and number of drugs approved. The impact is small primarily because relatively few diabetes agents have elevated CV risks, and even under the February 2008 draft guidance, those with elevated CV risks are withdrawn from the market.
The INHB of the December 2008 guidance is negative when the delayed time to market and number of drugs investigated are considered (see Table 3). Thus, the foregone survival (LY) benefits (the policy costs) from delayed approval and reduced clinical research for investigational diabetes agents exceed the survival benefits associated with reductions in CV risk. The average net benefit per investigated drug decreases 3.3%, factoring in the improved safety requirements and the delayed approval. Thus, the foregone survival benefit of HbA1c control from only a 0.5 year delay in launch per investigated drug outweighs the realized survival benefit of reduced CV risk associated with the safety requirements. For the entire diabetes population, factoring in reductions in the capacity to investigate new drugs, the model estimates a 37.6% reduction in net benefits. From the diabetes patient population perspective, the December 2008 guidance reduces patient health when estimated using survival.
Table 4 presents a disaggregation of population-level INHB. The negative estimated INHB for the type 2 diabetes population (−1.80 million LYs) is attributable to delayed access to efficacious diabetes therapy (−0.18 million LYs) and a reduction in the number of drugs approved (−1.64 million LYs), partially offset by reduced exposure to drugs with elevated CV risk (0.02 million LYs).
Incremental net health benefit (LYs), by source*
| INHB by source, LYs (%)† | |||
|---|---|---|---|
| Type 2 diabetes treatment benefit | Reduction in CV events | Total INHB‡ | |
| Total impact of policy change | −1 836 413 | 34 170 | −1 802 243 |
| Increased safety requirements | 0 (0.0) | 17 444 (51.0) | 17 444 (−0.9) |
| Increased time to market | −179 032 (9.7) | 1631 (4.8) | −177 401 (9.7) |
| Fewer investigated drugs | −1 657 381 (90.3) | 15 096 (44.2) | −1 642 285 (89.4) |
CV = cardiovascular; INHB = incremental net health benefit; LYs = life-years.
Results based on 10 000 model simulations.
Percent calculated as share of column total, by source and total INHB.
Total INHB equals the sum of type 2 diabetes treatment benefit (LYs) and reduction in CV events (LYs).
Sensitivity analysis
One-way analysis
Results were robust to all one-way sensitivity analyses (see Table 5 for INHB and number of CV events per investigated drug and total). All sensitivity analyses resulted in (i) reductions in INHB per investigated drug and in total, and (ii) reductions in CV events per investigated drug and in total. The lowest predicted reduction in LYs per investigated drug was −3716 (for a quarter year delay to market); the lowest predicted reduction in LYs resulted in the extended useful life of investigation drugs (−1.13 million LYs), and no one-way sensitivity analyses came close to predicting an increase in INHB in the policy comparison.
Sensitivity analyses, absolute differences between December 2008 guidance and February 2008 standard*
| Parameter | Sensitivity range | Incremental net health benefit (LYs) | CV events | ||
|---|---|---|---|---|---|
| Per investigated drug | Total | Per investigated drug | Total | ||
| Base case | −7304 | −1 802 243 | −180 | −7064 | |
| Treatment benefit (base case = 0.05 LYs from 0.5% HbA1c improvement) | |||||
| Low case | −25% (0.038 LYs) | −5256 | −1 343 449 | −180 | −6988 |
| High case | +25% (0.063 LYs) | −9347 | −2 261 075 | −184 | −7186 |
| Drugs with elevated CV risk (base case = 4.42%) | |||||
| Low case | −25% (3.32%) | −7386 | −1 822 626 | −184 | −7186 |
| High case | +50% (6.63%) | −7132 | −1 760 649 | −220 | −7856 |
| Post-marketing registry share (base case = 0.065%) | |||||
| Low case | −25% (0.049%) | −7275 | −1 801 392 | −203 | −7649 |
| High case | +25% (0.081%) | −7318 | −1 802 338 | −172 | −6885 |
| Useful life on market (base case = 20 years per approved drug) | |||||
| Low case | 15 years | −7301 | −2 383 454 | −184 | −9504 |
| High case | 25 years | −7301 | −1 127 864 | −184 | −4498 |
| Annual rate of drugs entering Phase III (base case = 2.20 drugs/year) | |||||
| Low case | 1.80 drugs/year | −7301 | −1 474 337 | −184 | −5879 |
| High case | 2.60 drugs/year | −7301 | −2 129 598 | −184 | −8492 |
| Delay to market—December 2008 standard (base case = 0.50 years) | |||||
| Low case | 0.25 years | −3716 | −1 751 310 | −178 | −7094 |
| High case | 1.50 years | −21 353 | −2 000 491 | −209 | −7544 |
| Phase III per patient cost ($)—February 2008 standard (base case = 37 840) | |||||
| Low case | 28 380 | −7301 | −1 578 848 | −184 | −6757 |
| High case | 47 300 | −7301 | −1 973 032 | −184 | −7514 |
| Average CV RRR of drugs with elevated risk (base case = 1.30) | |||||
| Low case | 1.13 CV RRR | −7508 | −1 839 541 | −97 | −2696 |
| High case | 1.43 CV RRR | −7051 | −1 781 604 | −233 | −6300 |
| Size of treated population (base case = 1.33 million/year) | |||||
| Low case | 1.00 million/year | −5456 | −1 350 944 | −152 | −5736 |
| High case | 1.67 million/year | −9144 | −2 251 853 | −215 | −8602 |
CV = cardiovascular; LYs = life-years; RRR = relative risk ratio.
Results based on 10 000 model simulations per sensitivity analysis.
Reducing the clinical benefit of HbA1c improvement by 25% (to 0.038 LYs over 10 years) reduced the impact of the December guidance to −1.34 million LYs. Accordingly, the benefit of HbA1c improvement would need to be considerably lower than 0.038 LYs over 10 years for the CV event risk reduction to outweigh the foregone survival benefits of control.
Model results were also robust to alternative CV risk assumptions. Increasing the share of investigational drugs with elevated CV risk by 50% (to 6.63%) decreased total INHB only slightly to −1.76 million LYs, and decreasing number of CV events by 7186 instead of 7064. If the average elevated risk was 1.43 (vs. 1.30), total INHB decreased to −1.78 million. The number of CV events avoided actually decreases in this scenario to 6300 given earlier detection in the February 2008 standard for drugs of this risk profile.
Table 5 presents additional absolute changes in INHB and number of CV events for one-way sensitivity analyses exploring parameter uncertainty. In all cases, the December 2008 guidance reduced INHB of diabetes patients even though it reduced CV events.
Scenario analysis
Expanded use of post-marketing surveillance could provide reductions in CV events without accompanying reductions in health benefit. Tripling participation in required surveillance programs under the February 2008 draft guidance achieved up to a 41.6% reduction in CV events provided by the safety requirements in the December 2008 guidance (see Table 6) without adverse health impacts from delay to market or reduced incentives to innovate.
Impact of increasing post-marketing surveillance requirements under the February 2008 draft guidance*
| Incremental CV events avoided | ||
|---|---|---|
| No. | Relative to 3602 CV events avoided due to increased likelihood of detectionb (%) | |
| Double participation in post-marketing surveillance | 1042 | 28.8 |
| Triple participation in post-marketing surveillance | 1508 | 41.6 |
CV = cardiovascular.
Results based on 10 000 simulations for each post-marketing surveillance participation rate.
The increased safety requirements associated with the December 2008 guidance reduced CV events by 3602, 51% of the total reduction in CV events (7064).
Model results are robust to relaxing the fixed research budget assumption. If, as an extreme scenario, one assumed budgets increased to avoid any impact on the number of drugs developed for diabetes, the December 2008 guidance results in a decrease in INHB of 160 000 LYs (the combined impact of improved safety and negative impact of delayed access; see Table 4).
DISCUSSION
Given safety concerns associated with rosiglitazone,10 the FDA increased the evidentiary requirements for approving new diabetes therapies in 2008. Longer and larger trials with more high-risk patients are required. These stricter requirements should lead to earlier detection of drugs with elevated CV risk, reducing the likelihood of marketing approval and widespread adoption. These requirements also raise development cost for new diabetes therapies, lowering the return to manufacturers and likely leading to fewer new molecular entities reaching the market. The question is whether the evidence standard provides an appropriate balance of benefits and costs for diabetes patients.
We evaluated these trade-offs by constructing a decision analysis model for representative new diabetes therapies using health benefits and risks measured in terms of expected LYs and compared the December 2008 guidance for developing type 2 diabetes agents with the February 2008 draft guidance (a guidance that itself required additional evidence compared with the status quo). Using the illustrative case of investigational agents with minimum clinically meaningful effectiveness, some of which had elevated CV risk, we found that (i) the December 2008 guidance effectively reduced CV events but with modest survival benefit because few drugs that have elevated CV risk reach Phase III; (ii) foregone treatment benefits from delayed approval exceed survival benefits from improved safety (INHB is negative); and (iii) INHB is substantially worsened when considering budget and/or incentive implications of the additional clinical development costs.
Our findings suggest that focusing solely on reducing CV risk may not benefit diabetes patients overall. This study shows that losses from discouraging or delaying effective drugs without elevated CV risk may outweigh gains from the increased likelihood of early identification of drugs with elevated CV risk, an issue that was raised in a recent FDA Advisory Committee meeting.33
Other options, including increased use of post-approval controlled trials or observational data collection, or other means to balance risk and benefit might prove preferable. The recent FDA Advisory Committee vote to recommend approval of the long-lasting insulin degludec, but require a CV outcomes trial post-approval, is consistent with this alternative approach.34 The analyses presented here highlight the need for more rigor in assessing both pre-approval benefit–risk trade-offs and post-marketing data.
Our model is limited by data availability, requiring assumptions for model inputs from multiple sources. We assume constant treatment effectiveness equal to the minimum clinically meaningful result and explore the importance of this parameter in sensitivity analyses. Future clinical assumptions are inherent in the model: we assume no improvement in pre-diabetes medication, no improvement in treatments for CV events, and no impact of changing population characteristics. Similarly, we apply averages from historical clinical studies to the potentially changing population without explicit modeling of patient heterogeneity. Although we perform extensive sensitivity analyses for these parameters, model results remain dependent on these assumptions.
The findings from our analyses complement those of previous studies,20,22 which report “substantial negative economic effects” from increased pre-approval requirements, particularly those increasing the length of pre-approval clinical trials.22 Sizable increases in post-approval safety evaluation were much less detrimental.20 These studies noted, however, that pre-approval and post-approval data collections were not perfect substitutes and that there was a key benefit–risk determination to be made, particularly in the case of potentially fatal events. In analysis of the effects of requiring larger pre-approval safety databases, the studies note that an increase from 2000 to 4000 patients was cost-effective in a rofecoxib-like example but an increase to 8000 was not. These studies did not, however, consider relative risks as low as those covered by the December 2008 guidance, assumed little effective post-marketing surveillance, and did not consider the impact of increased testing on either the number or timing of drug approvals, in contrast to the analyses presented here.
Model findings may not represent the full impact of policy changes on the health of patients in the USA because of effects on other parties. Our model assumed fixed total research budgets for diabetes therapies, but pharmaceutical and biotechnology companies may substitute away from investments in diabetes to other areas because of the altered return on investment, potentially leading to more therapies reaching market for other diseases. Alternatively, they might continue to invest in diabetes but focus their efforts on drugs that are likely to have greater CV benefit (e.g., ancillary benefit for hypertension), making it easier to achieve the risk thresholds and providing additional valued properties.
This paper introduces a structured, quantitative health outcomes model to assess the benefit–risk trade-offs of a change in healthcare policy. Although views may differ regarding the assumptions used for the example studied herein, sensitivity analyses and conservative assumptions indicate a degree of robustness for our findings. We believe that it is critical to model all key potential benefits and risks of a policy decision, including direct benefits or losses from the change and indirect effects that may occur because of the change. Only in this context can a potential choice be compared with alternatives in order to understand the likely outcomes of a major policy change.
CONFLICT OF INTEREST
This work was supported by Eli Lilly and Company, and several of the authors (DEB, DSM, and AK) are current or former employees and shareowners of this company. Lilly develops and markets drugs in the field of diabetes. Although no specific Lilly products are named in this article, Lilly is impacted by any changes in the endocrine regulatory environment.
AK is an employee of Bristol Myers Squibb and was an employee of Eli Lilly when this study was conducted.
This paper does NOT apply to a specific product, but the sponsor does have some products in the class of drugs being analyzed.
KEY POINTS.
Quantitative analysis of impacts of major regulatory changes should incorporate all proximate benefits and costs to evaluate impact on population health, measured in the common survival measure of life-years.
We applied the INHB approach to evaluate the impact of FDA guidance requiring increased pre-approval safety data on CV risks of investigational diabetes drugs.
Model estimates indicate that although the final FDA guidance from December 2008 reduced CV risks among the diabetes population, the INHB was negative.
Foregone treatment benefits from improved HbA1c control from delayed drug availability or reduced drug research significantly exceeded the survival benefits from the increased safety requirements.
Quantitative analysis of treatment benefits can be incorporated into decision making.
ETHICS STATEMENT
This study involved computer simulations using publicly available data; consequently, it did not constitute human subjects research requiring review by an Institutional Review Board.
Acknowledgments
The authors would like to thank Mark Boye, Byron Hoogwerf, and Sharon Myers for helpful comments on this paper, and Messan Amewou-Atisso for comments and help on power calculations.
Supporting Information
Additional supporting information may be found in the online version of this article at the publisher's web site.
REFERENCES
- 1.Wysowski DK, Swartz L. Adverse drug event surveillance and drug withdrawals in the United States, 1969–2002. Arch Intern Med. 2005;165:1363–1369. doi: 10.1001/archinte.165.12.1363. [DOI] [PubMed] [Google Scholar]
- 2.CIOMS Working Group IV. Benefit–Risk Balance for Marketed Drugs: Evaluating Safety Signals. Geneva: Council for International Organizations of Medical Sciences (CIOMS); 1998. [Google Scholar]
- 3.Pub L No 107-188, 166 Stat 594. Public Health Security and Bioterrorism Preparedness and Response Act of 2002. 2002.
- 4.Committee on the Assessment of the US Drug Safety System. The Future of Drug Safety: Promoting and Protecting the Health of the Public. In: Baciu A, Stratton K, Burke SP, editors. Washington, DC: National Academies Press; 2006. [Google Scholar]
- 5.Center for Drug Evaluation and Research (FDA) Guidance for Industry—Development and Use of Risk Minimization Action Plans [Internet] DHHS. 2005. Available at: http://www.fda.gov/downloads/Drugs/GuidanceComplianceRegulatoryInformation/Guidances/ucm071616.pdf [01 December 2009]
- 6.Center for Drug Evaluation and Research (FDA) Guidance for Industry—Good Pharmacovigilance Practices and Pharmacoepidemiologic Assessment [Internet]. DHHS. 2005. Available at: http://www.fda.gov/downloads/Drugs/GuidanceComplianceRegulatoryInformation/Guidances/ucm071696.pdf [01 December 2009]
- 7.Center for Drug Evaluation and Research (FDA) Guidance for Industry—Premarketing Risk Assessment [Internet] DHHS. 2005. Available at: http://www.fda.gov/downloads/RegulatoryInformation/Guidances/ucm126958.pdf [01 December 2009]
- 8.Frey P. Benefit–Risk Considerations in CDER: Development of a Qualitative Framework [Internet]. Center for Drug Evaluation and Research (FDA) DIA Meeting. 2012. Available at: http://www.fda.gov/downloads/AboutFDA/CentersOffices/OfficeofMedicalProductsandTobacco/CDER/UCM317788.pdf [11 September 2012]
- 9.Memorandum from David J Graham. Risk of acute myocardial infarction and sudden cardiac death in patients treated with COX-2 selective and non-selective NSAIDS [Internet]. 2004. Available at: http://www.fda.gov/downloads/Drugs/DrugSafety/PostmarketDrugSafetyInformationforPatientsandProviders/ucm106880.pdf [01 December 2009]
- 10.Nissen SE, Wolski K. Effect of rosiglitazone on the risk of myocardial infarction and death from cardiovascular causes. N Engl J Med. 2007;356:2457–2471. doi: 10.1056/NEJMoa072761. [DOI] [PubMed] [Google Scholar]
- 11.Nissen SE. Cardiovascular effects of diabetes drugs: emerging from the dark ages. Ann Intern Med. 2012;157(9):671–672. doi: 10.7326/0003-4819-157-9-201211060-00016. [DOI] [PubMed] [Google Scholar]
- 12.Roumie C, Hung A, Greevy R, et al. Comparative effectiveness of sulfonylurea and metformin monotherapy on cardiovascular events in type 2 diabetes mellitus. Ann Intern Med. 2012;157(9):601–610. doi: 10.7326/0003-4819-157-9-201211060-00003. [DOI] [PMC free article] [PubMed] [Google Scholar]
- 13.Center for Drug Evaluation and Research (FDA) Guidance for Industry—Diabetes Mellitus: Developing Drugs and Therapeutic Biologics for Treatment and Prevention—DRAFT GUIDANCE [Internet]. DHHS. 2008. Available at: http://www.fda.gov/downloads/Drugs/GuidanceComplianceRegulatoryInformation/Guidances/ucm071624.pdf [01 December 2009]
- 14.Center for Drug Evaluation and Research (FDA) Guidance for Industry—Diabetes Mellitus—Evaluating Cardiovascular Risk in New Antidiabetic Therapies to Treat Type 2 Diabetes [Internet]. DHHS. 2008. Available at: http://www.fda.gov/downloads/Drugs/GuidanceComplianceRegulatoryInformation/Guidances/ucm071627.pdf [01 December 2009]
- 15.Bethel MA, Sourij H. Impact of FDA guidance for developing diabetes drugs on trial design: from policy to practice. Curr Cardiol Rep. 2012;14(1):59–69. doi: 10.1007/s11886-011-0229-7. [DOI] [PubMed] [Google Scholar]
- 16.Gorkin L. Impact of the FDA's guidance requiring a cardiovascular safety screening study to gain regulatory approval of a drug to treat type 2 diabetes. Available at: http://www.stelerix.com/library/life-sciences/downloads/Avandia-Report.pdf [19 April 2011]
- 17.Bouvy JC. The cost-effectiveness of drug regulation: the example of thorough QT/QTc studies. Clin Pharmacol Ther. 2012;91(1):281–288. doi: 10.1038/clpt.2011.224. [DOI] [PubMed] [Google Scholar]
- 18.Varas-Lorenzo C, Maguire A, Castellsague J, Perez-Gutthann S. Quantitative assessment of the gastrointestinal and cardiovascular risk–benefit of celecoxib compared to individual NSAIDs at the population level. Pharmacoepidemiol Drug Saf. 2007;4:366–376. doi: 10.1002/pds.1299. [DOI] [PubMed] [Google Scholar]
- 19.Lynd LD, Marra CA, Najafzadeh M, Sadatsafavi M. A quantitative evaluation of the regulatory assessment of the benefits and risks of rofecoxib relative to naproxen: an application of the incremental net-benefit framework. Pharmacoepidemiol Drug Saf. 2010;11:1172–1180. doi: 10.1002/pds.1994. [DOI] [PubMed] [Google Scholar]
- 20.Reed SD, Anstrom KJ, Seils DM, Califf RM, Schulman KA. Use of larger versus smaller drug-safety databases before regulatory approval: the trade-offs. Health Aff. 2008;27(5):w360–w370. doi: 10.1377/hlthaff.27.5.w360. [DOI] [PubMed] [Google Scholar]
- 21.Garber AM. Is having more preapproval data the best way to assure drug safety? Health Aff. 2008;27(5):w371–w373. doi: 10.1377/hlthaff.27.5.w371. [DOI] [PubMed] [Google Scholar]
- 22.Reed SD, Califf RM, Schulman KA. How changes in drug-safety regulations affect the way drug and biotech companies invest in innovation. Health Aff. 2006;25(5):1309–1317. doi: 10.1377/hlthaff.25.5.1309. [DOI] [PubMed] [Google Scholar]
- 23.Viereck C, Boudes P. An analysis of the impact of FDA's guidelines for addressing cardiovascular risk of drugs for type 2 diabetes on clinical development. Contemp Clin Trials. 2011;32:324–332. doi: 10.1016/j.cct.2011.01.009. [DOI] [PubMed] [Google Scholar]
- 24.Marcinak JF, Viswananth P, Arora V, et al. Shift from surrogate end point to outcome trials: implications for cardiovascular safety assessment in development programs for antidiabetic drugs. Clin Pharmacol Ther. 2011;91(3):514–520. doi: 10.1038/clpt.2011.257. [DOI] [PubMed] [Google Scholar]
- 25.Garrison LP, Towse A, Bresnahan B. Quantitative health outcomes approach to drug risk–benefit analysis. Health Aff. 2007;26(3):684–695. doi: 10.1377/hlthaff.26.3.684. [DOI] [PubMed] [Google Scholar]
- 26.Valentine WJ, Palmer AJ, Nicklasson L, Cobden D, Roze S. Improving life expectancy and decreasing the incidence of complications associated with type 2 diabetes: a modeling study of HbA1c targets. Int J Clin Pract. 2006;60(9):1138–1145. doi: 10.1111/j.1742-1241.2006.01102.x. [DOI] [PubMed] [Google Scholar]
- 27.Pharmaceutical Research and Manufacturers of America. Pharmaceutical Industry Profile. Washington, DC: PhRMA; 2010. [Google Scholar]
- 28.DiMasi JA. Risks in new drug development: approval success rates for investigational drugs. Clin Pharmacol Ther. 2001;69:297–307. doi: 10.1067/mcp.2001.115446. [DOI] [PubMed] [Google Scholar]
- 29.Issa AM, Phillips KA, Van Bebber S, et al. Drug withdrawals in the United States: a systematic review of the evidence and analysis of trends. Curr Drug Saf. 2007;2:177–185. doi: 10.2174/157488607781668855. [DOI] [PubMed] [Google Scholar]
- 30.Bureau of Labor Statistics. Consumer Price Index Tables [Internet]. 2011. Available at: http://www.bls.gov/cpi/tables.htm [01 December 2009]
- 31.DiMasi JA, Hansen RW, Grabowski HG. The price of innovation: new estimates of drug development costs. J Health Econ. 2003;22:151–185. doi: 10.1016/S0167-6296(02)00126-1. [DOI] [PubMed] [Google Scholar]
- 32.DiMasi JA. New drug development in the United States from 1963 to 1999. Clin Pharmacol Ther. 2001;59:286–296. doi: 10.1067/mcp.2001.115132. [DOI] [PubMed] [Google Scholar]
- 33.Sutter S. Insulin Degludec's CV Risks Can Be Studied Post-Approval, Committee Says. Bedminster, NJ: Elsevier Business Intelligence Health News Daily; 2012. [Google Scholar]
- 34.Fiore K. Long-Acting Insulins Win FDA Panel Support. 2012. MedPage Today, November 8,
- 35.Turner RC, Cull CA, Frighi V, et al. Glycemic control with diet, sulfonylurea, metformin, or insulin in patients with type 2 diabetes mellitus: progressive requirement for multiple therapies (UKPDS 49) JAMA. 1999;281(21):2005–2012. doi: 10.1001/jama.281.21.2005. [DOI] [PubMed] [Google Scholar]
- 36.ADVANCE Collaborative Group. Patel A, MacMahon S, et al. Intensive blood glucose control and vascular outcomes in patients with type 2 diabetes. N Engl J Med. 2008;358:2560–2572. doi: 10.1056/NEJMoa0802987. [DOI] [PubMed] [Google Scholar]
- 37.Schramm TK, Gislason GH, Kober L, et al. Diabetes patients requiring glucose-lowering therapy and nondiabetics with a prior myocardial infarction carry the same cardiovascular risk. Circulation. 2008;117:1945–1954. doi: 10.1161/CIRCULATIONAHA.107.720847. [DOI] [PubMed] [Google Scholar]
- 38.Datamonitor PharmaVitae Company Model. Datamonitor, London, UK: Takeda Pharmaceutical Co Ltd; 2009. [Google Scholar]
- 39.Centers for Disease Control and Prevention. National Diabetes Fact Sheet: General Information and National Estimates on Diabetes in the United States, 2007. Atlanta, GA: US Department of Health and Human Services, Centers for Disease Control and Prevention; 2008. [Google Scholar]
Associated Data
This section collects any data citations, data availability statements, or supplementary materials included in this article.