

Abstract
Summary
Outcomes for melanoma patients with stage III disease differ widely even within the same subcategory. Molecular signatures that more accurately predict prognosis are needed to stratify patients according to risk. Proteomic analyses were used to identify differentially abundant proteins in extracts of surgically excised samples from patients with stage IIIc melanoma lymph node metastases. Analysis of samples from patients with poor (n = 14, <1 yr) and good (n = 19, >4 yr) survival outcomes identified 84 proteins that were differentially abundant between prognostic groups. Subsequent selected reaction monitoring analysis verified 21 proteins as potential biomarkers for survival. Poor prognosis patients are characterized by increased levels of proteins involved in protein metabolism, nucleic acid metabolism, angiogenesis, deregulation of cellular energetics and methylation processes, and decreased levels of proteins involved in apoptosis and immune response. These proteins are able to classify stage IIIc patients into prognostic subgroups (P < 0.02). This is the first report of potential prognostic markers from stage III melanoma using proteomic analyses. Validation of these protein markers in larger patient cohorts should define protein signatures that enable better stratification of stage III melanoma patients.
Keywords: melanoma, lymph node metastasis, prognosis, iTRAQ 2DLC-MS/MS, DIGE, protein markers, SRM
Significance
Stage III melanoma patients can have vastly different outcomes. Currently, for stage IIIc patients, the risk of progression and response to therapy cannot be predicted. Additional prognostic markers for accurate risk stratification are needed. We describe here the first proteome analysis of lymph node metastases from stage IIIc patients with poor and good survival. We have identified 84 proteins that change between the two survivor groups. Several identified markers were validated with high concordance using selected reaction monitoring mass spectrometry. The protein signatures obtained classify melanoma patients into the two prognostic groups and may aid prognostication of metastatic melanoma.
Introduction
The 5-yr survival for clinically localized melanoma (American Joint Committee on Cancer, AJCC stages I and II) ranges from 97 to 53%, while the prognosis for metastatic melanoma is poor with 5-yr survival rates ranging from 70 to 39% for patients with lymph node involvement (AJCC stage III) and 18 to 6% for patients with distant metastases (AJCC stage IV) (Balch et al., 2009). Patients with stage III disease can have vastly different outcomes, particularly those with bulky nodal metastases (AJCC stage IIIc). Some patients have long survival following current treatments, while others with an identical AJCC stage survive less than 6 months. Currently, prognosis based on histological and clinical factors is unsatisfactory for predicting risk of disease progression and response to adjuvant therapy. The difficulty in classification of melanoma into prognostic subgroups and selection of treatments is reflected in the failure to improve outcomes for advanced disease. Additional prognostic markers are needed to provide more accurate diagnosis and prognosis.
Histological and clinical factors used for diagnosis of melanoma are of limited use. Biomarkers could provide additional prognostic information based on the molecular mechanisms of transformation and disease progression. A systematic review summarizes the use of protein biomarkers visualized by immunohistochemistry to predict melanoma outcome (Rothberg et al., 2009). Gene expression profiling of melanoma has yielded an enormous amount of information leading to the definition of molecular signatures for disease progression (Haqq et al., 2005; Jaeger et al., 2007; Timar et al., 2010), recurrence, and survival (Bogunovic et al., 2009). For example, global gene expression profiling was used to classify AJCC stage IV melanomas into four subtypes associated with biological parameters such as pigmentation and immune response, with significant correlation to clinical outcomes (Jonsson et al., 2010). In addition, gene expression signatures can predict clinical outcomes in stage III melanoma patients (John et al., 2008). Recently, in a parallel study to this article, Mann et al. (2013) reported that the presence of BRAF and NRAS mutations, and the absence of an immune-related transcriptome profile, predicted poor outcome in stage III melanoma patients. The phenotype of a cell or tissue correlates directly with protein levels and their post-translational modifications, but they may not correlate with mRNA levels (Gygi et al., 1999). Several studies have sought to identify protein signatures associated with melanoma disease progression (Bougnoux and Solassol, 2013).
Proteomic analysis of melanoma samples from large patient cohorts is challenging and may be limited by lack of fresh tissue. Previous proteomic studies on melanoma have primarily used cell lines (Bougnoux and Solassol, 2013) that limit the clinical relevance. While a number of studies have analyzed serum proteomes to identify melanoma biomarkers (Findeisen et al., 2009; Mian et al., 2005), there have been few proteomic studies involving surgical specimens, most likely due to the limited access to adequate amounts of clinical samples. Histology-directed MALDI MS was used to identify differentially abundant proteins from 69 lymph node samples containing metastatic melanoma (stage III) and 17 control, tumor-free lymph nodes (Hardesty et al., 2011). Protein signatures were identified that enabled classification of tumor and normal lymph tissue. Despite extensive efforts using immunohistochemistry, gene expression, and protein profiling, there are few validated prognostic biomarkers that predict prognosis independently of more easily assessed clinical and pathologic parameters (Balch et al., 2009; Schramm and Mann, 2011). Some studies suggest that the protein S-100B is of prognostic value for stage III melanoma (Kruijff et al., 2009), but only serum lactate dehydrogenase (LDH) has been validated as an independent prognostic factor for stage IV melanoma (Deichmann et al., 1999). Novel prognostic markers for routine diagnostic pathology are needed.
Here, we describe the first proteomic analyses of lymph node metastases from stage IIIc melanoma patients with poor and good survival outcomes. Complementary proteomic discovery platforms, two-dimensional fluorescence difference gel electrophoresis (DIGE), isobaric tags for relative and absolute quantitation (iTRAQ), and two-dimensional liquid chromatography coupled to tandem mass spectrometry (2DLC-MS/MS) were used to identify differentially abundant proteins between the survivor groups. Some of these potential prognostic markers were validated using selected reaction monitoring (SRM) mass spectrometry with an orthogonal method of protein quantitation. Protein signatures obtained classify melanoma patients into the two prognostic groups. Differentially abundant proteins identified here provide information on the molecular mechanisms associated with poor survival outcomes and, when independently validated, should enable more accurate risk stratification of AJCC stage III melanoma patients.
Results
Difference gel electrophoresis and iTRAQ 2DLC-MS/MS analyses were performed on whole tissue extracts of lymph node melanoma metastases from AJCC stage IIIc patients with good (n = 19, >4 yr survival post-resection) and poor (n = 14, died <1 yr post-resection) survival outcomes (Tables S1 and S2). Differentially abundant proteins (84) with potential prognostic utility were identified. Of these proteins, 21 have been validated using SRM with high concordance between these analytical approaches.
DIGE analysis
A representative DIGE image is shown in Figure S1 with differentially abundant proteins indicated. On each analytical DIGE gel, more than 1000 protein spots were detected and 994 spots were matched across the nine gels. A total of 20 protein spots showed significant differences in protein abundance between the two prognostic groups (Student's t test P < 0.05, Table S3). Protein spots were excised from preparative gels for identification by tryptic in-gel digestion and LC-MS/MS analysis. Following a Mascot database search of the ESI-MS/MS data, 19 of the 20 protein spots, belonging to 13 protein species, were identified. Protein spot 16 was of low abundance and not identified. Phosphoglycerate kinase 1 (spots 2, 10), glutathione S-transferase P (spots 5, 13), glyceraldehyde 3-phosphate dehydrogenase (spots 15, 20), tumor rejection antigen gp96 (spots 3, 19), and peptidyl-prolyl cis-trans isomerase (spots 7, 9 and 18) showed multiple spots, most likely due to post-translational or chemical (e.g., deamidation of asparagine) modifications leading to spot shifts in the gel.
iTRAQ 2DLC-MS/MS analysis
The summary of proteins, peptides, and spectra obtained from iTRAQ 2DLC-MS/MS analysis using ProteinPilot™ is presented in Table S4. The reproducibility of the iTRAQ 2DLC-MS/MS experiments was assessed using an internal control (iTRAQ 113), comprised of all samples and run in all six iTRAQ sets. The median Pearson's coefficient for the pairwise comparison between the sets was 0.76 (Table S5). A detailed list of proteins detected together with sequence coverage and the number of peptides matched is provided in Table S6. Quantitative iTRAQ 2DLC-MS/MS was performed using the detected peptide levels. After removing peptides with missing values, 8260 peptides were identified from merging the six 2DLC-MS/MS runs, corresponding to 2031 proteins. The number of proteins identified across 33 samples is presented in Figure S3. At 10% FDR (adjusted P-value <0.1), 73 proteins were differentially abundant between poor and good prognosis patients (Table S7), 59 (81%) of which were significant at 5% FDR (adjusted P-value <0.05) and 38 (52%) were significant at 1% FDR (adjusted P-value <0.01). A heat map generated from iTRAQ-labeled, differentially abundant proteins shows clustering of melanoma patients with poor (<1 yr) and good (>4 yr) survival outcomes (Figure 1).
Figure 1.
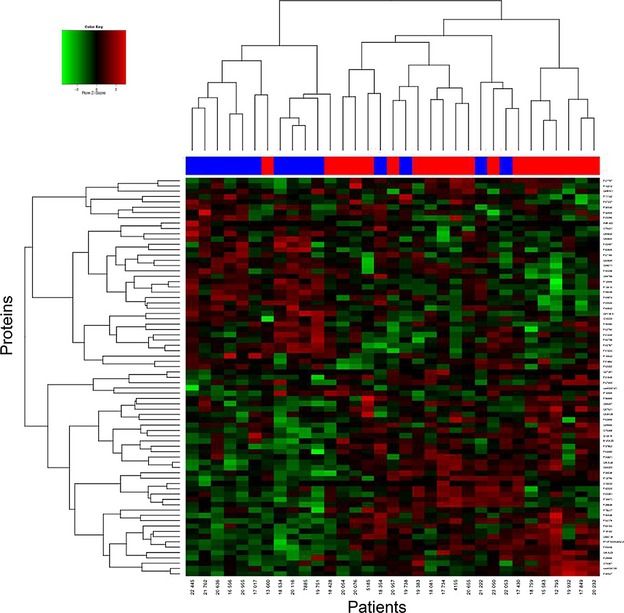
Hierarchical clustering for 73 differentially abundant proteins (10% false discovery rate (FDR)) for 33 melanoma patients. Proteins were identified using iTRAQ 2DLC-MS/MS (Table S7). Decreased (green) and increased (red) protein levels are shown. Patients with poor (<1 yr, blue color) and good (>4 yr, red color) survival outcomes have segregated as indicated by the red and blue bars above the heat map.
Pathways and network analysis
The Human Protein Reference Database (http://www.hprd.org/) was used to assign proteins to their primary cellular location and biological process. More than 80% of the differentially abundant proteins identified by DIGE and iTRAQ 2DLC-MS/MS are intracellular with only 5% assigned to plasma membranes and 12% to the extracellular space (Figure S4A). As shown in Figure S4B, the majority of proteins identified by DIGE and iTRAQ 2DLC-MS/MS are involved in metabolism: energy pathways (20%), protein metabolism (20%), cell communication and signal transduction (17%), cell growth and/or maintenance (11%), regulation of nucleobase, nucleoside, nucleotide and nucleic acid metabolism (13%), immune response (6%), and apoptosis (2%). Key differences for the poor prognosis cohort include an increase in protein metabolism and regulation of nucleobase, nucleoside, nucleotide, and nucleic acid metabolism, and a decrease in cell communication/signal transduction proteins (Figure S4C,D). Of the five significant pathways identified by MetaCore™, four are involved in the immune response (Table S8; 1% FDR). Eight significant networks were generated, of which three were assigned to protein folding and three to immune response (Table S8; 1% FDR).
Verification of prognostic candidates and survival analysis
Nineteen prognostic candidates (accession numbers highlighted in Tables S3 and S7) were selected for validation based on the presence of proteotypic peptides and functional relevance to cancer progression. A further four proteins (ATP synthase subunit β, ATP-dependent RNA helicase DDX5, periostin, and T-complex protein 1 subunit zeta) were selected for SRM analysis due to their potential as prognostic markers (see Discussion). SRM analyses were performed using the original cohort (n = 33; Table S1) plus an additional 10 samples (Table S2). SRM measurements were highly reproducible across the replicates (median R = 0.85, Figure S5). The fold changes of proteins and P-values between the two prognostic groups, as well as the correlation of SRM measurements with iTRAQ data, are presented in Table 1. Twenty-one proteins were differentially abundant between poor and good prognosis groups (P < 0.05), while two proteins (LDHA and KRT9) had marginal significance (P < 0.1; Table 1). All proteins, with the exception of KRT9, were significant at the 10% FDR adjustment (Table 1). The distribution of protein abundance levels across the patient cohorts is shown in Figures2 and S6. The SRM results confirm the iTRAQ 2DLC-MS/MS findings, with high concordance between the two methods (Figure 3); the median Pearson's coefficient for the analyses was 0.74, and for some proteins >0.90 (Table 1). Western blot analyses were performed on two proteins, confirming that protein changes observed by MS are also found using a different analytical platform. Consistent with 2DLC-MS/MS and SRM results, Western blotting showed increased levels of eukaryotic initiation factor 4A-I (P = 0.014) and decreased superoxide dismutase [Mn] (P = 0.099) in patients with poor prognosis (Figure S7).
Table 1.
Summary of SRM measurements from 33 AJCC stage III melanoma samples
| Acc. noa | Protein name | Gene name | FDb PP/GP | Unadjusted P-valuec | Adjusted P-valued | Corr.e | mRNA FDf PP/GP |
|---|---|---|---|---|---|---|---|
| Q15063 | Periostin | POSTN | 1.68 | 0.000 | 0.001 | 0.85 | −1.21 |
| P08238 | Heat-shock protein HSP 90-β | HSP90AB1 | 1.37 | 0.000 | 0.000 | 0.59 | 1.20 |
| P09874 | Poly [ADP-ribose] polymerase 1 | PARP1 | 1.36 | 0.000 | 0.002 | 0.81 | 1.07 |
| P11142 | Heat-shock cognate 71 kDa protein | HSPA8 | 1.27 | 0.003 | 0.009 | 0.52 | −1.29 |
| P17844 | Probable ATP-dependent RNA helicase DDX5 | DDX5 | 1.22 | 0.000 | 0.001 | 0.48 | −1.23 |
| P60842 | Eukaryotic initiation factor 4A-I | EIF4A1 | 1.21 | 0.002 | 0.007 | 0.66 | −1.08 |
| P23526 | Adenosyl homocysteinase | AHCY | 1.19 | 0.001 | 0.003 | 0.75 | 1.07 |
| P12956 | X-ray repair cross-complementing protein 6 | XRCC6 | 1.18 | 0.000 | 0.000 | 0.46 | −1.04 |
| P13010 | X-ray repair cross-complementing protein 5 | XRCC5 | 1.15 | 0.022 | 0.051 | 0.39 | −1.04 |
| P00338 | L-lactate dehydrogenase A chain | LDHA | 1.13 | 0.055 | 0.098 | 0.84 | −1.04 |
| Q08211 | ATP-dependent RNA helicase A | DHX9 | 1.13 | 0.034 | 0.073 | 0.63 | 1.02 |
| Q99798 | Aconitate hydratase, mitochondrial | ACO2 | 1.12 | 0.040 | 0.083 | 0.54 | 1.09 |
| P40227 | T-complex protein 1 subunit zeta | CCT6A | 1.12 | 0.043 | 0.083 | 0.64 | −1.07 |
| P06576 | ATP synthase subunit β, mitochondrial | ATP5B | −1.17 | 0.013 | 0.035 | 0.93 | 1.06 |
| P35527 | Keratin, type I cytoskeletal 9 | KRT9 | −1.22 | 0.098 | 0.158 | 0.23 | 1.01 |
| P27797 | Calreticulin | CALR | −1.26 | 0.003 | 0.008 | 0.69 | −1.06 |
| Q9UL46 | Proteasome activator complex subunit 2, PA28 β | PSME2 | −1.26 | 0.048 | 0.090 | 0.77 | −1.51 |
| P04179 | Superoxide dismutase [Mn], mitochondrial | SOD2 | −1.33 | 0.022 | 0.051 | 0.84 | −1.50 |
| P10909 | Clusterin | CLU | −1.36 | 0.001 | 0.003 | 0.97 | −1.00 |
| Q06323 | Proteasome activator complex subunit 1, PA28 α | PSME1 | −1.37 | 0.000 | 0.001 | 0.86 | −1.29 |
| O75367 | Core histone macro-H2A.1 | H2AFY | −1.41 | 0.001 | 0.003 | 0.74 | −1.11 |
| P13796 | Plastin-2 (L-Plastin) | LCP1 | −1.56 | 0.000 | 0.000 | 0.90 | −3.40 |
| Q9ULZ3 | Apoptosis-associated speck-like protein containing a CARD | PYCARD | −1.70 | 0.000 | 0.000 | 0.80 | −1.09 |
Accession numbers of proteins were from the Swiss-Prot database.
Positive fold difference represents higher levels in poor prognosis subjects, and negative fold difference represents higher levels in good prognosis subjects.
Unadjusted P-values.
False discovery rate is calculated using the function p.adjust in the Limma package based on Benjamini & Hochberg (Benjamini and Hochberg, 1995).
Pearson correlation of SRM values with those of iTRAQ 2DLC-MS/MS.
mRNA gene expression level was obtained using the corresponding data set (see (Mann et al., 2013) for full description of expression data).
GP, good prognosis; PP, poor prognosis.
Figure 2.
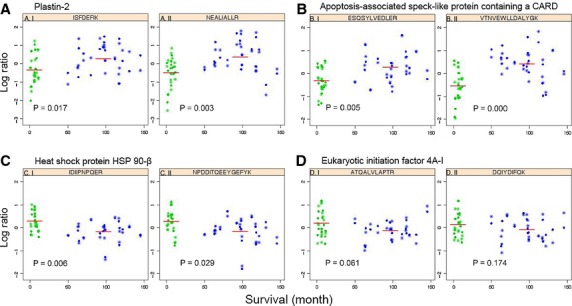
Scatter plots showing the distribution of protein levels in 33 lymph node melanoma metastases, verified by SRM. Each protein is represented by 2 peptides; (A) plastin-2, (B) apoptosis-associated speck-like protein containing a CARD, (C) heat shock protein HSP 90-beta, and (D) eukaryotic initiation factor 4A-I. The ordinate denotes the normalized logarithmic ratio of the sum of transitions from the indicated endogenous peptide to the sum of transitions of all samples to the corresponding peptide analyzed, followed by RUV adjustment. The abscissa represents patient survival in months. Patients with poor survival (<1 yr) are indicated in green, and patients with good survival (>4 yr) are indicated in blue. The red line is the average log ratio of the peptide. P-values of individual peptides were calculated using moderated t test. The experiment was performed in duplicate, circles represent replicate 1, and stars are replicate 2.
Figure 3.
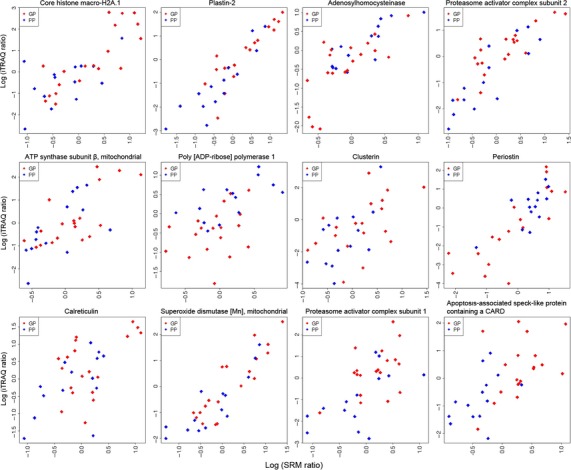
Correlation plots of differentially abundant proteins assessed using iTRAQ 2DLC-MS/MS and SRM from 33 AJCC stage III melanoma patients. The ordinate denotes the log ratio of the protein abundance level using iTRAQ 2DLC-MS/MS analysis, and the abscissa is the log ratio of the protein level assessed by SRM. Abbreviations: GP, good prognosis (red); PP, poor prognosis (blue).
Proteomic patterns as assessed by SRM (Table 1) were used to construct Kaplan–Meier survival curves for patients with good and poor prognosis (Figure 4), with a 24% prediction error. The Kaplan–Meier plot for the cross-validated predicted outcomes from the initial 33 AJCC stage III melanoma patients shows wide separation of patient groups (P = 0.019). Significant (P = 0.02) separation of good and poor prognosis groups was also demonstrated using Kaplan–Meier plots for an independent predicted outcome generated from the 10 independent melanoma samples. The survival times were less strict for these additional 10 samples with median survival of 1.1 yr for poor and 3.6 yr for good prognosis groups. The clear separation of the two prognostic groups indicates the robustness of our candidate markers.
Figure 4.
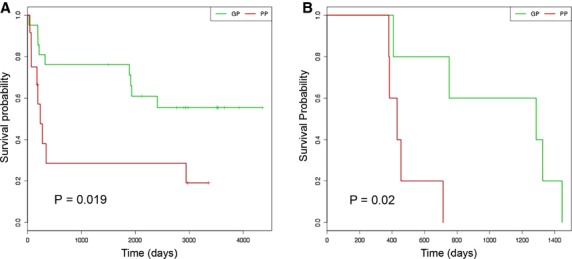
Kaplan–Meier survival curves for patients with good and poor prognosis based on SRM data (Table 1). (A) Kaplan–Meier curve for the cross-validated predicted outcomes from the initial 33 AJCC stage III melanoma patients. (B) Kaplan–Meier plot for an independent predicted outcome generated from the 10 independent melanoma samples. A log-rank test was used to test for significance in survival between the prognostic groups (P < 0.05). Abbreviations: GP, good prognosis; PP, poor prognosis.
Discussion
The AJCC melanoma staging system stratifies patients into heterogeneous groups, with wide variability in outcomes and responses to therapy. More accurate prognostic indicators are needed for metastatic melanoma patients. Considerable efforts are focused on developing criteria for treatment selection, based on individual cancer molecular profiles. While several studies have attempted to identify gene and mRNA signatures for survival in stage III melanoma, proteomic analyses have been limited. Identification of differentially abundant proteins between different prognostic groups will aid the development of prognostic indicators for stage III melanoma and enhance understanding of the molecular mechanisms associated with poor outcomes.
A total of 84 proteins (73 from iTRAQ 2DLC-MS/MS, 13 from DIGE, two common to both) were identified as differentially abundant between the poor and good prognosis cohorts. Many of the identified proteins are highly abundant heat-shock, metabolic, and structural proteins (Table S7, Figure S4). Sample complexity is a critical factor for peptide identification and quantitation. Due to the large number of proteotypic peptides in tissue samples, only a small subset of all peptides in a sample (the most abundant peptides) can be identified and quantified in a single MS run. Prefractionation using SCX chromatography reduced sample complexity to some extent and enabled quantitation of some low abundance proteins (e.g., STAT1, SUB1).
It is not surprising that only two proteins (calreticulin and collagen type 1 α1) were common to both proteomics platforms, as iTRAQ coupled to LC-MS/MS is complementary to DIGE (Wu et al., 2006). Similarly, others have found a low correlation between DIGE and iTRAQ 2DLC-MS/MS (Lim et al., 2009). Poor prognosis patients are characterized by increased levels of proteins involved in protein metabolism/folding, nucleic acid metabolism, angiogenesis, deregulation of cellular energetics, and methylation processes, and decreased levels of proteins involved in apoptosis and immune response (Figure S4).
Several proteins identified here were previously associated with melanoma prognosis. L-lactate dehydrogenase A chain (LDHA) and L-lactate dehydrogenase B chain (LDHB) are more abundant in patients with poor prognosis (Tables1 and S7). LDH was reported as the strongest independent prognostic factor for stage IV melanoma (Deichmann et al., 1999). The lower abundance of histone H2A (H2AFY) in poor prognosis patients (Tables1 and S7) is consistent with the results of Hardesty et al. (2011), who found that decreased levels of histones H4, H3, and H2B correlated with poor survival of patients with AJCC stage III melanoma. L-plastin (LCP1) and signal transducer and activator of transcription 1 (STAT1) also showed significant differential mRNA levels in our parallel transcriptomics study (Mann et al., 2013). This concordance rate may be explained by a predominance of mRNAs encoding membrane proteins identified in the transcriptomics study, whereas the proteomics approaches used here predominantly isolated intracellular proteins (Figure S4A). Proteomic analyses of total cell or tissue lysates typically identify only a handful of membrane proteins; the amphiphilic nature, heterogeneity, and relative low abundance of plasma membrane proteins likely contribute to an under-representation in global proteome analyses. Furthermore, mRNA is not the functional end point of gene expression, and mRNA abundance was previously shown as a poor indicator of corresponding protein levels (Gygi et al., 1999).
The differences in protein abundance between the poor and good prognosis groups are subtle. While iTRAQ labeling enables quantification of large numbers of proteins, it has a low dynamic range and tends to underestimate the actual abundance changes of proteins (Trinh et al., 2013). In addition, the proteins identified here may originate from different cell types in the tissue sample (melanoma, leukocytes, stroma). Analysis of protein abundances in specific cell subpopulations (e.g., by microdissection) may reveal higher fold-changes between the two prognostic groups. Despite the relatively low abundance changes of individual proteins (Table 1), the combined protein signature does classify patients into prognostic groups using the Kaplan–Meier estimate (Figure 4) for the original 33 samples and the additional 10 samples. The functions of some of the identified proteins and their roles in cancer progression and prognosis are described below.
Increased levels of chaperones, DNA repair proteins, and RNA helicases in poor prognosis patients
Cytosolic heat-shock protein 90 kDa, beta (HSP90AB1), its ER paralogue, tumor rejection antigen gp96 (HSP90B1), and heat-shock cognate 71 kDa protein (HSPA8), are found at higher levels in poor prognosis patients (Tables1, S3 and S7). Many proteins required for melanoma initiation and progression, including mutated BRAF, CRAF, IGF1R, cyclin D1, CDK4, and AKT, are known clients of HSP90 (Grbovic et al., 2006). HSP90 was identified as a progression marker in primary melanomas, with high levels associated with higher Clark levels and increased Breslow thickness (McCarthy et al., 2008). Several subunits of T-complex protein 1 (TCP-1) were found at higher abundance in poor prognosis patients (Tables1 and S7). Increased expression of TCP-1 subunit zeta (CCT6A) may be associated with melanoma drug resistance (Tanic et al., 2006).
Increased levels of poly(adenosine diphosphate-ribose) polymerase 1 (PARP1) in lymph node metastases from poor prognosis patients are in accordance with previous observations where overexpression of PARP1 was proposed as a molecular marker of aggressive cutaneous melanoma (Staibano et al., 2005). In addition, PARP1 was associated with melanoma development (Zhang et al., 2011), tumor aggressiveness, and chemoresistance (Tentori et al., 2008). Eukaryotic initiation factor 4A1 (DDX2A, gene EIF4A1), probable ATP-dependent RNA helicase DDX5 (DDX5), and ATP-dependent RNA helicase A (DDX9, gene DHX9) are 3 RNA helicases present at higher levels in poor prognosis patients (Table 1). DDX2A (eIF4A1) mRNA is consistently overexpressed in human melanoma cells in vitro (Eberle et al., 1997). Antisense-mediated downregulation of DDX2A in melanoma cell lines resulted in inhibition of proliferation, suggesting that DDX2A may play a role in melanoma tumorigenesis (Eberle et al., 2002). DDX5 is involved in alternative splicing of the proto-oncogene c-H-ras (Guil et al., 2003) and is elevated in cutaneous squamous cell carcinoma (Wang et al., 2012). DDX9 is cleaved early in apoptosis, suggesting that loss of its function might contribute to induction of apoptosis (Takeda et al., 1999).
Deregulation of mitochondrial enzymes in poor prognosis patients
One of the hallmarks of aggressive malignancies is defective mitochondrial electron transport. Here, several mitochondrial proteins (12%, Figure S4A) were deregulated in poor prognosis patients. Mitochondrial ATP synthase subunit beta (β-F1-ATPase, gene ATP5B) and superoxide dismutase [Mn] (SOD2) are lower while aconitate hydratase (ACO2) is higher in patients with a poor prognosis (Table 1). SOD2 expression is decreased in many cancers and has been implicated as a candidate tumor suppressor gene in human melanoma (Church et al., 1993). Low β-F1-ATPase levels and therefore a diminished bio-energetic capability of the tumor are associated with poor prognosis as assessed in large cohorts of patients with colorectal (Lin et al., 2008), lung (Cuezva et al., 2004), and breast (Isidoro et al., 2005) cancer. Significant findings of different SOD2, ACO2, and β-F1-ATPase levels in melanoma patients with poor survival warrant further investigation for their potential use as biomarkers.
Escape from immuno-surveillance in poor prognosis patients
Metastatic melanoma is highly immunogenic. The majority of the molecular pathways and networks associated with the proteins identified here (Table S8) are involved in immune response, perhaps indicative of evasive immune strategies in patients with poor outcomes. Several proteins involved in the immune response were reduced in poor prognosis patients. Changes in calreticulin (CALR) levels, a component of the antigen-processing machinery (APM), may affect immune response to metastatic melanoma (Anichini et al., 2006). Intracellular calreticulin may contribute to immune evasion through reduction of major histocompatibility complex (MHC) class I antigen presentation (Chao et al., 2010), whereas cell surface calreticulin is required for the interpretation of a cell death response by antigen-presenting cells (Obeid et al., 2007). IFN-γ exposure of melanoma cells increased calreticulin cell surface accessibility (Cornforth et al., 2011) that has been associated with increased phagocytosis of melanoma cells by macrophages, an antitumoral immune response (Qin et al., 2011). Depleted calreticulin in lymph node metastases from poor prognosis patients could contribute to mechanisms by which tumor cells escape immunosurveillance. Subcellular localization of calreticulin in lymph node tumors is required to determine its role in antimelanoma immunity.
The L-plastin gene is activated in most human cancer cells (Park et al., 1994); however, L-plastin is also expressed at high levels in leukocytes and has important functions in innate and adaptive immunity (Shinomiya, 2012). L-plastin was shown to regulate chemokine-induced lamellipodia formation, polarization, and migration of human T-lymphocytes (Freeley et al., 2012). The reduced levels of L-plastin observed in this study in poor prognosis patients may indicate reduced numbers of leukocytes and, subsequently, immune reactivity.
Proteasome activator complex subunit 1 (PA28α, gene PSME1) and proteasome activator complex subunit 2 (PA28β, gene PMSE2), other proteins that might alter the immune response to melanoma cells, were lower in patients with poor outcomes. Proteasomes, the major proteolytic machinery in the cytosol, generate most of the MHC class I-presented peptides (Kloetzel, 2001) recognized by CD8+ cytotoxic T lymphocytes. PA28α and PA28β are two IFN-γ-inducible subunits of proteasome activator PA28 that enhance antigen presentation (Jiang and Monaco, 1997; Van Hall et al., 2000). The generation of a cytotoxic T-lymphocyte epitope on melanoma cells is dependent on the function of PA28 (Sun et al., 2002). Moreover, PA28 function is particularly relevant for the generation of normally poorly excised peptide products (Textoris-Taube et al., 2007), indicating that PA28 is able to alter the immunophenotype of a cell. The depletion of calreticulin, L-plastin, PA28α, and PA28β suggests that the immune response may be impaired in lymph node metastases from patients with reduced survival. These observations are mirrored by the recent parallel study by Mann et al. (2013) that highlights a significant association of immune response genes, T-cell receptor signaling, and IFN-γ signaling with survival outcomes of patients with AJCC stage IIIc metastatic melanoma.
Other functions
Collagen type I αI (COL1A1) was identified at higher abundance from both DIGE and 2DLC-MS/MS analyses in patients with poor prognoses (Tables S3 and S7). Type I collagen is synthesized by tumor-associated non-transformed fibroblasts and demarcates the transition from non-invasive keratinocytic intra-epidermal neoplasia to invasive cutaneous squamous cell carcinoma (Van Kempen et al., 2004). In addition, collagen type I contributes to angiogenesis and the development of deeply invasive cutaneous melanoma (Van Kempen et al., 2008). Periostin (POSTN), present at higher abundance in patients with shorter survival times (Table 1), activates the Akt/PKB signaling pathway, leading to enhanced cellular survival (Bao et al., 2004) and angiogenesis (Shao et al., 2004). Periostin expression is unchanged in primary disease, but overexpressed in 60% of melanoma liver or lymph node metastases, with melanoma cells and the surrounding stroma identified as sources of periostin (Tilman et al., 2007). In addition, periostin levels correlate with increased primary tumor thickness and the development of metastatic disease (Tilman et al., 2007). The high levels of collagen type I αI and periostin detected here (Tables1 and S7) may increase tumor aggressiveness, leading to poor survival outcomes in stage IIIc patients by, for example, enhancing angiogenesis and melanoma cell survival.
S-Adenosylhomocysteinase (SAHH, gene AHCY), the key enzyme in the maintenance of methylation homeostasis, is higher in patients with poor prognosis (Tables1 and S7). More than 70 genes are hypermethylated in cutaneous melanoma (Van Den Hurk et al., 2012). Regional hypermethylation was increased with advanced clinical stage, and the methylation status of MINT31 (methylated in tumor loci 31) was associated with disease outcome in stage IIIc patients (Tanemura et al., 2009). The increased levels of SAHH may indicate deregulated methylation in poor prognosis patients.
Apoptosis-associated speck-like protein containing a CARD (ASC, gene PYCARD) was found in lower abundance in the poor prognosis cohort (Tables1 and S7). Importantly, pro-apoptotic ASC is subject to aberrant DNA methylation and epigenetic silencing in a number of different tumor types, including melanoma (Guan et al., 2003). ASC is high in benign melanocytic nevi and markedly reduced in human melanoma cell lines and clinical specimens (Guan et al., 2003). Decreased abundance of ASC may confer a survival advantage for melanoma cells by allowing them to escape from apoptosis.
In summary, we have performed the first comprehensive proteomic profiling of melanoma lymph node metastases in AJCC stage IIIc patients with poor and good survival outcomes. Deregulated proteins in poor prognosis patients may provide signatures for prognosis and offer insights into important aspects of melanoma biology. Proteins verified by SRM are able to classify stage IIIc melanoma patients into prognostic subgroups (P < 0.02). The protein markers identified here complement the molecular signatures described by Mann et al. (2013). Further assessment of these candidate proteins using robust methodology and statistics will be necessary to evaluate their potential to predict outcomes for patients with AJCC stage IIIc metastatic melanoma.
Methods
Clinical specimens
Melanoma lymph node metastases were obtained from the Melanoma Institute Australia (BioSpecimen Bank, Sydney South West Area Health Service institutional ethics review committee (RPAH Zone) Protocols No. X08-0155/HREC 08/RPAH/262, X11-0023/HREC 11/RPAH/32 and X07-0202/HREC/07/RPAH/30). With informed consent, samples of melanoma lymph node metastases from AJCC stage IIIc patients undergoing surgery at the Melanoma Institute Australia (Sydney, NSW, Australia) were collected and banked. Quantitative iTRAQ 2DLC-MS/MS and SRM analyses were performed on 33 melanoma lymph node tumors from patients with good prognosis (19 samples, >4 yr survival post-resection) and poor prognosis (14 samples, died <1 yr post-resection). The proteomic analyses presented here use the same patient selection criteria and many of the samples that were analyzed in the parallel transcriptomics study (Mann et al., 2013). Due to larger quantities of protein required for DIGE analysis, we analyzed a subset of these samples (n = 18). Providing sufficient material was present, priority was given to samples with the shortest and longest survival times for the poor and good prognosis cohorts, respectively. One sample (PP4) was removed from the DIGE analysis, as this patient died from causes other than melanoma. Clinico-pathologic characteristics of the 33 AJCC stage IIIc melanoma patients and their tumors are summarized in Tables S1 and S2. There was limited access to frozen lymph node metastases from patients from the extreme ends of the survival spectrum (poor: <1 yr, median survival time 0.5 yr; good: >4 yr, median survival time 8.1 yr). For validation by SRM using an independent cohort, 10 additional samples with less strict survival times were used. For poor prognosis (n = 6), median and mean survival times were 1.1 and 1.3 yr (SD = 0.3, range: 1.0–2.0 yr), respectively. For good prognosis (n = 4), median and mean survival times were 3.6 and 3.3 yr (SD = 0.8, range: 2.1–4.0 yr), respectively.
For preparation of protein lysates, frozen melanoma lymph node tumors were ground to a powder with liquid nitrogen and solubilized with 7 M urea, 2 M thiourea, 4% (w/v) CHAPS, 65 mM DTT, 2 mM TBP, and 40 mM Tris base supplemented with protease inhibitors. Lysates were sonicated three times on ice using a step tip probe at 20% cycle intensity for 10 s (Ultrasonics Model W-225R; Ultrasonics, Inc., Plainview, NY, USA) and placed on ice for 30 s between each sonication. Protein lysates were centrifuged (16 000 g, 15 min, 4°C), and stocks stored at −80°C. iTRAQ labeling and 2DLC-MS/MS (Appendix S1), DIGE analysis, protein function and network analysis (Appendix S2), and SRM analysis (Appendix S3) are described in Supporting Information.
iTRAQ 2DLC-MS/MS data analysis
To identify differentially abundant proteins between poor and good prognosis groups, the following statistical analysis was carried out. All peptide expression ratios from the iTRAQ 2DLC-MS/MS analysis were transformed to logarithm (base 2) values. Here, a twofold increase or decrease is reported as 1 or −1, respectively. Peptides detected in less than 25% of samples were removed prior to the analysis (Figure S2). For each protein, a fixed effect model can be written as
| 1 |
where j denotes the subject and k the number of peptide observations for each subject. The vector Y represents log ratios from different subjects, μ represents the mean, and the parameter T is the parameter of interest, which in this case is the true fold difference between the good and poor prognosis groups for the protein under consideration. The parameter Pek is the kth peptide effect that is the difference between the fold change of the k peptide and the average over all peptides, and the symbol ε denotes the error. Our main goal was to estimate T for all identified proteins. This model selects for proteins that are differentially expressed between good and poor prognosis groups adjusting for mean differences between individual peptides within each protein. Candidate protein sets were selected by controlling for 10% FDR, which is equivalent to an adjusted P-value of 0.1. In practice, these models are fitted using functions in r/bioconductor software (Gentleman et al., 2004). The heat map from protein expression data was constructed using the function ‘heatmap.2’ in r that uses a Euclidean distance metric. The MS/MS spectra of differentially abundant proteins were manually inspected for correctness.
SRM data analysis
The SRM data files (*.wiff) were imported into skyline software, manually accessed for quality and exported for statistical analysis. Further manual inspection was performed to determine the inclusion or exclusion of each peptide for downstream analysis. The level of a peptide was summarized based on adding up intensity levels from all transitions from endogenous peptides, and a RUV random normalization was used (Gagnon-Bartsch and Speed, 2012). For each protein, a similar fixed effect model (as for the iTRAQ 2DLC-MS/MS data) was used written as
| 2 |
where j denotes the subject, and k the number of peptide observations for each subject. The vector Z represents normalized log ratios observed in SRM experiments from different subjects, μ represents the mean, and the parameter T represents fold differences between good and poor prognosis for the protein under consideration. The parameter Pek, represents the kth peptide effect, Rl represents the lth run (in this case, two independent runs of the SRM experiment exist for each protein), and the symbol ε denotes the error. For proteins with only one peptide, the model
| 3 |
was used, equivalent to performing a t test between poor and good prognosis groups adjusting for differences between the two replicates. In addition, the Pearson's correlation coefficient between iTRAQ and SRM data for each protein was calculated. Statistical analyses were performed in the r statistical environment.
Survival analysis
Survival modeling was performed to classify patients into two risk groups. All samples (the initial 33 and 10 additional independent samples) were combined and preprocessed together. Missing values were imputed based on KNN imputation implemented in the r package ‘imputation’ (Troyanskaya et al., 2001). Data were standardized (mean centered) at the peptide level and averaged to form protein level expression. Focusing on the SRM data, we selected all 23 proteins from the SRM analysis (Table 1) and assessed the prognostic capacity. Using ‘C classification’ and linear kernel, a linear support vector machine (SVM) model based on the implementation in ‘e1071’ r package (Chang and Lin, Initial version: 2001, last updated: March 4, 2013) was applied to the initial set of 33 patient samples. The average of 100 sets of fivefold cross-validation error rate was calculated. We constructed Kaplan–Meier curves for the cross-validated predicted outcomes from the initial 33 patients. A log-rank test was used to test for significance in survival between the prognostic groups (P < 0.05). In addition, an independent predicted outcome was generated from the additional 10 samples and a corresponding KM plot generated (for details see Appendix S3).
Acknowledgments
We thank Eva H. Yang for performing gel electrophoresis. This research was supported by a Cancer Institute New South Wales (CINSW) Translational Program Grant. The analyses were facilitated by access to the Sydney University Proteome Research Unit established under the Australian Government's Major National Research Facilities program and supported by the University of Sydney. K.L.K is supported by joint National Health and Medical Research Council of Australia (NHMRC) and CINSW Fellowships, J.Y.Y is supported by Australian Research Council Future Fellowship, R.A.S is supported by CINSW Clinical Research Fellowship, and J.F.T, R.A.S, and G.J.A are supported by program grants of NHMRC and CINSW.
Conflict of interest
The authors declare no completing financial, personal, or other interests.
Supporting Information
Additional Supporting Information may be found in the online version of this article:
iTRAQ labeling and 2DLC-MS/MS methods.
DIGE methods and protein function and network analysis.
SRM methods and survival analysis.
Representative protein map from DIGE analysis of proteins extracted from a lymph node melanoma metastasis.
Figure S2. Density plot for the percentage of missing peptides for iTRAQ 2DLC-MS/MS data.
Figure S3. Summary of identification of all 2031 proteins and 73 differentially abundant proteins identified bu iTRAQ 2DLC-MS/MS.
Figure S4. Cellular location and biological processes of differentially abundant proteins between poor and good prognosis patients with melanoma lymph node metastases.
Figure S5. SRM reproducibility between replicates 1 and 2.
Figure S6. Scatter plots showing the distribution of protein levels in 33 lymph node melanoma metastases, verified by SRM.
Figure S7. Western blot analysis of eukaryotic initiation factor 4A-I (eIF4A1) and mitochondrial superoxide dismutase [Mn] (SOD2).
Clinico-pathologic characteristics of 33 AJCC stage III melanoma patients and their tumors.
Table S2. Melanoma patient demographics, pathology, lymph node recurrence and survival parameters.
Table S3. Differentially abundant proteins between poor and good prognosis AJCC stage IIIc melanoma patients identified using DIGE.
Table S4. Summary of iTRAQ 2DLC-MS/MS analyses (number of peptides, proteins, percentage of spectra matched).
Table S5. Reproducibility of iTRAQ 2DLC-MS/MS experiments.
Table S7. Differentially abundant proteins between good and poor prognosis AJCC stage IIIc melanoma patients identified using iTRAQ and 2DLC-MS/MS.
Table S8. Top ranking pathway maps and process networks associated with proteins differentially abundant between poor and good prognosis melanoma patients, based on GeneGo™ and MetaCore™ database analysis.
Table S9. Parameters (Q1, Q3, DP and CE) for SRM assays.
List of proteins identified by iTRAQ LC-MS/MS including sequence coverage and the number of peptides matched.
References
- Anichini A, Mortarini R, Nonaka D, Molla A, Vegetti C, Montaldi E, Wang X. Ferrone S. Association of antigen-processing machinery and HLA antigen phenotype of melanoma cells with survival in American Joint Committee on Cancer stage III and IV melanoma patients. Cancer Res. 2006;66:6405–6411. doi: 10.1158/0008-5472.CAN-06-0854. [DOI] [PubMed] [Google Scholar]
- Balch CM, Gershenwald JE, Soong SJ, et al. Final version of 2009 AJCC melanoma staging and classification. J. Clin. Oncol. 2009;27:6199–6206. doi: 10.1200/JCO.2009.23.4799. [DOI] [PMC free article] [PubMed] [Google Scholar]
- Bao S, Ouyang G, Bai X, Huang Z, Ma C, Liu M, Shao R, Anderson RM, Rich JN. Wang XF. Periostin potently promotes metastatic growth of colon cancer by augmenting cell survival via the Akt/PKB pathway. Cancer Cell. 2004;5:329–339. doi: 10.1016/s1535-6108(04)00081-9. [DOI] [PubMed] [Google Scholar]
- Benjamini Y. Hochberg Y. Controlling the false discovery rate – a practical and powerful approach to multiple testing. J. R. Stat. Soc. Series B Methodol. 1995;57:289–300. [Google Scholar]
- Bogunovic D, O'Neill DW, Belitskaya-Levy I, et al. Immune profile and mitotic index of metastatic melanoma lesions enhance clinical staging in predicting patient survival. Proc. Natl Acad. Sci. USA. 2009;106:20429–20434. doi: 10.1073/pnas.0905139106. [DOI] [PMC free article] [PubMed] [Google Scholar]
- Bougnoux AC. Solassol J. The contribution of proteomics to the identification of biomarkers for cutaneous malignant melanoma. Clin. Biochem. 2013;46:518–523. doi: 10.1016/j.clinbiochem.2012.12.011. [DOI] [PubMed] [Google Scholar]
- Chang C-C. Lin C-J. LIBSVM: a library for Support Vector Machines. http://www.csie.ntu.edu.tw/∼cjlin/libsvm (Initial version: 2001, last updated: March 4, 2013)
- Chao MP, Jaiswal S, Weissman-Tsukamoto R, et al. Calreticulin is the dominant pro-phagocytic signal on multiple human cancers and is counterbalanced by CD47. Sci. Transl. Med. 2010;2:63ra94. doi: 10.1126/scitranslmed.3001375. [DOI] [PMC free article] [PubMed] [Google Scholar]
- Church SL, Grant JW, Ridnour LA, Oberley LW, Swanson PE, Meltzer PS. Trent JM. Increased manganese superoxide dismutase expression suppresses the malignant phenotype of human melanoma cells. Proc. Natl Acad. Sci. USA. 1993;90:3113–3117. doi: 10.1073/pnas.90.7.3113. [DOI] [PMC free article] [PubMed] [Google Scholar]
- Cornforth AN, Fowler AW, Carbonell DJ. Dillman RO. Resistance to the proapoptotic effects of interferon-gamma on melanoma cells used in patient-specific dendritic cell immunotherapy is associated with improved overall survival. Cancer Immunol. Immunother. 2011;60:123–131. doi: 10.1007/s00262-010-0925-y. [DOI] [PMC free article] [PubMed] [Google Scholar]
- Cuezva JM, Chen G, Alonso AM, Isidoro A, Misek DE, Hanash SM. Beer DG. The bioenergetic signature of lung adenocarcinomas is a molecular marker of cancer diagnosis and prognosis. Carcinogenesis. 2004;25:1157–1163. doi: 10.1093/carcin/bgh113. [DOI] [PubMed] [Google Scholar]
- Deichmann M, Benner A, Bock M, Jackel A, Uhl K, Waldmann V. Naher H. S100-Beta, melanoma-inhibiting activity, and lactate dehydrogenase discriminate progressive from nonprogressive American Joint Committee on Cancer stage IV melanoma. J. Clin. Oncol. 1999;17:1891–1896. doi: 10.1200/JCO.1999.17.6.1891. [DOI] [PubMed] [Google Scholar]
- Eberle J, Krasagakis K. Orfanos CE. Translation initiation factor eIF-4A1 mRNA is consistently overexpressed in human melanoma cells in vitro. Int. J. Cancer. 1997;71:396–401. doi: 10.1002/(sici)1097-0215(19970502)71:3<396::aid-ijc16>3.0.co;2-e. [DOI] [PubMed] [Google Scholar]
- Eberle J, Fecker LF, Bittner JU, Orfanos CE. Geilen CC. Decreased proliferation of human melanoma cell lines caused by antisense RNA against translation factor eIF-4A1. Br. J. Cancer. 2002;86:1957–1962. doi: 10.1038/sj.bjc.6600351. [DOI] [PMC free article] [PubMed] [Google Scholar]
- Findeisen P, Zapatka M, Peccerella T, Matzk H, Neumaier M, Schadendorf D. Ugurel S. Serum amyloid A as a prognostic marker in melanoma identified by proteomic profiling. J. Clin. Oncol. 2009;27:2199–2208. doi: 10.1200/JCO.2008.18.0554. [DOI] [PubMed] [Google Scholar]
- Freeley M, O'Dowd F, Paul T, Kashanin D, Davies A, Kelleher D. Long A. L-plastin regulates polarization and migration in chemokine-stimulated human T lymphocytes. J. Immunol. 2012;188:6357–6370. doi: 10.4049/jimmunol.1103242. [DOI] [PubMed] [Google Scholar]
- Gagnon-Bartsch JA. Speed TP. Using control genes to correct for unwanted variation in microarray data. Biostatistics. 2012;13:539–552. doi: 10.1093/biostatistics/kxr034. [DOI] [PMC free article] [PubMed] [Google Scholar]
- Gentleman RC, Carey VJ, Bates DM, et al. Bioconductor: open software development for computational biology and bioinformatics. Genome Biol. 2004;5:R80. doi: 10.1186/gb-2004-5-10-r80. [DOI] [PMC free article] [PubMed] [Google Scholar]
- Grbovic OM, Basso AD, Sawai A, Ye Q, Friedlander P, Solit D. Rosen N. V600E B-Raf requires the Hsp90 chaperone for stability and is degraded in response to Hsp90 inhibitors. Proc. Natl Acad. Sci. USA. 2006;103:57–62. doi: 10.1073/pnas.0609973103. [DOI] [PMC free article] [PubMed] [Google Scholar]
- Guan X, Sagara J, Yokoyama T, Koganehira Y, Oguchi M, Saida T. Taniguchi S. ASC/TMS1, a caspase-1 activating adaptor, is downregulated by aberrant methylation in human melanoma. Int. J. Cancer. 2003;107:202–208. doi: 10.1002/ijc.11376. [DOI] [PubMed] [Google Scholar]
- Guil S, Gattoni R, Carrascal M, Abian J, Stevenin J. Bach-Elias M. Roles of hnRNP A1, SR proteins, and p68 helicase in c-H-ras alternative splicing regulation. Mol. Cell. Biol. 2003;23:2927–2941. doi: 10.1128/MCB.23.8.2927-2941.2003. [DOI] [PMC free article] [PubMed] [Google Scholar]
- Gygi SP, Rochon Y, Franza BR. Aebersold R. Correlation between protein and mRNA abundance in yeast. Mol. Cell. Biol. 1999;19:1720–1730. doi: 10.1128/mcb.19.3.1720. [DOI] [PMC free article] [PubMed] [Google Scholar]
- Haqq C, Nosrati M, Sudilovsky D, et al. The gene expression signatures of melanoma progression. Proc. Natl Acad. Sci. USA. 2005;102:6092–6097. doi: 10.1073/pnas.0501564102. [DOI] [PMC free article] [PubMed] [Google Scholar]
- Hardesty WM, Kelley MC, Mi D, Low RL. Caprioli RM. Protein signatures for survival and recurrence in metastatic melanoma. J. Proteomics. 2011;74:1002–1014. doi: 10.1016/j.jprot.2011.04.013. [DOI] [PMC free article] [PubMed] [Google Scholar]
- Isidoro A, Casado E, Redondo A, et al. Breast carcinomas fulfill the Warburg hypothesis and provide metabolic markers of cancer prognosis. Carcinogenesis. 2005;26:2095–2104. doi: 10.1093/carcin/bgi188. [DOI] [PubMed] [Google Scholar]
- Jaeger J, Koczan D, Thiesen HJ, Ibrahim SM, Gross G, Spang R. Kunz M. Gene expression signatures for tumor progression, tumor subtype, and tumor thickness in laser-microdissected melanoma tissues. Clin. Cancer Res. 2007;13:806–815. doi: 10.1158/1078-0432.CCR-06-1820. [DOI] [PubMed] [Google Scholar]
- Jiang H. Monaco JJ. Sequence and expression of mouse proteasome activator PA28 and the related autoantigen Ki. Immunogenetics. 1997;46:93–98. doi: 10.1007/s002510050246. [DOI] [PubMed] [Google Scholar]
- John T, Black MA, Toro TT, Leader D, Gedye CA, Davis ID, Guilford PJ. Cebon JS. Predicting clinical outcome through molecular profiling in stage III melanoma. Clin. Cancer Res. 2008;14:5173–5180. doi: 10.1158/1078-0432.CCR-07-4170. [DOI] [PubMed] [Google Scholar]
- Jonsson G, Busch C, Knappskog S, Geisler J, Miletic H, Ringner M, Lillehaug JR, Borg A. Lonning PE. Gene expression profiling-based identification of molecular subtypes in stage IV melanomas with different clinical outcome. Clin. Cancer Res. 2010;16:3356–3367. doi: 10.1158/1078-0432.CCR-09-2509. [DOI] [PubMed] [Google Scholar]
- Kloetzel PM. Antigen processing by the proteasome. Nat. Rev. Mol. Cell Biol. 2001;2:179–187. doi: 10.1038/35056572. [DOI] [PubMed] [Google Scholar]
- Kruijff S, Bastiaannet E, Kobold AC, Van Ginkel RJ, Suurmeijer AJ. Hoekstra HJ. S-100B concentrations predict disease-free survival in stage III melanoma patients. Ann. Surg. Oncol. 2009;16:3455–3462. doi: 10.1245/s10434-009-0629-8. [DOI] [PMC free article] [PubMed] [Google Scholar]
- Lim S, Choong LY, Kuan CP, Yunhao C. Lim YP. Regulation of macrophage inhibitory factor (MIF) by epidermal growth factor receptor (EGFR) in the MCF10AT model of breast cancer progression. J. Proteome Res. 2009;8:4062–4076. doi: 10.1021/pr900430n. [DOI] [PubMed] [Google Scholar]
- Lin PC, Lin JK, Yang SH, Wang HS, Li AF. Chang SC. Expression of beta-F1-ATPase and mitochondrial transcription factor A and the change in mitochondrial DNA content in colorectal cancer: clinical data analysis and evidence from an in vitro study. Int. J. Colorectal Dis. 2008;23:1223–1232. doi: 10.1007/s00384-008-0539-4. [DOI] [PubMed] [Google Scholar]
- Mann GJ, Pupo GM, Campain AE, et al. BRAF mutation, NRAS mutation, and the absence of an immune-related expressed gene profile predict poor outcome in patients with stage III melanoma. J. Invest. Dermatol. 2013;133:509–517. doi: 10.1038/jid.2012.283. [DOI] [PubMed] [Google Scholar]
- McCarthy MM, Pick E, Kluger Y, Gould-Rothberg B, Lazova R, Camp RL, Rimm DL. Kluger HM. HSP90 as a marker of progression in melanoma. Ann. Oncol. 2008;19:590–594. doi: 10.1093/annonc/mdm545. [DOI] [PubMed] [Google Scholar]
- Mian S, Ugurel S, Parkinson E, Schlenzka I, Dryden I, Lancashire L, Ball G, Creaser C, Rees R. Schadendorf D. Serum proteomic fingerprinting discriminates between clinical stages and predicts disease progression in melanoma patients. J. Clin. Oncol. 2005;23:5088–5093. doi: 10.1200/JCO.2005.03.164. [DOI] [PubMed] [Google Scholar]
- Obeid M, Tesniere A, Ghiringhelli F, et al. Calreticulin exposure dictates the immunogenicity of cancer cell death. Nat. Med. 2007;13:54–61. doi: 10.1038/nm1523. [DOI] [PubMed] [Google Scholar]
- Park T, Chen ZP. Leavitt J. Activation of the leukocyte plastin gene occurs in most human cancer cells. Cancer Res. 1994;54:1775–1781. [PubMed] [Google Scholar]
- Qin Y, Han Y, Cao C, Ren Y, Li C. Wang Y. Melanoma B16-F1 cells coated with fusion protein of mouse calreticulin and virus G-protein coupled receptor induced the antitumor immune response in Balb/C mice. Cancer Biol. Ther. 2011;11:574–580. doi: 10.4161/cbt.11.6.14414. [DOI] [PubMed] [Google Scholar]
- Rothberg BEG, Bracken MB. Rimm DL. Tissue biomarkers for prognosis in cutaneous melanoma: a systematic review and meta-analysis. J. Natl Cancer Inst. 2009;101:452–474. doi: 10.1093/jnci/djp038. [DOI] [PMC free article] [PubMed] [Google Scholar]
- Schramm SJ. Mann GJ. Melanoma prognosis: a REMARK-based systematic review and bioinformatic analysis of immunohistochemical and gene microarray studies. Mol. Cancer Ther. 2011;10:1520–1528. doi: 10.1158/1535-7163.MCT-10-0901. [DOI] [PubMed] [Google Scholar]
- Shao R, Bao S, Bai X, Blanchette C, Anderson RM, Dang T, Gishizky ML, Marks JR. Wang XF. Acquired expression of periostin by human breast cancers promotes tumor angiogenesis through up-regulation of vascular endothelial growth factor receptor 2 expression. Mol. Cell. Biol. 2004;24:3992–4003. doi: 10.1128/MCB.24.9.3992-4003.2004. [DOI] [PMC free article] [PubMed] [Google Scholar]
- Shinomiya H. Plastin family of actin-bundling proteins: its functions in leukocytes, neurons, intestines, and cancer. Int. J. Cell Biol. 2012;2012:213492. doi: 10.1155/2012/213492. [DOI] [PMC free article] [PubMed] [Google Scholar]
- Staibano S, Pepe S, Lo Muzio L, et al. Poly(adenosine diphosphate-ribose) polymerase 1 expression in malignant melanomas from photoexposed areas of the head and neck region. Hum. Pathol. 2005;36:724–731. doi: 10.1016/j.humpath.2005.04.017. [DOI] [PubMed] [Google Scholar]
- Sun Y, Sijts AJ, Song M, et al. Expression of the proteasome activator PA28 rescues the presentation of a cytotoxic T lymphocyte epitope on melanoma cells. Cancer Res. 2002;62:2875–2882. [PubMed] [Google Scholar]
- Takeda Y, Caudell P, Grady G, Wang G, Suwa A, Sharp GC, Dynan WS. Hardin JA. Human RNA helicase A is a lupus autoantigen that is cleaved during apoptosis. J. Immunol. 1999;163:6269–6274. [PubMed] [Google Scholar]
- Tanemura A, Terando AM, Sim MS, Van Hoesel AQ, De Maat MF, Morton DL. Hoon DS. CpG island methylator phenotype predicts progression of malignant melanoma. Clin. Cancer Res. 2009;15:1801–1807. doi: 10.1158/1078-0432.CCR-08-1361. [DOI] [PMC free article] [PubMed] [Google Scholar]
- Tanic N, Brkic G, Dimitrijevic B, Dedovic-Tanic N, Gefen N, Benharroch D. Gopas J. Identification of differentially expressed mRNA transcripts in drug-resistant versus parental human melanoma cell lines. Anticancer Res. 2006;26:2137–2142. [PubMed] [Google Scholar]
- Tentori L, Muzi A, Dorio AS, et al. Stable depletion of poly (ADP-ribose) polymerase-1 reduces in vivo melanoma growth and increases chemosensitivity. Eur. J. Cancer. 2008;44:1302–1314. doi: 10.1016/j.ejca.2008.03.019. [DOI] [PubMed] [Google Scholar]
- Textoris-Taube K, Henklein P, Pollmann S, et al. The N-terminal flanking region of the TRP2360-368 melanoma antigen determines proteasome activator PA28 requirement for epitope liberation. J. Biol. Chem. 2007;282:12749–12754. doi: 10.1074/jbc.M611644200. [DOI] [PubMed] [Google Scholar]
- Tilman G, Mattiussi M, Brasseur F, Van Baren N. Decottignies A. Human periostin gene expression in normal tissues, tumors and melanoma: evidences for periostin production by both stromal and melanoma cells. Mol. Cancer. 2007;6:80. doi: 10.1186/1476-4598-6-80. [DOI] [PMC free article] [PubMed] [Google Scholar]
- Timar J, Gyorffy B. Raso E. Gene signature of the metastatic potential of cutaneous melanoma: too much for too little? Clin. Exp. Metastasis. 2010;27:371–387. doi: 10.1007/s10585-010-9307-2. [DOI] [PubMed] [Google Scholar]
- Trinh HV, Grossmann J, Gehrig P, Roschitzki B, Schlapbach R, Greber UF. Hemmi S. iTRAQ-based and label-free proteomics approaches for studies of human adenovirus infections. Int. J. Proteomics. 2013;2013:581862. doi: 10.1155/2013/581862. [DOI] [PMC free article] [PubMed] [Google Scholar]
- Troyanskaya O, Cantor M, Sherlock G, Brown P, Hastie T, Tibshirani R, Botstein D. Altman RB. Missing value estimation methods for DNA microarrays. Bioinformatics. 2001;17:520–525. doi: 10.1093/bioinformatics/17.6.520. [DOI] [PubMed] [Google Scholar]
- Van Den Hurk K, Niessen HE, Veeck J, Van Den Oord JJ, Van Steensel MA, Zur Hausen A, Van Engeland M. Winnepenninckx VJ. Genetics and epigenetics of cutaneous malignant melanoma: a concert out of tune. Biochim. Biophys. Acta. 2012;1826:89–102. doi: 10.1016/j.bbcan.2012.03.011. [DOI] [PubMed] [Google Scholar]
- Van Hall T, Sijts A, Camps M, Offringa R, Melief C, Kloetzel PM. Ossendorp F. Differential influence on cytotoxic T lymphocyte epitope presentation by controlled expression of either proteasome immunosubunits or PA28. J. Exp. Med. 2000;192:483–494. doi: 10.1084/jem.192.4.483. [DOI] [PMC free article] [PubMed] [Google Scholar]
- Van Kempen LC, Rijntjes J, Claes A, Blokx WA, Gerritsen MJ, Ruiter DJ. Van Muijen GN. Type I collagen synthesis parallels the conversion of keratinocytic intraepidermal neoplasia to cutaneous squamous cell carcinoma. J. Pathol. 2004;204:333–339. doi: 10.1002/path.1659. [DOI] [PubMed] [Google Scholar]
- Van Kempen LC, Rijntjes J, Mamor-Cornelissen I, Vincent-Naulleau S, Gerritsen MJ, Ruiter DJ, Van Dijk MC, Geffrotin C. Van Muijen GN. Type I collagen expression contributes to angiogenesis and the development of deeply invasive cutaneous melanoma. Int. J. Cancer. 2008;122:1019–1029. doi: 10.1002/ijc.23147. [DOI] [PubMed] [Google Scholar]
- Wang SJ, Zhang C, You Y. Shi CM. Overexpression of RNA helicase p68 protein in cutaneous squamous cell carcinoma. Clin. Exp. Dermatol. 2012;37:882–888. doi: 10.1111/j.1365-2230.2012.04365.x. [DOI] [PubMed] [Google Scholar]
- Wu WW, Wang G, Baek SJ. Shen RF. Comparative study of three proteomic quantitative methods, DIGE, cICAT, and iTRAQ, using 2D gel- or LC-MALDI TOF/TOF. J. Proteome Res. 2006;5:651–658. doi: 10.1021/pr050405o. [DOI] [PubMed] [Google Scholar]
- Zhang M, Qureshi AA, Guo Q. Han J. Genetic variation in DNA repair pathway genes and melanoma risk. DNA Repair (Amst.) 2011;10:111–116. doi: 10.1016/j.dnarep.2010.08.005. [DOI] [PMC free article] [PubMed] [Google Scholar]
Associated Data
This section collects any data citations, data availability statements, or supplementary materials included in this article.
Supplementary Materials
iTRAQ labeling and 2DLC-MS/MS methods.
DIGE methods and protein function and network analysis.
SRM methods and survival analysis.
Representative protein map from DIGE analysis of proteins extracted from a lymph node melanoma metastasis.
Figure S2. Density plot for the percentage of missing peptides for iTRAQ 2DLC-MS/MS data.
Figure S3. Summary of identification of all 2031 proteins and 73 differentially abundant proteins identified bu iTRAQ 2DLC-MS/MS.
Figure S4. Cellular location and biological processes of differentially abundant proteins between poor and good prognosis patients with melanoma lymph node metastases.
Figure S5. SRM reproducibility between replicates 1 and 2.
Figure S6. Scatter plots showing the distribution of protein levels in 33 lymph node melanoma metastases, verified by SRM.
Figure S7. Western blot analysis of eukaryotic initiation factor 4A-I (eIF4A1) and mitochondrial superoxide dismutase [Mn] (SOD2).
Clinico-pathologic characteristics of 33 AJCC stage III melanoma patients and their tumors.
Table S2. Melanoma patient demographics, pathology, lymph node recurrence and survival parameters.
Table S3. Differentially abundant proteins between poor and good prognosis AJCC stage IIIc melanoma patients identified using DIGE.
Table S4. Summary of iTRAQ 2DLC-MS/MS analyses (number of peptides, proteins, percentage of spectra matched).
Table S5. Reproducibility of iTRAQ 2DLC-MS/MS experiments.
Table S7. Differentially abundant proteins between good and poor prognosis AJCC stage IIIc melanoma patients identified using iTRAQ and 2DLC-MS/MS.
Table S8. Top ranking pathway maps and process networks associated with proteins differentially abundant between poor and good prognosis melanoma patients, based on GeneGo™ and MetaCore™ database analysis.
Table S9. Parameters (Q1, Q3, DP and CE) for SRM assays.
List of proteins identified by iTRAQ LC-MS/MS including sequence coverage and the number of peptides matched.