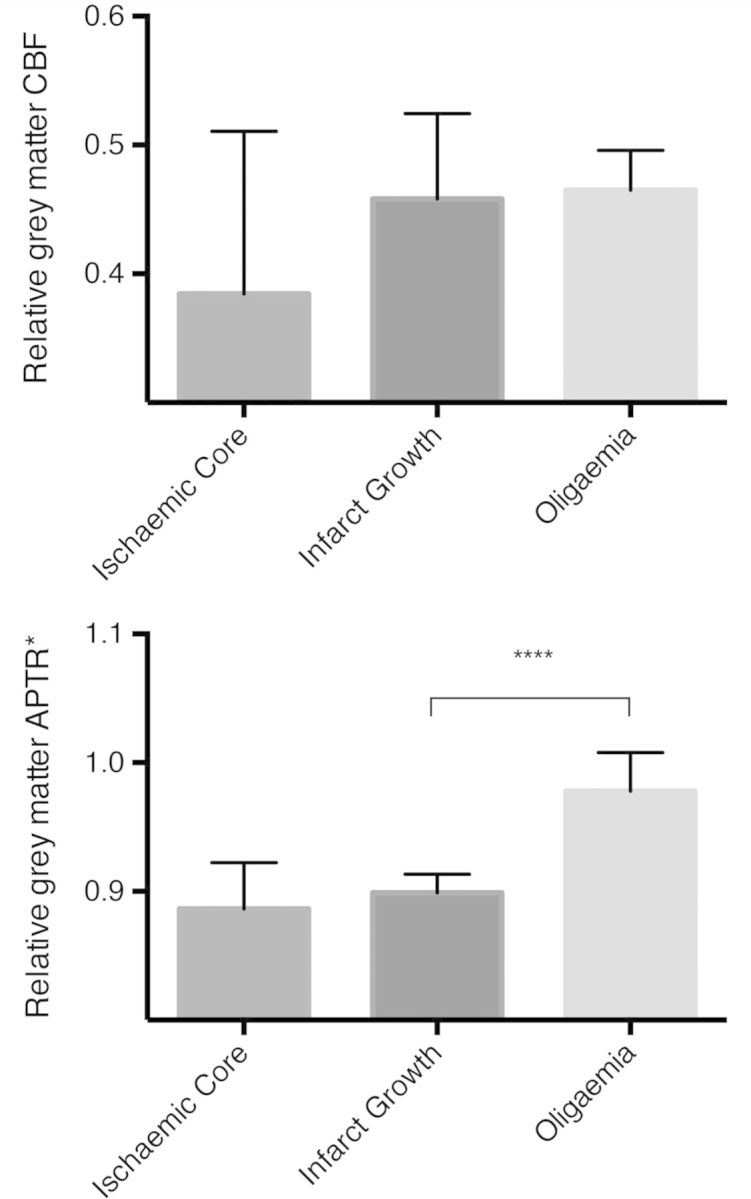
Figure 3.

Mean relative CBF (top) and relative APTR* (bottom) for region of interest voxels within the perfusion deficit, restricted to grey matter voxels only. Analysis in T1-weighted image space within a grey matter mask; error bars represent 95% confidence intervals. ****P < 0.0001.
