

Abstract
The herbal combination is the basic unit of a herbal formula that affects the chemical characteristics of individual herbs. In the present study, a method of simultaneous determination of the 11 marker compounds in Jakyakgamcho-tang was developed using high-performance liquid chromatography with photodiode array detection. The validated analytical method was successfully applied to approach the chemical interaction between Paeonia lactiflora and Glycyrrhiza uralensis in co-decoction. In P. lactiflora, the contents of gallic acid, oxypaeoniflorin, (+)-catechin, paeoniflorin, and benzoylpaeoniflorin were decreased, while those of albiflorin and benzoic acid were increased; in G. uralensis, the contents of liquiritin, isoliquiritin, ononin, and glycyrrhizin were decreased, when decocting two herbs together. Moreover, as the ratio between P. lactiflora and G. uralensis was increased, the contents of chemical contents from each herb were proportionally increased. However, each content of marker compound per the gram of herbal medicine was decreased as the ratio of combinative herbs increased. The results showed that P. lactiflora and G. uralensis affect the extraction efficiency of chemical compounds in a Jakyakgamcho-tang decoction. Overall, the method established in this study was simple, rapid, and accurate, and would be useful for the determination of marker compounds and for the investigation of the chemical interaction between herbal medicines.
Keywords: Chemical interaction, Glycyrrhiza uralensis, Jakyakgamcho-tang, Marker compounds, Paeonia lactiflora
1 Introduction
A traditional herbal formula is the combination of multiple herbal medicines with an intrinsic composition ratio and it is generally administered to a patient as a form of decoction, which is prepared by boiling the herbal combination, mainly with water 1. Herbal combinations can change their innate beneficial effects, moderate or eliminate any of their original toxic side effects, or produce toxic or poor reactions in decoction together 2. Chemical change of the constituents in each compositional herb can be induced in a decoction extracted with multiple herbs because the constituents interact with each other during the decocting process, affecting their extraction efficiency 3. This process results in the variation of the chemical content 4, a change in bioactivity or bioavailability 5–7, or synergistic interaction 8.
Jakyakgamcho-tang (JGT; Shaoyao-gancao-tang in Chinese; Shakuyaku-kanzo-to in Japanese) is a traditional herbal formula used for analgesic purposes. It is originally from the Shang Han Za Bing Lun (known as the Treatise on Cold Damage Disorders), written by Zhang Zhong-Jing in the Han dynasty (200 BC). It consists of two herbs, Jakyak (the Radix of Paeonia lactiflora Pall.; PL) and Gamcho (the Radix et Rhizome of Glycyrrhiza uralensis Fisch.; GU), in a ratio of 1:1. Traditionally, PL nourishes the blood, regulates the menses, and alleviates pain, while GU tonifies the spleen, augments qi, moistens the lungs, and stops cough, and is used as an antidote for a variety of toxic substances. Although GU can moderate spasms and alleviate pain, this effect is only seen when combined with PL, as in JGT 9. JGT has been clinically and pharmacologically applied to prevent muscle cramps and inhibit the contraction of skeletal muscle 10, reduce uric acid, regulate autonomic functions 11, relax intestinal smooth muscle 12, and relieve painful peripheral neuropathy 13. These therapeutic effects of JGT are considered to be related to the combination and interaction of multiple components of the above two compositional herbs.
The analytical method of HPLC, especially when equipped with a photodiode array detector (PDA), has been widely used to perform qualitative and quantitative analyses of various chemical compounds in herbal formulas as it is recognized as a simple, rapid, sensitive, and accurate method 14,15. The simultaneous determination of multiple compounds has been performed using HPLC–PDA with a RP column due to its wide coverage of bioactive compounds in herbal formula 16–18. JGT contains bioactive compounds from each combinative herbal medicine: gallic acid, oxypaeoniflorin, (+)-catechin, albiflorin, paeoniflorin, benzoic acid, and benzoylpaeoniflorin from PL 19–22; and liquiritin, isoliquiritin, ononin, and glycyrrhizin from GU 23. As these compounds are considered major marker compounds of PL and GU, they are used for chemical evaluation or quality assessment of those herbs as well as of the formulas containing them 24–28.
In the present study, we developed a simultaneous method for the quantification of the 11 marker compounds in JGT preparations by a validated HPLC method with PDA and investigated the chemical interaction between the constituents from PL and GU. The quantitative changes of the marker compounds in various ratios of JGT (PL/GU = 1:1, 2:1, 4:1, 1:2, and 1:4) were compared with a single herb extraction. We also determined whether stir-baked GU (GU-SB; processed by heating) affected the extraction efficiency of the chemical compounds from PL. To the best of our knowledge, the present study is the first attempt to investigate chemical interaction between PL and GU using a validated HPLC analytical method with PDA.
2 Materials and methods
2.1 Chemicals and reagents
HPLC-grade methanol, acetonitrile, and water were purchased from J.T. Baker (Phillipsburg, NJ, USA). Formic acid was purchased from Fluka (Seelze, Germany). TFA was obtained from Alfa Aesar (Ward Hill, MA, USA). Acetic acid was supplied by Merck (Darmstadt, Germany). Phosphoric acid was from Wako Pure Chemical Industries (Osaka, Japan). Gallic acid, (+)-catechin, and benzoic acid were purchased from Sigma–Aldrich (St Louis, MO, USA). Oxypaeoniflorin isoliquiritin, ononin, and benzoylpaeoniflorin were supplied by Chengdu Biopurify Phytochemicals (Chengdu, China). Albiflorin, paeoniflorin, and glycyrrhizin were obtained from Wako Pure Chemical Industries. Liquiritin was supplied by NPC Biotechnology (Geumsan, Chungnam, Korea). The purity of all reagents and marker compounds was ≥98%. The chemical structures of the standard compounds are shown in Fig. 1. The dried roots of PL and the dried rhizomes of GU were purchased from the herbal medicine company, Kwangmyungdang Medicinal Herbs (Ulsan, Korea) and authenticated by one of the authors (J.-H. Kim). A voucher specimen (2014-KE42-1–2) has been deposited in the Herbal Medicine Formulation Research Group of the Korea Institute of Oriental Medicine.
Figure 1.
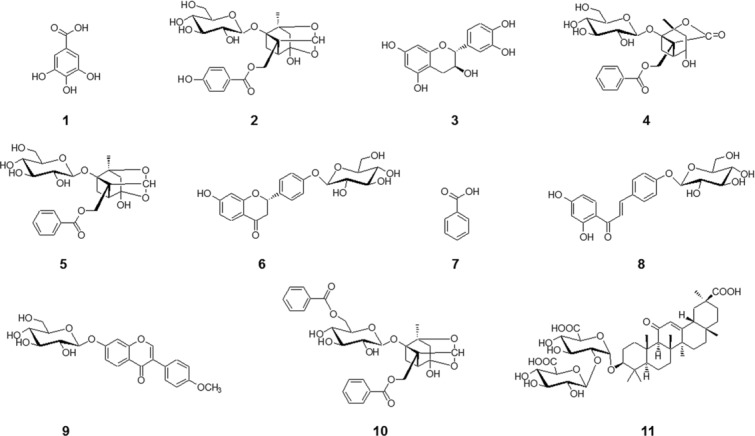
Chemical structures of the 11 standard compounds in JGT. (1) Gallic acid, (2) oxypaeoniflorin, (3) (+)-catechin, (4) albiflorin, (5) paeoniflorin, (6) liquiritin, (7) benzoic acid, (8) isoliquiritin, (9) ononin, (10) benzoylpaeoniflorin, and (11) glycyrrhizin.
2.2 Sample preparation
The GU-SB was produced by initially roasting the crude drug in a herbal roasting facility (THDR-40, Taehwan Automation Industry, Bucheon, Korea) at 180°C for 30 min and then increasing the temperature until the surface of the drugs turned a brown color indicating completion of the process.
The herbal combinations were prepared in ratios of 1:0, 1:1, 1:2, 1:4, 0:1, 2:1, and 4:1 m/m PL to GU, and were extracted with 100 mL of distilled water w/v for 1 h using a heat-reflux extractor. The extracted decoction was centrifuged at 3000 rpm for 10 min and the supernatant was transferred to a 100 mL volumetric flask, which was compensated with water. The decoction was centrifuged at 10 000 rpm for 5 min and filtered through a 0.2 μm syringe filter (SmartPor®; Woongki Science, Seoul, Korea) before injection into the HPLC system.
2.3 Chromatographic conditions
The HPLC–PDA system comprised a Shimadzu LC-20A (Shimadzu Corporation, Kyoto, Japan) equipped with a solvent delivery unit (LC-20AT), autosampler (SIL-20AC), column oven (CTO-20A), degasser (DGU-20A3), and PDA (SPD-M20A). The acquired data were processed using LabSolutions software (Ver. 5.3; Shimadzu). The separation of compounds was performed on a Gemini C18 column (4.6 × 250 mm, 5 μm; Phenomenex, Torrance, CA, USA) maintained at 40°C. The mobile phase consisted of water containing 0.1% formic acid (A) and acetonitrile (B). Gradient elution of the mobile phase was applied: 8–55% (B) over 0–40 min, 55–78% (B) over 40–43 min, held for 3 min, and then reequilibrated to 5% until the end of the analysis. The flow rate was 1.0 mL/min and the injection volume was set to 10 μL. The detection wavelengths were optimized according to the maximum absorption wavelengths of the standard compounds.
2.4 Method validation
2.4.1 Linearity
The stock solutions were prepared by dissolving accurately weighed standard compounds in methanol at concentrations of 1000 μg/mL. Working solutions were produced by diluting the stock solutions containing standard compounds. Diluted working solutions were used to construct calibration curves. The diluted concentrations of marker compounds were plotted against the peak areas and the linearity was determined on the calibration curves.
2.4.2 LOD and LOQ
Blank samples were analyzed in triplicate and the area of the noise peak was calculated. LOD and LOQ were determined as follows: LOD = 3.3 × SD/slope of regression; LOQ = 10 × SD/slope of regression.
2.4.3 Precision
The intraday (n = 5) and interday (n = 5) precisions were calculated by analyzing sample extracts containing low, medium, and high concentrations of marker compounds. The values were represented as the RSD [(SD/mean) × 100].
R2.4.4 ecovery
The recovery test was carried out to determine the accuracy of the method used. The three known amounts of marker compounds (low, medium, and high) were added to the samples and the recovery was calculated as follows: recovery (percentage) = ((detected concentration − initial concentration)/spiked concentration) × 100.
2.4.5 Reproducibility
The reproducibility was determined by calculating the RSD values of the retention times and the absolute areas of marker compounds (n = 5).
2.4.6 Stability
The stability test was conducted by analyzing the extracted solution after storage under refrigeration at 10°C for 4, 8, 12, 16, and 20 h. The stability was determined by calculating the RSD values of the quantities of the marker compounds.
2.5 Statistical analysis
All experiments were performed at least three times. Dunnett's test and two-tailed t-tests were performed for multiple group comparisons using SYSTAT 10 (SPSS, Chicago, IL, USA). Differences were considered significant at p < 0.05, p < 0.01, or p < 0.001.
3 Results and discussion
3.1 Optimization of chromatographic conditions
The mobile phase, modifier, and UV wavelength of PDA were selected as key factors for HPLC analysis of samples. A C18 column was employed to detect 11 marker compounds because it is frequently used in the analysis of herbal medicines. The mobile phase consisted of water (A) and acetonitrile (B), and various modifiers, such as 1% acetic acid, 0.1% phosphoric acid, 0.1% TFA, and 0.1% formic acid, which were tested to achieve better separation between adjacent peaks, especially between oxypaeoniflorin and (+)-catechin. Better resolution and peak shapes between these two compounds, as well as between other peaks, were obtained when using 0.1% formic acid as modifier, as reported previously 29,30 (Fig. 2). The gradient elution was applied for optimal separation of marker compounds after testing for various A/B ratios. The gradient elution conditions were as follows: 8–55% (B) over 0–40 min, 55–78% (B) over 40–43 min, held for 3 min. The UV wavelength was tested using the UV spectrum from 190 to 400 nm to determine the optimal absorption wavelength for each marker compound; the wavelengths were as follows: albiflorin, paeoniflorin, benzoic acid, and benzoylpaeoniflorin at 230 nm; ononin and glycyrrhizin at 250 nm; oxypaeoniflorin at 255 nm; gallic acid at 270 nm; (+)-catechin and liquiritin at 275 nm; and isoliquiritin at 360 nm. The 11 marker compounds were reasonably separated on a chromatogram of samples without overlapping or interception of adjacent peaks (Figs. 3 and 4).
Figure 2.
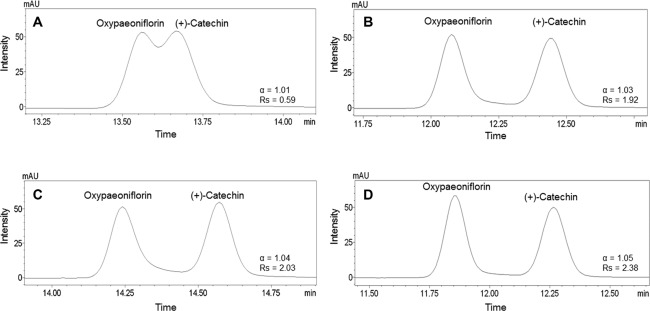
Relative retention and resolution between oxypaeoniflorin and (+)-catechin in modifier added. (A) 1% Acetic acid, (B) 0.1% phosphoric acid, (C) 0.1% TFA, and (D) 0.1% formic acid.
Figure 3.
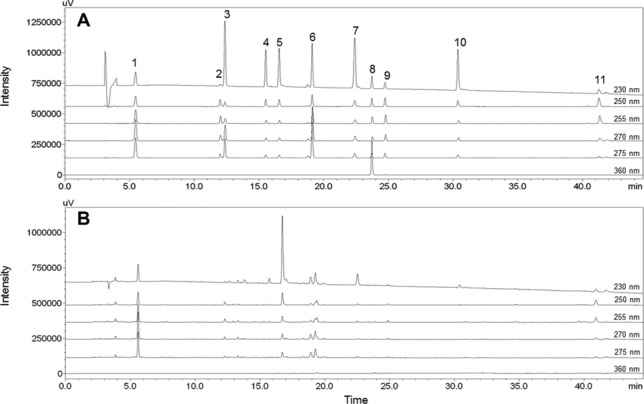
Chromatograms of 11 marker compounds (A) and JGT water extract (B) at the optimum detection wavelength. (1) Gallic acid, (2) oxypaeoniflorin, (3) (+)-catechin, (4) albiflorin, (5) paeoniflorin, (6) liquiritin, (7) benzoic acid, (8) isoliquiritin, (9) ononin, (10) benzoylpaeoniflorin, and (11) glycyrrhizin.
Figure 4.
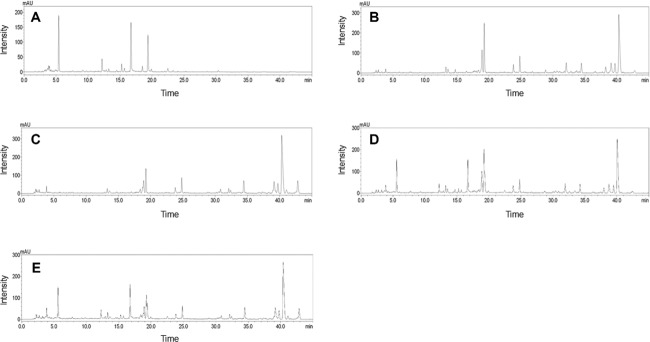
Chromatograms of water extracts of PL (A), GU (B), GU-SB (C), PL+GU (D), and PL + GU-SB (E) at 250 nm.
3.2 Method validation
3.2.1 System suitability
The system suitability was evaluated based on capacity factor (k), relative retention (α), resolution (Rs), theoretical plate number (N), and symmetry (S) of marker compounds. The capacity factor and theoretical plate number ranged from 0.73 to 12.24 and 8420 to 36 0521, respectively. The relative retention was 1 < α < 4 and the resolutions of marker compounds were >1.9, which indicate that the marker peaks were not severely overlapped by adjacent peaks and they were not
disturbed in the quantification of amounts. The symmetry factor was 0.9 < S < 1.3, demonstrating that peak fronting or tailing was not found (Table1).
Table 1.
System suitability: Capacity factor (k), relative retention (α), resolution (Rs), theoretical plate (N), and symmetry factor (S)
| Compound | k | α | Rs | N | S |
|---|---|---|---|---|---|
| Gallic acid | 0.73 | 3.87 | 32.68 | 8420 | 1.04 |
| Oxypaeoniflorin | 2.83 | 1.04 | 1.97 | 84 569 | 1.22 |
| (+)-Catechin | 2.92 | 1.04 | 1.97 | 60 404 | 1.00 |
| Albiflorin | 4.01 | 1.08 | 5.65 | 113 881 | 1.06 |
| Paeoniflorin | 4.35 | 1.08 | 5.65 | 129 607 | 1.21 |
| Liquiritin | 5.06 | 1.21 | 15.63 | 172 593 | 1.05 |
| Benzoic acid | 6.24 | 1.07 | 6.58 | 140 602 | 1.08 |
| Isoliquiritin | 6.76 | 1.05 | 5.94 | 330 675 | 1.06 |
| Ononin | 6.94 | 1.05 | 5.94 | 295 234 | 0.96 |
| Benzoylpaeoniflorin | 8.82 | 1.40 | 45.93 | 365 060 | 1.09 |
| Glycyrrhizin | 12.24 | 1.40 | 45.93 | 360 521 | 1.29 |
3.2.2 Linear regression, LOD, and LOQ
Stock solutions were diluted to seven levels of concentration to produce calibration curves of the 11 marker compounds. The linearity was represented as the correlation coefficient (r2) of compounds, and ranged from 0.9998 to 1.0000. The values of LODs and LOQs were 0.02–0.18 and 0.06–0.56 μg/mL, respectively (Table2).
Table 2.
Linear equation, correlation coefficients (r2), LOD, and LOQ for the marker compounds
| Compound | Wavelength (nm) | Linear equationa) | r2 | Linear range (μg/mL) | LOD (μg/mL) | LOQ (μg/mL) |
|---|---|---|---|---|---|---|
| Gallic acid | 270 | y = 37 363x + 5904.6 | 1.0000 | 2.81−180.00 | 0.03 | 0.09 |
| Oxypaeoniflorin | 255 | y = 13 146x − 165.37 | 1.0000 | 0.94−60.00 | 0.10 | 0.31 |
| (+)-Catechin | 275 | y = 6235.1x + 198.82 | 0.9998 | 0.94−15.00 | 0.18 | 0.56 |
| Albiflorin | 230 | y = 14 283x − 1172.80 | 1.0000 | 1.25−80.00 | 0.05 | 0.16 |
| Paeoniflorin | 230 | y = 14 486x − 7329.00 | 1.0000 | 2.5−160.00 | 0.05 | 0.16 |
| Liquiritin | 275 | y = 18 848x + 1813.50 | 1.0000 | 2.34−150.00 | 0.06 | 0.19 |
| Benzoic acid | 230 | y = 38 279x + 9124.4 | 0.9999 | 1.56−100.00 | 0.02 | 0.06 |
| Isoliquiritin | 360 | y = 43 850x − 322.19 | 1.0000 | 0.16−10.00 | 0.03 | 0.08 |
| Ononin | 250 | y = 34 431x − 453.49 | 1.0000 | 0.23−15.00 | 0.04 | 0.12 |
| Benzoylpaeoniflorin | 230 | y = 21 827x − 2774.5 | 0.9999 | 0.44−28.00 | 0.03 | 0.11 |
| Glycyrrhizin | 250 | y = 7756.5x − 2186.9 | 1.0000 | 3.13−200.00 | 0.17 | 0.53 |
y, peak area (mAU); x, concentration of compound (μg/mL).
3.2.3 Precision, recovery, reproducibility, and stability
The intra- and interday precisions of marker compounds, which were represented as RSD values, were <3.0% in three concentration levels, except for the middle concentration of (+)-catechin, in which they were <3.5% in intra- and interday precisions (Table3). The recoveries of the 11 marker compounds were in the range from 92.8 to 105.9%, with RSD values <5.0% (Table4). The reproducibility of marker compounds, also represented as RSD values, was <1.0% for the retention time and <3.0% for absolute area; the stability did not exceed 1% of the RSD value, except for (+)-catechin (Table5). These results indicate that the established analytical method was precise, accurate, reproducible, and stable for the analysis of the 11 marker compounds in the samples.
Table 3.
Intra- and interday precision of the marker compounds
| Compound | Spiked conc.a) | Intraday (n = 5) | Interday (n = 5) | ||||
|---|---|---|---|---|---|---|---|
 |
Detected conc. (μg/mL) | RSD (%)b) | Accuracy (%) | Detected conc. (μg/mL) | RSD (%) | Accuracy (%) | |
| Gallic acid | 7 | 6.90 | 2.02 | 98.55 | 6.96 | 1.41 | 99.46 |
| 15 | 15.74 | 0.71 | 104.92 | 15.70 | 0.78 | 104.64 | |
| 30 | 29.65 | 0.10 | 98.85 | 29.66 | 0.14 | 98.87 | |
| Oxypaeoniflorin | 2 | 1.96 | 2.58 | 97.86 | 1.97 | 2.53 | 98.27 |
| 5 | 5.06 | 1.22 | 101.13 | 5.06 | 1.14 | 101.28 | |
| 10 | 9.98 | 0.24 | 99.80 | 9.97 | 0.20 | 99.75 | |
| (+)-Catechin | 1 | 1.02 | 1.93 | 101.73 | 1.00 | 0.98 | 100.36 |
| 2 | 2.03 | 3.43 | 101.62 | 2.03 | 3.49 | 101.65 | |
| 4 | 3.98 | 0.87 | 99.62 | 3.98 | 0.90 | 99.57 | |
| Albiflorin | 3 | 2.94 | 1.46 | 98.08 | 2.92 | 1.68 | 97.39 |
| 7 | 6.91 | 0.90 | 98.65 | 6.95 | 1.11 | 99.22 | |
| 15 | 15.06 | 0.17 | 100.37 | 15.04 | 0.20 | 100.27 | |
| Paeoniflorin | 10 | 10.23 | 1.44 | 102.31 | 10.18 | 1.88 | 101.79 |
| 20 | 21.49 | 0.70 | 107.47 | 21.47 | 0.75 | 107.37 | |
| 40 | 39.19 | 0.17 | 97.99 | 39.22 | 0.22 | 98.04 | |
| Liquiritin | 5 | 4.90 | 1.07 | 98.04 | 4.91 | 1.34 | 98.24 |
| 10 | 9.92 | 0.17 | 99.21 | 9.91 | 0.32 | 99.08 | |
| 20 | 20.06 | 0.08 | 100.32 | 20.07 | 0.05 | 100.34 | |
| Benzoic acid | 5 | 4.78 | 0.68 | 95.64 | 4.77 | 0.46 | 95.38 |
| 10 | 10.01 | 0.37 | 100.10 | 10.02 | 0.46 | 100.22 | |
| 20 | 20.05 | 0.12 | 100.25 | 20.05 | 0.10 | 100.23 | |
| Isoliquiritin | 0.5 | 0.50 | 0.18 | 100.26 | 0.50 | 0.28 | 100.30 |
| 1 | 0.97 | 0.16 | 96.72 | 0.97 | 0.18 | 96.79 | |
| 2 | 2.02 | 0.05 | 100.80 | 2.02 | 0.04 | 100.78 | |
| Ononin | 0.5 | 0.50 | 1.67 | 100.42 | 0.50 | 1.44 | 99.71 |
| 1 | 0.95 | 1.22 | 95.08 | 0.96 | 2.25 | 96.12 | |
| 2 | 2.02 | 0.21 | 101.20 | 2.02 | 0.48 | 100.99 | |
| Benzoylpaeoniflorin | 1.5 | 1.56 | 0.83 | 103.89 | 1.56 | 0.73 | 104.32 |
| 3 | 2.86 | 0.92 | 95.36 | 2.86 | 0.94 | 95.26 | |
| 6 | 6.05 | 0.20 | 100.92 | 6.05 | 0.20 | 100.91 | |
| Glycyrrhizin | 10 | 10.10 | 0.97 | 101.00 | 10.12 | 0.87 | 101.21 |
| 20 | 21.21 | 0.37 | 106.06 | 21.17 | 0.26 | 105.85 | |
| 40 | 39.37 | 0.09 | 98.42 | 39.38 | 0.08 | 98.46 | |
Conc., concentration.
RSD (%) = (SD/mean) × 100.
Table 4.
Recovery of the marker compounds (n = 5)
| Compound | Initial conc.a(μg/mL) | Spiked conc. (μg/mL) | Detected conc. (μg/mL) | Recovery (%) | RSD (%)b |
|---|---|---|---|---|---|
| Gallic acid | 29.94 | 7.00 | 36.70 | 96.63 | 1.73 |
| 15.00 | 44.81 | 99.18 | 0.67 | ||
| 30.00 | 57.79 | 92.84 | 0.27 | ||
| Oxypaeoniflorin | 10.53 | 2.00 | 12.57 | 101.73 | 2.62 |
| 5.00 | 15.77 | 104.73 | 1.56 | ||
| 10.00 | 20.84 | 103.09 | 0.57 | ||
| (+)-Catechin | 1.37 | 1.00 | 2.35 | 98.75 | 2.35 |
| 2.00 | 3.35 | 99.03 | 2.36 | ||
| 4.00 | 5.23 | 96.73 | 4.85 | ||
| Albiflorin | 15.92 | 3.00 | 18.85 | 97.75 | 1.46 |
| 7.00 | 22.94 | 100.35 | 2.09 | ||
| 15.00 | 31.26 | 102.29 | 0.68 | ||
| Paeoniflorin | 46.91 | 10.00 | 57.39 | 104.82 | 2.25 |
| 20.00 | 68.04 | 105.68 | 0.45 | ||
| 40.00 | 84.95 | 95.11 | 0.61 | ||
| Liquiritin | 24.91 | 5.00 | 29.57 | 93.14 | 1.80 |
| 10.00 | 34.31 | 94.02 | 0.68 | ||
| 20.00 | 44.04 | 95.64 | 0.86 | ||
| Benzoic acid | 17.95 | 5.00 | 22.74 | 95.82 | 1.14 |
| 10.00 | 28.15 | 102.01 | 0.65 | ||
| 20.00 | 38.51 | 102.82 | 0.39 | ||
| Isoliquiritin | 0.91 | 0.50 | 1.43 | 102.64 | 0.42 |
| 1.00 | 1.92 | 100.65 | 0.28 | ||
| 2.00 | 3.03 | 105.85 | 0.43 | ||
| Ononin | 2.23 | 0.50 | 2.73 | 101.32 | 2.26 |
| 1.00 | 3.23 | 99.88 | 1.29 | ||
| 2.00 | 4.34 | 105.54 | 1.37 | ||
| Benzoylpaeoniflorin | 6.20 | 1.50 | 7.75 | 103.30 | 1.92 |
| 3.00 | 9.09 | 96.40 | 0.94 | ||
| 6.00 | 12.37 | 102.81 | 1.14 | ||
| Glycyrrhizin | 48.32 | 10.00 | 58.30 | 99.78 | 1.92 |
| 20.00 | 68.62 | 101.49 | 0.74 | ||
| 40.00 | 85.66 | 93.35 | 1.05 |
Conc., concentration.
RSD (%) = (SD/mean) × 100.
Table 5.
Reproducibility and stability of the marker compounds (RSD, %)a)
| Compound | Reproducibility (n = 5) | Stability (≤20 h) | |
|---|---|---|---|
| Retention time | Absolute area | ||
| Gallic acid | 0.20 | 1.21 | 0.60 |
| Oxypaeoniflorin | 0.22 | 1.60 | 0.62 |
| (+)-Catechin | 0.18 | 2.30 | 4.95 |
| Albiflorin | 0.10 | 0.77 | 0.57 |
| Paeoniflorin | 0.11 | 1.55 | 0.35 |
| Liquiritin | 0.12 | 0.94 | 0.24 |
| Benzoic acid | 0.07 | 0.97 | 0.40 |
| Isoliquiritin | 0.05 | 2.71 | 0.54 |
| Ononin | 0.05 | 1.23 | 0.80 |
| Benzoylpaeoniflorin | 0.03 | 0.60 | 0.73 |
| Glycyrrhizin | 0.50 | 1.04 | 0.22 |
RSD (%) = (SD/mean) × 100.
3.3 Quantification of and chemical interaction between PL and GU
The validated method was successfully applied to quantifying marker compounds in PL and GU. Chemical interaction between the two herbs was determined by measuring the amount of marker compounds in herbal combination. When extracted with GU and GU-SB, the contents of gallic acid, oxypaeoniflorin, (+)-catechin, and paeoniflorin (at higher ratio of GU), and benzoylpaeoniflorin (at the highest ratio of GU), which were extracted from PL, were significantly decreased compared to the contents of compounds in single PL as the ratio of GU was increased; while the contents of albiflorin and benzoic acid were increased with partially significant relation with the ratio of GU. The contents of four marker compounds from GU, liquiritin, isoliquiritin, ononin, and glycyrrhizin, were significantly decreased compared to the contents of compounds in single GU, when combined with PL in a ratio-dependent manner (Table6). In a previous study, it was reported that the amount of paeoniflorin was also significantly decreased in a JGT formula compared with a single herb as our results showed; however, the amounts of gallic acid, albiflorin, and benzoic acid were not consistent with our results 31. In contrast, in another study, it was reported that the amount of paeoniflorin was more decreased in a blood sample administered by JGT decoction than a single PL extraction 32. These results indicate that GU suppressed the extraction of gallic acid, oxypaeoniflorin, (+)-catechin, paeoniflorin, and benzoylpaeoniflorin, and promoted the extraction of albiflorin and benzoic acid from PL, while PL suppressed the extraction efficiency of four compounds from GU, when decocting together. The extraction of herbal constituents was significantly affected by combinative herbal medicines in the decocting process, which can have an effect on the absorption of components into body 32. Moreover, an increasing ratio of PL or GU significantly affected the extraction of the compounds from counterpart herbs, mostly in a ratio-dependent manner. The GU-SB was also found to have a lower content of liquiritin, isoliquiritin, and ononin, and a higher content of glycyrrhizin than nonprocessed GU. Moreover, GU-SB lowered the extraction of gallic acid, but raised the release of (+)-catechin, albiflorin, and paeoniflorin from PL. Processing, such as stir-baking, can alter the contents of constituents in crude GU and its interaction with PL 33.
Table 6.
Content of the marker compounds in single herbs and the combinational herbs of JGT (μg/mL)
| Compound | PL single (2 g) | PL (2 g) + GU | PL single (2 g) | PL (2 g) + GU-SB | ||||
|---|---|---|---|---|---|---|---|---|
| GU (2 g) | GU (4 g) | GU (8 g) | GU-SB (2 g) | GU-SB (4 g) | GU-SB (8 g) | |||
| Gallic acid | 59.55 ± 0.95 | 50.17 ± 0.46b) (84.25%) | 40.34 ± 0.27b) (67.74%) | 33.09 ± 0.11b) (55.56%) | 59.55 ± 0.95 | 48.00 ± 0.11b),d)) (80.61%) | 36.45 ± 0.14b),f) (61.21%) | 29.92 ± 0.21b),f) (50.24%) |
| Oxypaeoniflorin | 21.70 ± 0.29 | 20.04 ± 0.07b) (92.35%) | 18.60 ± 0.16b) (85.68%) | 14.71 ± 0.19b) (67.78%) | 21.70 ± 0.29 | 19.92 ± 0.08b) (91.78%) | 18.00 ± 0.33b) (82.92%) | 14.94 ± 0.27b) (68.83%) |
| (+)-Catechin | 7.72 ± 0.59 | 6.27 ± 0.12b) (81.21%) | 4.41 ± 0.07b) (57.12%) | 1.78 ± 0.05b) (23.00%) | 7.72 ± 0.59 | 7.07 ± 0.24e) (91.62%) | 6.61 ± 0.43b),e) (85.59%) | 5.35 ± 0.26b),f) (69.32%) |
| Albiflorin | 28.90 ± 0.30 | 30.80 ± 0.65b) (106.60%) | 29.98 ± 0.68 (103.73%) | 28.53 ± 0.52 (98.73%) | 28.90 ± 0.30 | 29.46 ± 0.67 (101.95%) | 31.13 ± 0.43b) (107.74%) | 31.82 ± 0.50b),e) (110.11%) |
| Paeoniflorin | 494.34 ± 2.12 | 441.51 ± 2.00b) (89.31%) | 406.10 ± 3.45b) (82.15%) | 301.12 ± 0.35b) (60.91%) | 494.34 ± 2.12 | 468.46 ± 3.87b),e) (94.77%) | 411.86 ± 3.47b) (83.31%) | 348.46 ± 4.05b),e) (70.49%) |
| Benzoic acid | 24.94 ± 0.17 | 27.05 ± 0.71 (108.44%) | 27.16 ± 0.80 (108.87%) | 28.71 ± 0.88b) (115.09%) | 24.94 ± 0.17 | 26.91 ± 0.67 (107.87%) | 26.42 ± 1.23 (105.91%) | 27.69 ± 2.35 (111.02%) |
| Benzoylpaeoniflorin | 13.16 ± 0.07 | 11.46 ± 0.59 (87.12%) | 10.60 ± 2.39 (80.57%) | 8.38 ± 2.82b) (63.67%) | 13.16 ± 0.07 | 11.59 ± 0.56 (88.08%) | 9.65 ± 0.46a) (73.37%) | 8.36 ± 0.33b) (63.54%) |
| Compound | GU single (2 g) | PL + GU (2 g) | GU-SB single (2 g) | PL + GU-SB (2 g) | ||||
|---|---|---|---|---|---|---|---|---|
| PL (2 g) | PL (4 g) | PL (8 g) | PL (2 g) | PL (4 g) | PL (8 g) | |||
| Liquiritin | 282.18 ± 0.72 | 236.07 ± 0.74b) (83.66%) | 188.03 ± 1.16b) (66.64%) | 143.27 ± 0.58b) (50.77%) | 153.39 ± 0.42f) | 132.69 ± 0.47b),f) (86.51%) | 129.07 ± 0.58b),f) (84.14%) | 86.07 ± 0.73b),f) (56.11%) |
| Isoliquiritin | 16.04 ± 0.09 | 12.71 ± 0.07b) (79.19%) | 4.68 ± 0.01b) (29.18%) | 2.71 ± 0.01b) (16.91%) | 10.06 ± 0.06f) | 6.93 ± 0.04b),f) (68.85%) | 5.29 ± 0.02b),f) (52.61%) | 0.73 ± 0.01b),f) (7.22%) |
| Ononin | 17.33 ± 0.24 | 13.05 ± 0.13b) (75.30%) | 8.05 ± 0.07b) (46.43%) | 5.69 ± ± 0.05b) (32.83%) | 16.50 ± 0.10d) | 11.85 ± 0.04b),e) (71.80%) | 10.12 ± 0.02b),f) (61.31%) | 6.16 ± 0.01b),e) (37.33%) |
| Glycyrrhizin | 488.99 ± 1.33 | 379.76 ± 0.93b) (77.66%) | 303.80 ± 1.23b) (62.13%) | 223.04 ±0.65b) (45.61%) | 569.02 ± 0.64f) | 438.93 ± 0.69b),f) (77.14%) | 375.43 ± 0.39b),f) (65.98%) | 273.50 ± 0.14b),f) (48.07%) |
p < 0.05.
p < 0.01.
p < 0.001 versus single herb group.
p < 0.05.
p < 0.01.
p < 0.001 between GU and GU-SB groups.
Except for (+)-catechin, the contents of most compounds extracted from PL and GU increased proportionally with an increase in ratio of combinative herb. The correlation coefficients between the weight of herbs and the content of compounds were >0.95, indicating that the two variables were highly correlated, which proves that a larger amount of herbal medicine produces a higher content of constituent (Fig. 5). However, the extraction rate was inefficient as the amount of herbs decocted increased. As shown in Table7, the gram content of compound, which was the content of the marker compound per gram of individual herbs in JGT, was calculated from the division of the contents of compounds by the weight of herbs decocted and it showed that the extraction efficiency was decreased in larger quantities of herbs. The gram contents of all compounds were significantly decreased as the weight of herbal medicine was increased in combination of PL with both crude GU and GU-SB. This result indicates that a higher herb quantity in a JGT formula can reduce the extraction rate of its constituents. This is also mainly caused by decreased mass transfer between the herb and water because the amount of analyte extracted depends on the mass transfer of an analyte through the aqueous phase 34.
Figure 5.

Correlation coefficient between the contents of marker compounds and the ratio of herbal composition. (■) Herbal combination with GU, (▲) herbal combination with GU-SB.
Table 7.
Content of the marker compounds per gram of individual herbs in JGT (μg/mL of compound per gram of herb)
| Compound | PL single (2 g) | PL + GU (2 g) | PL single (2 g) | PL + GU-SB (2 g) | ||||
|---|---|---|---|---|---|---|---|---|
| PL (2 g) | PL (4 g) | PL (8 g) | PL (2 g) | PL (4 g) | PL (8 g) | |||
| Gallic acid | 29.78 ± 0.47 | 25.09 ± 0.23b) | 21.47 ± 0.20b) | 17.70 ± 0.12b) | 29.78 ± 0.47 | 24.00 ± 0.05b),d) | 21.00 ± 0.09b),d) | 18.40 ± 0.06b),e) |
| Oxypaeoniflorin | 10.85 ± 0.15 | 10.02 ± 0.03b) | 8.70 ± 0.06b) | 7.23 ± 0.04b) | 10.85 ± 0.15 | 9.96 ± 0.04b) | 8.81 ± 0.06b) | 7.52 ± 0.08b),d) |
| (+)-Catechin | 3.86 ± 0.29 | 3.13 ± 0.06b) | 1.82 ± 0.05b) | 1.02 ± 0.03b) | 3.86 ± 0.29 | 3.54 ± 0.12a),d) | 2.81 ± 0.09b),f) | 0.59 ± 0.01b),f) |
| Albiflorin | 14.45 ± 0.15 | 15.40 ± 0.33b) | 12.79 ± 0.27b) | 10.03 ± 0.33b) | 14.45 ± 0.15 | 14.73 ± 0.34 | 12.06 ± 0.26b),d) | 10.85 ± 0.28b),d) |
| Paeoniflorin | 247.17 ± 1.06 | 220.75 ± 1.00b) | 192.56 ± 0.55b) | 157.08 ± 1.43b) | 247.17 ± 1.06 | 234.23 ± 1.93b),e) | 196.36 ± 7.07b) | 163.00 ± 2.01b),d) |
| Benzoic acid | 12.47 ± 0.09 | 13.52 ± 0.36b) | 10.94 ± 0.17b) | 8.70 ± 0.07b) | 12.47 ± 0.09 | 13.45 ± 0.34b) | 10.50 ± 0.15b),d) | 8.75 ± 0.07b) |
| Benzoylpaeoniflorin | 6.58 ± 0.04 | 5.73 ± 0.29b) | 4.53 ± 0.16b) | 3.42 ± 0.06b) | 6.58 ± 0.04 | 5.79 ± 0.28b) | 4.77 ± 0.14b) | 3.27 ± 0.04b),d) |
| Compound | GU single (2 g) | PL (2 g) + GU | GU-SB single (2 g) | PL (2 g) + GU-SB | ||||
|---|---|---|---|---|---|---|---|---|
| GU (2 g) | GU (4 g) | GU (8 g) | GU-SB (2 g) | GU-SB (4 g) | GU-SB (8 g) | |||
| Liquiritin | 141.09 ± 0.36 | 118.04 ± 0.37c) | 101.97 ± 0.46c) | 77.03 ± 0.20c) | 76.69 ± 0.21f) | 66.34 ± 0.23c),f) | 55.93 ± 0.76c),f) | 43.78 ± 0.48c),f) |
| Isoliquiritin | 8.02 ± 0.04 | 6.35 ± 0.04c) | 5.85 ± 0.02c) | 6.04 ± 0.01c) | 5.03 ±0.03f) | 3.46 ± 0.02c),f) | 3.52 ± 0.02c),f) | 4.19 ± 0.04c),f) |
| Ononin | 8.67 ± 0.12 | 6.52 ± 0.07c) | 5.60 ± 0.06c) | 4.99 ± 0.06c) | 8.25 ± 0.05d) | 5.92 ± 0.02c),e) | 5.45 ± 0.03c),d) | 4.93 ± 0.06c) |
| Glycyrrhizin | 244.49 ± 0.66 | 189.88 ± 0.47c) | 172.70 ± 0.32c) | 138.35 ± 0.03c) | 284.51 ± 0.32f) | 219.46 ± 0.35f) | 194.15 ± 0.13f) | 163.30 ± 0.08f) |
p < 0.05.
p < 0.01.
p < 0.001 versus single herb group.
p < 0.05.
p < 0.01.
p < 0.001 between GU and GU-SB groups.
This phenomenon could have several explanations. First, the presence of a specific constituent could affect the chemical solubility of components from the other herbal medicine, as it was reported that decreased solubility and content of berberine from Coptis rhizome in aqueous solution are due to the presence of glycyrrhizin or increased water solubility of polymeric proanthocyanidins in the presence of paeoniflorin and glycyrrhizin 35,36. The constituents of two herbs could reduce the solubility of most compounds, except for (+)-catechin and benzoic acid from PL. Second, the more the ratio of a combined herb is increased, the larger is the amount of the herb in contact with the solvent, which is mainly water. This means that the larger amount of combined herb may interrupt the counterpart herb's opportunity to react to water. Consequently, the mass transfer between water and the counterpart herb decreased; hence, the compounds cannot be effectively extracted because of the limited volume of water 37.
Global detection of all compounds in a mixture of herbs remains challenging; some constituents from herbs with very weak or no UV signals cannot be detected or identified 2. This study showed a similar limitation, as the chemical determination was performed with “known” marker compounds. However, the 11 authentic standard compounds can play a key role in chemical analysis because they can be used as suitable indicators of PL and GU. Moreover, these marker compounds are also known to have bioactivity. Therefore, the variation of those marker compounds in PL or GU, caused by decocting two herbs together, possibly demonstrates that chemical interaction between two herbs could affect the specific effect of the individual herb; in other words, the unpredicted or minor effect of a single herb could be induced by the combination of another herb—this is theoretically fundamental in the composition of herbal formulas.
4 Concluding remarks
A validated HPLC–PDA analytical method was developed for the simultaneous determination of 11 marker compounds in JGT, a herbal formula consisting of PL and GU, and it was successfully applied to investigate the chemical interaction between PL and GU when decocting together. The developed HPLC–PDA method was simple, precise, and accurate. The contents of the marker compounds from PL and GU were decreased in JGT decoction. The increasing ratio of compositional herb produced higher amounts of marker compounds; however, their relative amounts (gram content of compound) were rather decreased. The results of our study reveal that decocting herbs together significantly influences the extraction efficiency of seven marker compounds from PL and four marker compounds from GU.
Acknowledgments
This study was supported by a grant from the Korea Institute of Oriental Medicine (no. K14030).
The authors declare no conflict of interest.
Glossary
- GU
Glyzyrrhiza uralensis
- GU-SB
stir-baked Glycyrrhiza uralensis
- JGT
Jakyakgamcho-tang
- PDA
photodiode array detector
- PL
Paeonia lactiflora
5 References
- 1.Gao Q, Li J, Cheung JK, Duan J, Ding A, Cheung AW, Zhao K, Li WZ, Dong TT, Tsim KW. Chin. Med. 2007;2:12–22. doi: 10.1186/1749-8546-2-12. [DOI] [PMC free article] [PubMed] [Google Scholar]
- 2.Shen J, Mo X, Tang Y, Zhang L, Pang H, Qian Y, Chen Y, Tao W, Guo S, Shang E, Zhu S, Ding Y, Guo J, Liu P, Su S, Qian D, Duan JA. J. Chromatogr. A. 2013;1297:168–178. doi: 10.1016/j.chroma.2013.05.001. [DOI] [PubMed] [Google Scholar]
- 3.Zhu KY, Fu Q, Xie HQ, Xu SL, Cheung AW, Zheng KY, Luk WK, Choi RC, Lau DT, Dong TT, Jiang ZY, Chen JJ, Tsim KW. J. Sep. Sci. 2010;33:3666–3674. doi: 10.1002/jssc.201000498. [DOI] [PubMed] [Google Scholar]
- 4.He Y, Zhu Y, Zhang R, Ge L, Wan H. Pharmacogn. Mag. 2014;10:72–79. doi: 10.4103/0973-1296.127346. [DOI] [PMC free article] [PubMed] [Google Scholar]
- 5.Wu L, Ding XP, Zhu DN, Yu BY, Yan YQ. J. Pharm. Biomed. Anal. 2010;52:438–445. doi: 10.1016/j.jpba.2010.01.021. [DOI] [PubMed] [Google Scholar]
- 6.Sun Y, Feng F, Yu X. Phytother. Res. 2012;26:67–72. doi: 10.1002/ptr.3516. [DOI] [PubMed] [Google Scholar]
- 7.Cheng S, Lin LC, Lin CH, Tsai TH. J. Pharm. Pharmacol. 2014;66:705–712. doi: 10.1111/jphp.12185. [DOI] [PubMed] [Google Scholar]
- 8.Lau KM, Lai KK, Liu CL, Tam JC, To MH, Kwok HF, Lau CP, Ko CH, Leung PC, Fung KP, Poon SK, Lau CB. J. Ethnopharmacol. 2012;141:250–256. doi: 10.1016/j.jep.2012.02.025. [DOI] [PubMed] [Google Scholar]
- 9.Bensky D, Clavey S, Stöger E. Chinese Herbal Medicine: Materia Medica. Seattle: Eastland Press; 2004. pp. 754–757. [Google Scholar]
- 10.Hinoshita F, Ogura Y, Suzuki Y, Hara S, Yamada A, Tanaka N, Yamashita A, Marumo F. Am. J. Chin. Med. 2003;31:445–453. doi: 10.1142/S0192415X03001144. [DOI] [PubMed] [Google Scholar]
- 11.Wu TH, Chen LC, Yang LL. Rheumatol. Int. 2007;28:27–31. doi: 10.1007/s00296-007-0385-7. [DOI] [PubMed] [Google Scholar]
- 12.Satoh H, Tsuro K. Chin. Med. 2011;2:62–70. [Google Scholar]
- 13.Hidaka T, Shima T, Nagira K, Ieki M, Nakamura T, Aono Y, Kuraishi Y, Arai T, Saito S. Eur. J. Pain. 2009;13:22–27. doi: 10.1016/j.ejpain.2008.03.003. [DOI] [PubMed] [Google Scholar]
- 14.Zhang H, Chen S, Qin F, Huang X, Ren P, Gu X. J. Pharm. Biomed. Anal. 2008;48:1462–1466. doi: 10.1016/j.jpba.2008.09.023. [DOI] [PubMed] [Google Scholar]
- 15.Haribabu K, Ajitha M, Mallvadhani UV. J. Pharm. Anal. Available at: http://dx.doi.org/10.1016/j.jpha.2014.03.001. [DOI] [PMC free article] [PubMed]
- 16.Li Y, Wu T, Zhu J, Wan L, Yu Q, Li X, Cheng Z, Guo C. J. Pharm. Biomed. Anal. 2010;52:597–602. doi: 10.1016/j.jpba.2010.01.018. [DOI] [PubMed] [Google Scholar]
- 17.Hu Y, Lu T, Mao C, Wu H, Zhang X, Wang JV, Gu J. Pharmacogn. Mag. 2013;9:33–38. doi: 10.4103/0973-1296.108136. [DOI] [PMC free article] [PubMed] [Google Scholar]
- 18.Kwok KY, Xu J, Ho HM, Chen HB, Li M, Lang Y, Han QB. J. Pharm. Biomed. Anal. 2013;85:239–244. doi: 10.1016/j.jpba.2013.07.033. [DOI] [PubMed] [Google Scholar]
- 19.Lee SC, Kwon YS, Son KH, Kim HP, Heo MY. Arch. Pharm. Res. 2005;28:775–783. doi: 10.1007/BF02977342. [DOI] [PubMed] [Google Scholar]
- 20.Xu W, Zhou L, Ma X, Chen Y, Qin B, Zhai X, You S. Asian Pac. J. Cancer Prev. 2011;12:2031–2037. [PubMed] [Google Scholar]
- 21.Koo YK, Kim JM, Koo JY, Kang SS, Bae K, Kim YS, Chung JH, Yun-Choi HS. Pharmazie. 2010;65:624–628. [PubMed] [Google Scholar]
- 22.Ding HY, Lin HC, Teng CM, Wu YC. J. Chin. Chem. Soc. 2000;47:381–388. [Google Scholar]
- 23.Ryu YB, Kim JH, Park SJ, Chang JS, Rho MC, Bae KH, Park KH, Lee WS. Bioorg. Med. Chem. Lett. 2010;20:971–974. doi: 10.1016/j.bmcl.2009.12.106. [DOI] [PubMed] [Google Scholar]
- 24.Wang Q, Liu R, Guo H, Ye M, Huo C, Bi K, Guo D. Chromatographia. 2005;62:581–588. [Google Scholar]
- 25.Guo L, Cho SY, Kang SS, Lee SH, Baek HY, Kim YS. J. Ethnopharmacol. 2007;113:306–311. doi: 10.1016/j.jep.2007.06.013. [DOI] [PubMed] [Google Scholar]
- 26.Li SL, Song JZ, Choi FF, Qiao CF, Zhou Y, Han QB, Xu HX. J. Pharm. Biomed. Anal. 2009;49:253–266. doi: 10.1016/j.jpba.2008.11.007. [DOI] [PubMed] [Google Scholar]
- 27.Zhang M, Wang MY, Liu YQ, Shi HM, Li XB. J. Food Drug Anal. 2011;19:131–138. [Google Scholar]
- 28.Wu YP, Meng XS, Bao YR, Wang S, Kang TG. Am. J. Chin. Med. 2013;41:211–219. doi: 10.1142/S0192415X13500158. [DOI] [PubMed] [Google Scholar]
- 29.Fernández PL, Martín MJ, González AG, Pablos F. Analyst. 2000;125:421–425. doi: 10.1039/a909219f. [DOI] [PubMed] [Google Scholar]
- 30.Feng C, Liu M, Shi X, Yang W, Kong D, Duan K, Wang Q. J. Ethnopharmacol. 2010;130:407–413. doi: 10.1016/j.jep.2010.05.028. [DOI] [PubMed] [Google Scholar]
- 31.Li J, Gan PP, Zhong MZ, Huang X, Sun M, Wang Y, Xia ZA. Chin. J. Hosp. Pharm. 2013;33:1301–1304. [Google Scholar]
- 32.Shen L, Hu RW, Lin X, Cong WJ, Hong YL, Feng Y, Xu DS, Ruan KF. Eur. J. Drug Metab. Pharmacokinet. 2012;37:133–140. doi: 10.1007/s13318-011-0052-y. [DOI] [PubMed] [Google Scholar]
- 33.Huang WW, Wang MY, Shi HM, Peng Y, Peng CS, Zhang M, Li Y, Lu J, Li XB. Arch. Pharm. Res. 2012;35:1945–1952. doi: 10.1007/s12272-012-1111-x. [DOI] [PubMed] [Google Scholar]
- 34.Hwang BH, Lee MR. J. Chromatogr. A. 2000;898:245–256. doi: 10.1016/s0021-9673(00)00874-8. [DOI] [PubMed] [Google Scholar]
- 35.Kamigauchi M, Kawanishi K, Sugiura M, Ohishi H, Ishida T. Helv. Chim. Acta. 2008;91:1614–1624. [Google Scholar]
- 36.Tanaka T, Kataoka M, Tsuboi N, Kouno I. Chem. Pharm. Bull. 2000;48:201–207. doi: 10.1248/cpb.48.201. [DOI] [PubMed] [Google Scholar]
- 37.Teo CC, Tan SN, Yong JW, Hew CS, Ong ES. J. Chromatogr. A. 2010;1217:2484–2494. doi: 10.1016/j.chroma.2009.12.050. [DOI] [PubMed] [Google Scholar]