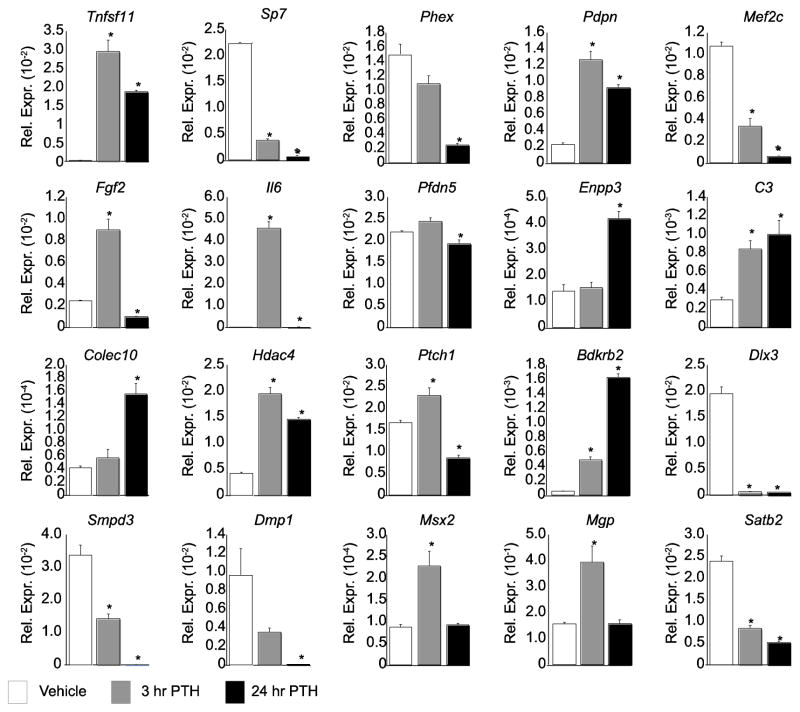
Figure 2. qPCR validates the RNA-seq data and identifies complex response to PTH.
Cells treated with vehicle (white), 3 hr PTH (grey), or 24 hr PTH (black) were evaluated for expression of the indicated gene and normalized to β-actin levels. Samples were analyzed in triplicate ± SEM (*, p<0.05 vs. vehicle).

