

Abstract
NCoR1 (nuclear receptor corepressor) and SMRT (silencing mediator of retinoid and thyroid hormone receptors; NCoR2) are well-recognized coregulators of nuclear receptor (NR) action. However, their unique roles in the regulation of thyroid hormone (TH) signaling in specific cell types have not been determined. To accomplish this we generated mice that lacked function of either NCoR1, SMRT, or both in the liver only and additionally a global SMRT knockout model. Despite both corepressors being present in the liver, deletion of SMRT in either euthyroid or hypothyroid animals had little effect on TH signaling. In contrast, disruption of NCoR1 action confirmed that NCoR1 is the principal mediator of TH sensitivity in vivo. Similarly, global disruption of SMRT, unlike the global disruption of NCoR1, did not affect TH levels. While SMRT played little role in TH-regulated pathways, when disrupted in combination with NCoR1, it greatly accentuated the synthesis and storage of hepatic lipid. Taken together, these data demonstrate that corepressor specificity exists in vivo and that NCoR1 is the principal regulator of TH action. However, both corepressors collaborate to control hepatic lipid content, which likely reflects their cooperative activity in regulating the action of multiple NRs including the TH receptor (TR).
INTRODUCTION
Thyroid hormone (TH) is one of the most important metabolic regulators in humans, and its actions in the liver include the regulation of cholesterol and lipid metabolism. Thyroxine (T4) is the major circulating form of thyroid hormone, and it is converted to its active form, triiodothyronine (T3), by a family of deiodinases (1). T3 regulates metabolic processes via thyroid hormone receptor (TR) isoforms that are expressed in all peripheral tissues, including liver. The TRs mediate target gene regulation by recruiting a constellation of coregulators that include corepressors (CoRs) and coactivators depending upon the presence of T3 (2). While classical models suggest that the corepressors are mainly recruited by the unliganded TR, the mechanisms by which T3 coordinates specific signaling in the liver both positively and negatively are still unknown (3). Indeed, recent work by our laboratory and others has demonstrated that the corepressors appear to play a critical role in mediating ligand sensitivity regardless of the concentration of ligand (4–7).
The two principal corepressors that are suggested to be involved in mediating TH action are nuclear receptor corepressor 1 (NCoR1) and silencing mediator of retinoid and thyroid hormone receptors (SMRT) (4). They are highly homologous modular proteins and have three similar nuclear receptor (NR) interaction domains (NRIDs) at their C termini (8). Importantly, whole-body gene knockouts (KOs) of NCoR1 or SMRT result in embryonic lethality, but mutation or deletion of only the NRIDs allows for full development (6, 9, 10). In NCoRΔID mice, which express an altered NCoR1 allele that lacks the N3 and N2 NRIDs, there is evidence for increased thyroid hormone sensitivity across a variety of tissues, including the liver, hypothalamus, and pituitary (11). In SMRTRID mice, which have mutant S2 and S1 receptor-interacting domains (RIDs), there is evidence of activation of T3 signaling, also suggesting a role for SMRT in T3 action (12). Interestingly, complete deletion of NCoR1 from muscle, adipose tissue, and macrophages also leads to enhanced nuclear receptor signaling, suggesting that the NCoR1 and SMRT play overlapping roles in vivo in the regulation of nuclear receptor action (13, 14). However, biochemical and physiological studies from a number of laboratories suggest that the NRIDs exercise specificity in vivo and that NCoR1 and SMRT are likely to regulate separate pathways (15–19).
To address the role of NCoR1 and SMRT in vivo, with a particular focus on TH action, we developed a conditional SMRT allele that could be inactivated in either the presence or absence of the NCoRΔID allele in the liver only. In this way, we could assess the unique contributions of SMRT to TH action in the presence of a known mutation in NCoR1 which activates TH signaling. Additionally, we were also able to inactivate SMRT globally using a ubiquitously expressed Cre that can be activated postnatally (11). Remarkably, we show that SMRT plays little role in vivo in TH action in the liver. In contrast, SMRT plays a role in retinoic acid receptor (RAR) signaling and collaborates with NCoR1 to regulate hepatic lipogenesis and lipid storage. Furthermore, unlike NCoR1, SMRT plays no role in determining the set point of the hypothalamic-pituitary-thyroid (HPT) axis. Thus, corepressor specificity exists in vivo, which suggests that unique targeting of corepressor-NR interactions is a viable strategy to influence specific metabolic pathways.
MATERIALS AND METHODS
Mice.
Generation of NCoRloxP/loxP mice has been described previously (5). To generate SMRTloxP/loxP mice, a targeting construct was used to introduce two loxP sites upstream and downstream of exon 11 of the Smrt gene, with a neomycin resistance gene surrounded by FLP recombination target (FRT) sites lying upstream of exon 11 (Ingenious Targeting). After generation of mice carrying this allele on a 129/SvJ background, the mice were crossed with mice that ubiquitously express FLP1 recombinase to remove the FRT-neo-FRT cassette from the conditional allele. Correct targeting of the allele was confirmed by sequencing.
To generate the experimental cohorts, SMRTloxP/+ and NCoRloxP/+ mice were crossed with mice expressing Cre recombinase under the control of the albumin promoter (Alb-Cre) [B6.Cg-Tg(Albcre)21Mgn/J; Jackson Laboratory]. Using this line Cre expression is limited to hepatocytes, and complete recombination is seen by postnatal day 7 (20). Resulting cohorts were generated from breeding pairs that were (i) Alb-Cre SMRTloxP/+ NCoRloxP/+ and SMRTloxP/+ NCoRloxP/+ or (ii) Alb-Cre SMRTloxP/loxP NCoRloxP/+ and SMRTloxP/loxP NCoRloxP/+. All experimental mice were on a 129/B6 mixed strain background, and only littermate controls from the cohorts developed were used in experiments.
To generate NCoRΔID mice that lacked liver X receptor alpha (LXRα), Alb-Cre NCoRloxP/loxP mice were crossed to LXRα−/− mice (gift of David J. Mangelsdorf) to obtain LXRα+/− NCoRloxP/loxP Alb-Cre/− animals that were used as breeders to generate LXRα+/+ NCoRloxP/loxP (control), LXRα+/+ NCoRloxP/loxP Alb-Cre/− (L-NCoRΔID), and LXRα−/− NCoRloxP/loxP and LXRα−/− NCoRloxP/loxP Alb-Cre/− (LXRα−/− L-NCoRΔID) mice as littermates. Mice were maintained on a mixed B6/129S background (21). To obtain a mouse strain with global deletion of SMRT (SMRTloxP/loxP UBC-Cre or UBC-SKO mice), we crossed SMRTloxP/loxP animals with mice that expressed a tamoxifen-inducible Cre recombinase under the control of the human ubiquitin C promoter using an identical strategy to that described previously for NCoR1 (11).
Animal experiments.
All experiments were approved by the Beth Israel Deaconess Medical Center (BIDMC) Institutional Animal Care and Use Committee. Mice were housed in the BIDMC animal facility with a 12-h light/dark cycle and supplied with food and water ad libitum. At 4 to 6 weeks of age, all groups of mice either remained on standard chow (F6 rodent diet 8664; Harlan Teklad) or were put on a low-iodine diet supplemented with 0.15% propylthiouracil (PTU/LI diet) (TD.95125; Harlan Teklad), a potent inhibitor of thyroid hormone synthesis, for 3 weeks. At the end of this period, mice were sacrificed. Blood samples were taken by cardiac puncture. Tissues were rapidly collected, flash-frozen in liquid nitrogen, and stored at −80°C. All gene expression and hormonal analysis was performed on groups of 5 or 6 female and male mice from each genotype. The SMRTloxP/loxP UBC-Cre (UBC-SKO) and SMRTloxP/loxP (control) animals were treated with tamoxifen as described previously for 5 days (11). The level of recombination was assessed by quantitative PCR (qPCR) after the mice were euthanized, and only animals with expression levels of SMRT under 10% of that found in wild-type mice (8 of 8 animals) were included in the gene expression analysis.
Western blotting.
Protein lysates from frozen liver, heart, and quadriceps were prepared as described previously (5). For Western blot analysis, 50 μg of the protein lysates was resolved on 3 to 8% gradient Tris-acetate Novex gels (Invitrogen), and blots were probed for both NCoR1 and SMRT (rabbit polyclonal anti-NCoR2 antibody, PA1-843; Thermo Scientific), NCoR1 alone (rabbit polyclonal anti-NCoR antibody, A301-145A; Bethyl), SMRT-specific antibody (rabbit polyclonal anti-SMRTe antibody, 06-891; Millipore), histone deacetylase 3 (HDAC3) (rabbit polyclonal anti-HDAC3 antibody, ab7030; Abcam), rabbit monoclonal anti-fatty acid synthase (anti-FASN) antibody (C20G5; Cell Signaling), and appropriate horseradish peroxidase (HRP)-conjugated secondary antibodies and visualized using ECL prime (GE Healthcare).
Real-time quantitative PCR.
For mRNA expression analysis, total RNA was extracted from liver samples and whole pituitary using STAT-60 reagent (Teltest) according to the manufacturer's instructions. Total RNA (500 ng) was reverse transcribed using a cDNA kit (SuperScript VILO; Invitrogen), and approximately 5 ng of cDNA was used per qPCR. qPCRs were performed in duplicates using an ABI 7900HT Fast real-time PCR system and both TaqMan and SYBR chemistries.
All mRNAs except Chrebpα (carbohydrate responsive element binding protein alpha) and Chrebpβ were quantified using TaqMan Gene Expression Assays (Applied Biosystems) and TaqMan Universal PCR master mix, No-AmpErase (Applied Biosystems), in a total volume 10 μl. Chrebpα and Chrebpβ mRNA expression levels were quantified using Power SYBR Green PCR master mix (Applied Biosystems) and previously published primers (22). Relative mRNA levels were calculated using the standard-curve method and normalized to the level of cyclophilin mRNA except those of Chrebpα and Chrebpβ, which were normalized to 36B4 mRNA.
Liver triglycerides and cholesterol.
The lipids were extracted by the method described by Folch et al. with modifications, as described previously (5, 23). Briefly, approximately 150 mg of frozen livers was extracted in a chloroform-methanol (2:1) mixture. Following addition of 0.9% NaCl, centrifugation, and removal of the upper methanol-water phase, the organic phase was dried and then dissolved in butanol–Triton X-100–methanol. Cholesterol and triglycerides were measured using enzymatic colorimetric assays from Stanbio Laboratories.
Microarray analysis.
For microarray analysis, RNA was extracted from three replicate livers for each group (NCoRloxP/loxP SMRTloxP/loxP [Dflox], liver-specific SMRT knockout [L-SMRT KO], and liver-specific NCoRΔID SMRT KO [L-DKO] mice; all were euthyroid, female mice) using a Perfect Pure RNA tissue kit (5 Prime). Total RNA (200 ng) was used for GeneChip analysis. Preparation of terminally labeled cDNA, hybridization to genome-wide murine Gene Level 2.0 ST GeneChips (Affymetrix), and scanning of the arrays were carried out according to the manufacturer's protocols (Affymetrix, Santa Clara, CA). Robust multichip average (RMA) signal extraction, normalization, and filtering were performed as described using the comprehensive R- and bioconductor-based web service for microarray data analysis CARMAweb (5, 24, 25). A variation filter was applied for selecting informative (i.e., significantly varying) genes. The filtering criteria for the exemplary data sets required an interquartile range of >0.5 and at least one sample with expression intensity of >100.
Statistical group comparisons for microarray experiments.
To calculate differential gene expression levels between individual sample groups, we performed a statistical comparison using the limma algorithm as described previously (5). Briefly, limma estimates the fold change between predefined sample groups by fitting a linear model and using an empirical Bayes method to moderate the standard errors of the estimated log-fold changes for each probe set (26). A multiple testing correction based on the false discovery rate (FDR) was performed to produce adjusted P values. Complete GeneChip data sets are available online as a Gene Expression Omnibus (GEO) entry (see below).
Histological analysis.
Samples of livers were fixed in 4% formalin. Paraffin embedding, sectioning (5 μm), and hematoxylin and eosin (H&E) staining of the sections were performed using standard techniques (AML Labs, Inc., Baltimore, MD).
Plasma lipids and hormone levels.
Total serum cholesterol and triglycerides were measured using standard assays purchased from Stanbio Laboratory. Total plasma T4 and T3 levels were measured using a Coat-a-Count (Siemens Healthcare Diagnostic Inc., Los Angeles, CA) radioimmunoassay. Circulating thyroid-stimulating hormone (TSH) was also measured in plasma via Milliplex MAP (mutianalyte panels) (rat thyroid hormone TSH panel; EMD Millipore, Billerica, MA).
In vivo VLDL production test.
Mice were fasted for 5 h and injected via tail vein with 600 mg/kg of tyloxapol (Sigma-Aldrich) as a 15% solution in saline to block very-low-density lipoprotein (VLDL) clearance. Blood samples were taken before and 30 min, 1 h, and 2 h after the injection. Plasma triglycerides were measured using an enzymatic colorimetric assay from Stanbio Laboratory.
Statistical analysis.
Statistical analysis was performed using the Prism, version 6, program. The differences in mRNA expression levels, hormone levels (TH and TSH), and lipid profiles (triglycerides and total cholesterol concentration) were tested using one-way analysis of variance (ANOVA), with multiple comparisons performed using a Tukey-Kramer post hoc test or using two-way ANOVA with a Bonferroni post hoc test where appropriate.
Microarray data accession number.
Microarray data for NCoR1 and SMRT have been deposited in the GEO database under accession number GSE54192.
RESULTS
Liver-specific disruption of nuclear corepressor function does not alter development.
To investigate the effect of double disruption of both NCoR1 and SMRT, we developed a conditional SMRT allele that in the presence of the Cre recombinase would effectively disrupt SMRT in the targeted cell type (Fig. 1A). We crossed the mice carrying this allele with those expressing the conditional NCoRΔID allele in the presence or absence of Cre recombinase under the control of the albumin promoter (Fig. 1A). Using this strategy, we generated liver-specific NCoRΔID (L-NCoRΔID) mice, liver-specific SMRT−/− (L-SMRT KO) mice, and liver-specific NCoRΔID SMRT−/− mice (L-DKO) along with two groups of control mice: wild-type (WT) mice lacking floxed alleles but expressing albumin-Cre and NCoRloxP/loxP SMRTloxP/loxP (Dflox) mice.
FIG 1.

Disruption of NCoR1 and SMRT in the liver. (A) Conditional targeting of the mouse smrt gene. In the cartoon of the mouse smrt gene, the exons are shown by numbered boxes. loxP sites and the FRT-Neo-FRT cassette are indicated with arrows. Positions of the PCR primers and image of the PCR products are shown below the targeting construct map (upper map). The expected size of the PCR fragment encompassing the targeted SMRT locus (625 bp) is 196 bp larger than that of the wild-type locus (429 bp). After albumin-Cre recombinase expression in the liver, exon 11 is deleted, and a stop codon has appeared in exon 12, truncating the SMRT allele (lower map). aa, amino acids. (B) Western analysis was performed using an antibody (Ab) directed against both NCoR1 and SMRT or each in the indicated genotypes and the indicated tissues. Pol II, polymerase II. (C) qPCR was performed on mRNA using assays directed against the 5′ or 3′ region of NCoR1 and exon 11 of SMRT. ****, P < 0.0001.
The expression of corepressor proteins in the livers of mice with these genotypes was examined first using an antibody that recognizes both SMRT and NCoR1. As shown in Fig. 1B, both WT and Dflox mice show a single 270-kDa band which represents hepatic NCoR1 and SMRT. In contrast, L-NCoRΔID mice (Fig. 1B, yellow) demonstrate both the 270-kDa band (SMRT) and a smaller-molecular-mass band representing NCoRΔID, while L-SMRT KO mice show only the 270-kDa NCoR1 band. Finally, L-DKO mice show only the smaller NCoRΔID band and lack the 270-kDa SMRT band. Importantly, the dual-specificity antibody allows us to demonstrate that NCoR1 and SMRT are expressed in relatively equal amounts in the liver. To confirm the dual specificity of this first antibody, we also employed a NCoR1-specific antibody which recognizes only the smaller NCoRΔID allele in L-NCoRΔID mice and does not recognize SMRT. Finally, using a SMRT-specific antiserum, we conclusively show that SMRT is lost in L-SMRT KO and L-DKO mice, with any remaining amount likely derived from nonhepatocytes in the liver tissue homogenate and potentially hepatocytes inefficiently targeted by Cre recombinase (Fig. 1B). Importantly, the disruption of SMRT was confined to the liver as both heart and muscle showed only the SMRT isoform bands in all tested genotypes using the dual-specificity antibody (data not shown) and the SMRT-specific antiserum (Fig. 1B). Consistent with our Western analysis, mRNA expression in the liver indicates the appropriate deletion of SMRT and of the 3′ region of NCoR1 by Alb-Cre in the expected genotypes (Fig. 1C). Importantly, the 5′ region of NCoR1 is preserved in L-NCoRΔID mice.
Additionally, as the loss of NCoR1 and SMRT has been reported to cause destabilization of HDAC3 protein, we examined its expression and found similar hepatic protein levels across genotypes (Fig. 2A) (27). Disruption of either or both corepressors (CoRs) in the liver did not lead to any differences in the body weight of controls at 7 to 9 weeks of age (Fig. 2B). Surprisingly, despite the fact that we disrupted CoR function only in the liver, both male and female L-DKO mice had slightly lower TT4 and TT3 levels than control animals (Fig. 2C). However, their circulating TSH levels were not elevated, and their levels of pituitary TSH subunit expression were also not different (Fig. 2C).
FIG 2.

Liver-specific disruption of nuclear corepressor function does not alter development. (A) Western analysis was performed using an antibody against HDAC3. PC, positive control of HDAC3 expressed in lysate from 293T cells. Band intensity was quantified by ImageJ software and normalized for Pol II. These data are shown as the means ± standard errors of the means (SEM). (B) Body weights of both male and female mice (7 to 9 weeks of age) were measured in all genotypes. (C) Total T4, total T3, and plasma TSH levels were determined in the indicated genotypes, and qPCR for the TSH subunit genes was also performed in female mice. For qPCR and thyroid function studies, 5 or 6 mice per group were used. The data are shown as the means ± SEM. **, P < 0.01; *, P < 0.05 (by one-way ANOVA).
NCoR1 plays a specific role in TH action.
To test our hypothesis that corepressor specificity exists in vivo, we first examined the expression of TH target genes in the livers from female euthyroid animals of all genotypes. Importantly, all genotypes had similar, or in the case of L-DKO mice, slightly reduced TH levels, with normal levels of TSH. As shown in Fig. 3A, despite similar levels of T4 and T3, the expression of Fasn, Thrsp, Bcl3, Gpd2, and Dio1 was significantly elevated in L-NCoRΔID mice by up to 3-fold, while the expression of these genes in L-SMRT KO mice remained unchanged compared to WT and Dflox controls. Importantly, the deletion of SMRT does not lead to the upregulation of NCoR1 protein, and thus the relative lack of function of SMRT deletion is not due to a compensatory increase in NCoR1 (Fig. 3B). In L-DKO mice the expression levels of each of these genes were similar to those found in L-NCoRΔID mice or, in some cases, slightly increased. In contrast to positively regulated TH target genes, the disruption of one or both CoRs on the negatively regulated TH target genes Gsta2 and Fbxo21 had little consistent effect although Gsta2 expression was increased in the absence of both corepressors. Thus, NCoR1 plays a unique and sufficient role in mediating TH sensitivity on positively regulated TH targets, while SMRT plays little role in TH action.
FIG 3.

Thyroid hormone action is regulated by NCoR1 and not SMRT. (A) qPCR was performed on hepatic mRNA from all genotypes in the euthyroid state. (B) Western analysis of hepatic protein extracts from the indicated genotypes was performed using an antibody directed against NCoR1. The intensity of each protein band was quantified by ImageJ software, and expression was normalized for Pol II. The data are shown as the means ± SEM. (C) A second cohort of mice was rendered hypothyroid by a PTU/LI diet for 3 weeks. qPCR was performed on hepatic mRNA. (D) Serum and hepatic cholesterol concentrations were compared between chow-fed and PTU/LI diet-fed mice in three genotype groups (n = 5 or 6 mice per group). For serum and hepatic total cholesterols, the data are shown as the means ± SEM. ****, P < 0.0001; ***, P < 0.001; **, P < 0.01; *, P < 0.05 (by two-way ANOVA). (E) Hepatic qPCR analysis of cholesterol metabolism-related-genes compared across three genotype groups in the hypothyroid state (n = 5 or 6 mice per group). For qPCR, the data are shown as the means ± SEM. ****, P < 0.0001; **, P < 0.01; *, P < 0.05 (by one-way ANOVA). (F) qPCR was performed on RAR target genes from all genotypes in the euthyroid state. For qPCR, 5 or 6 mice per group were used. The data are shown as the means ± SEM. ****, P < 0.0001; ***, P < 0.001; **, P < 0.01; *, P < 0.05 (by one-way ANOVA).
To further confirm the role of corepressor specificity, we next looked at hypothyroid animals where both corepressors are hypothesized to play a role in ligand-independent repression of positive TH targets by the TR isoforms. Indeed, we have shown previously that the expression of NCoRΔID alone relieves repression on positive TH targets in hypothyroidism in the liver (5, 6). To do this, we rendered a second cohort of female animals hypothyroid with a diet low in iodine and containing PTU that after 3 weeks causes hypothyroidism with undetectable T4 levels. Remarkably, in hypothyroid animals the deletion of SMRT had no effect on the repression of positive targets, and only when NCoRΔID was also expressed did we see activation or depression of Fasn, Bcl3, Gpd2, and Dio1 (Fig. 3C). Similar to the euthyroid state, both NCoR1 and SMRT had little consistent effect on negatively regulated targets. Thus, SMRT appears to play a very little role in regulating TH action in vivo in the liver, at least in isolation.
Because hypothyroidism leads to an increase in serum cholesterol, we also looked at the role of corepressor disruption in this process (28). We have shown previously that the expression of NCoRΔID in the liver does not prevent the increase in serum cholesterol in hypothyroidism. Interestingly, while the disruption of SMRT had no effect on serum cholesterol compared to levels in controls, L-DKO mice were protected slightly from the rise, suggesting that this effect of hypothyroidism was blunted in L-DKO mice (Fig. 3D) (5). Indeed, L-DKO mice have increased Cyp7a and Ldlr expression levels, suggesting that the deletion of both NCoR1 and SMRT function allows for enhanced cholesterol clearance from the serum via the low-density lipoprotein receptor (LDLR). Further work will be required to determine how hepatic cholesterol is increased in this model, given that we have recently shown that expression of NCoRΔID reduces hepatic cholesterol accumulation via a decrease in cholesterol absorption (Fig. 3D and E) (21).
Given that we along with others have previously demonstrated that the SMRT receptor-interacting domains prefer the retinoic acid receptor isoforms, we next asked whether RAR targets in the liver were altered in the absence of SMRT (16). Indeed, L-SMRT KO mice had a 3-fold elevation in the expression of Cyp26a1, the principal enzyme involved in retinoic acid metabolism and the prototypical hepatic RAR target (Fig. 3F) (29). In contrast, expression of NCoRΔID had no effect on Cyp26a1 expression, confirming that it is a specific target of SMRT. We also examined the expression of additional hepatic RAR targets which were expressed at levels equal to those of the controls in L-SMRT KO and L-DKO mice, suggesting that SMRT targets only certain RAR targets (Fig. 3F). Additionally, one RAR target, Rarres1, appears to be an NCoR1 target. Taken together, these data indicate that TR signaling is preferentially regulated by NCoR1 while RAR signaling is controlled, at least in part, by SMRT.
Disruption of NCoR1 and SMRT activates hepatic lipogenesis and lipid storage programs.
While NCoR1 and SMRT appeared to play distinct roles in TR signaling, further evaluation of the hepatic phenotype in L-DKO mice showed the presence of increased liver weight in both males and females (Fig. 4A). Examination of the livers across genotypes and sexes revealed a greater than 2-fold increase in hepatic triglyceride (TG) content in L-DKO mice while L-NCoRΔID or L-SMRT KO mice individually had hepatic TGs that were similar to those of control animals (Fig. 4A). Serum TGs were normal in L-DKO mice and in all other genotypes (Fig. 4B). We also measured VLDL secretion from the liver by blocking peripheral uptake and following serum triglycerides. Again, no difference was seen between controls and L-DKO mice, suggesting that increased hepatic synthesis was responsible for the increased amount of triglyceride found (Fig. 4C). Histology of the liver confirmed the increased storage of TG in the context of steatosis in L-DKO mice while L-SMRT KO animals had no evidence of hepatic steatosis (Fig. 4D). Interestingly, the amount of accumulated TG in L-DKO mice is similar to that found in liver-specific HDAC3 KO mice, suggesting that disruption of both corepressors prevents the action of HDAC3 in repressing lipogenic gene expression and lipid storage (30). Consistent with the HDAC3 KO phenotype, we found no difference in glucose tolerance between L-DKO mice and controls despite the hepatic steatosis present (Fig. 4E).
FIG 4.

Disruption of NCoR1 and SMRT causes hepatic steatosis. (A) Liver weight normalized for body weight (LW/BW) and hepatic triglyceride levels were determined in all genotypes from both male and female animals (n = 5 or 6 per group). (B) Serum triglyceride levels were determined in both male and female mice across all genotypes (n = 5 or 6 per group). (C) VLDL secretion was determined by measuring serum triglycerides both before and after the injection of tyloxapol in female animals (n = 4 to 8 per group). (D) Representative H&E staining of liver sections with lipid droplet accumulation (arrows) within the indicated genotypes. (E) Glucose tolerance tests were performed on female mice with the indicated genotypes (n = 7 to 15 per group). For panels A, B, C, and E the data are shown as the means ± SEM. ***, P < 0.001; **, P < 0.01; *, P < 0.05 (by one-way ANOVA).
To understand how the disruption of both NCoR1 and SMRT leads to hepatic steatosis, we performed microarray analysis on L-DKO, L-SMRT KO, and control animals. As shown in Fig. 5A, 100 genes were either activated or repressed in L-SMRT KO mice by more than 2-fold while close to double this amount were regulated in L-DKO mice. Analysis of metabolic pathways using the DAVID database showed that the disruption of both CoRs led to the activation of pathways involved in fatty acid biosynthesis and peroxisome proliferator-activated receptor (PPAR) signaling consistent with the steatosis seen (Table 1). Previously we have performed microarray analysis on L-NCoRΔID mice and found that a significant number of lipogenic genes were activated in the euthyroid state (5). Interestingly, all of these genes were also activated in L-DKO mice, and only one was activated in L-SMRT KO mice (Table 2). We then compared expression of three of these targets, Me1, Pltp, and Scd1, in all genotypes, and, indeed, while the expression of NCoRΔID led to their upregulation, the combined disruption of NCoR1 and SMRT in L-DKO mice led to even further increases in their mRNA expression levels by close to 2-fold (Fig. 5B). In addition to upregulation at the level of gene expression of lipogenic targets, we also found an increase at the protein level as well, as demonstrated by FASN, which was dramatically upregulated in L-DKO mice (Fig. 5B). Thus, while NCoR1 appears to be the major suppressor of lipogenic gene expression, SMRT can play a role in the absence of NCoR1, and the disruption of both leads to clear steatosis. Given that HDAC3 KO mice also had evidence of enhanced lipid storage, we also asked whether this pathway was activated in L-DKO mice. Indeed, genes such as Fitm1, Cidec, G0s2, and Plin2 were all significantly increased in L-DKO mice based on microarray analysis and as confirmed by qPCR (Fig. 5C). Thus, the disruption of both NCoR1 and SMRT leads to a very similar phenotype to that found in mice that lack HDAC3 in the liver.
FIG 5.
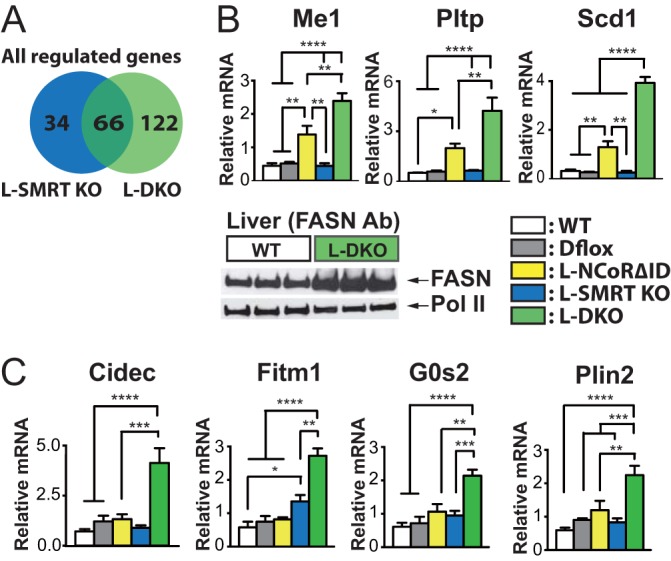
NCoR1 and SMRT regulate lipogenesis and lipid storage. (A) Microarray analysis was performed on mRNA from Dflox, L-SMRT KO, and L-DKO mice. Shown are the genes regulated by greater than 2-fold in L-SMRT KO and L-DKO versus Dflox controls. (B) Lipogenic gene expression was analyzed by qPCR in all genotypes, and Western analysis was used to assess FASN protein levels. (C) The expression of lipid storage genes was determined by qPCR in all genotypes in female mice. For qPCR, 5 or 6 mice per group were used. The data are shown as the means ± SEM. ****, P < 0.0001; ***, P < 0.001; **, P < 0.01; *, P < 0.05 (by one-way ANOVA).
TABLE 1.
Pathway analysis by using DAVID database
| Gene group and pathway (n = 3/group)a | Biological process | No. of genes | P value |
|---|---|---|---|
| Genes upregulated in L-DKO mice | |||
| KEGG | PPAR signaling pathway | 13 | 4.81E−10 |
| Retinol metabolism | 11 | 2.09E−08 | |
| Biosynthesis of unsaturated fatty acids | 7 | 1.32E−06 | |
| Steroid hormone biosynthesis | 8 | 2.14E−06 | |
| Metabolism of xenobiotics by cytochrome P450 | 7 | 2.65E−04 | |
| Drug metabolism | 7 | 5.32E−04 | |
| Arachidonic acid metabolism | 7 | 9.14E−04 | |
| Pyruvate metabolism | 5 | 0.00229 | |
| Fatty acid biosynthesis | 3 | 0.00271 | |
| Fatty acid metabolism | 5 | 0.00323 | |
| Linoleic acid metabolism | 5 | 0.00350 | |
| Propanoate metabolism | 4 | 0.00781 | |
| Glutathione metabolism | 4 | 0.03427 | |
| BioCarta | Nuclear receptors in lipid metabolism and toxicity | 4 | 4.82E−03 |
| Genes upregulated in L-SMRT KO mice: KEGG | Steroid hormone biosynthesis | 2 | 0.06845 |
| Genes downregulated in L-DKO mice | |||
| KEGG | Complement and coagulation cascades | 5 | 0.00366 |
| Cytokine-cytokine receptor interaction | 8 | 0.00430 | |
| Drug metabolism | 4 | 0.02571 | |
| Prion diseases | 3 | 0.03554 | |
| PANTHERb | Vitamin D metabolism and pathway | 4 | 0.03024 |
| Genes downregulated in L-SMRT KO mice: KEGG | Olfactory transduction | 26 | 4.09E−11 |
| Steroid hormone biosynthesis | 4 | 0.00338 | |
| Primary bile acid biosynthesis | 3 | 0.00447 |
Up- and downregulation were determined relative to levels in control Dflox mice.
PANTHER, protein analysis through evolutionary relationships.
TABLE 2.
Microarray analysis of hepatic gene expression in female euthyroid animals
| Gene symbol | Fold change in expression by group (n = 3/group) |
||
|---|---|---|---|
| L-NCoRΔIDa | L-DKOb | L-SMRT KOb | |
| serpinb1a | 4.25 | 3.19 | − |
| thrsp | 4.19 | 2.47 | − |
| elovl6 | 3.99 | 3.66 | − |
| pltp | 3.71 | 4.31 | − |
| Me1 | 2.91 | 2.66 | − |
| ehhadh | 2.77 | 3.02 | − |
| cd36 | 2.75 | 2.48 | 1.57 |
| ly6a | 2.72 | − | − |
| rdh11 | 2.49 | 1.86 | − |
| sqle | 2.37 | − | − |
| fasn | 2.31 | 2.06 | − |
| acaca | 2.29 | 1.93 | − |
| Scd1 | 2.15 | 1.63 | − |
| Gstm6 | 2.12 | − | − |
| mvd | 2.11 | − | − |
| pmvk | 2.06 | − | − |
| anxa5 | 1.76 | − | − |
| Bst2 | 1.75 | − | − |
| fdps | 1.74 | − | − |
| gpam | 1.52 | − | − |
Data represent expression in L-NCoRΔID mice versus that in NCoRloxP/loxP mice (5).
Data represent expression in L-DKO or L-SMRT KO mice versus that in control Dflox mice. −, fold change is <1.
To better understand the increased lipogenesis in the liver of L-DKO mice, we looked at the expression of carbohydrate-responsive element binding protein (ChREBP encoded by Mlxipl) mRNA isoforms. We did this because the overexpression of ChREBP in the liver is known to significantly enhance lipogenesis and steatosis without worsening insulin sensitivity, which is consistent with the phenotype seen in L-DKO mice (31). Furthermore, ChREBP has recently been shown to be a TR target (32). As shown in Fig. 6A the expression levels of both Chrebpα and Chrebpβ mRNAs are upregulated in L-DKO mice along with a trend for the upregulation of Chrebpβ in L-NCoRΔID mice (Fig. 6A). To genetically confirm a TR-specific pathway for the activation of ChREBP and because liver X receptor (LXR) has also been shown to regulate expression of ChREBP and interact with NCoR1, we used a model where the principal hepatic LXR isoform (LXRα) has been deleted in either the presence or absence of hepatic NCoRΔID (5, 21, 33, 34). In these animals the hepatic expression of NCoRΔID clearly activates the expression of both ChREBP isoforms. However, the global deletion of LXRα did not abrogate the upregulation of ChREBP isoforms in the presence of NCoRΔID. This is consistent with the notion that enhanced expression of ChREBP in L-DKO mice is TR mediated although it remains possible that SMRT-LXR interactions play a further role in the regulation of ChREBP (Fig. 6B).
FIG 6.
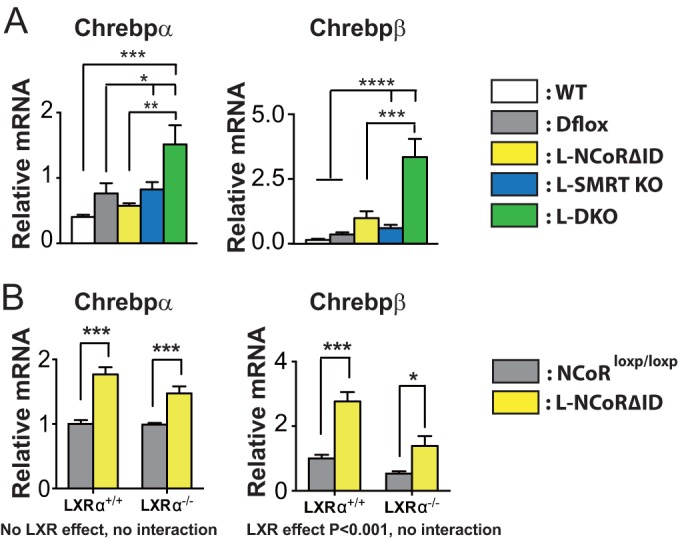
ChREBP expression is activated by the disruption of NCoR1 and SMRT. (A) The expression levels of ChREBPα and ChREBPβ were determined by qPCR in hepatic mRNA from female mice across all genotypes (n = 5 or 6 mice per group). The data are shown as the means ± standard errors of the means. ****, P < 0.0001; ***, P < 0.001; **, P < 0.01; *, P < 0.05 (by one-way ANOVA). (B) The expression levels of ChREBPα and ChREBPβ were determined by qPCR in hepatic mRNA from female L-NCoRΔID mice that either expressed LXRα or were null for LXRα. For this qPCR, 5 or 6 mice per group were used. The data are shown as the means ± SEM. ***, P < 0.001; *, P < 0.05 (by two-way ANOVA).
Global disruption of SMRT does not regulate the HPT axis.
Given that SMRT appeared to play little role in the regulation of TH targets in the liver, we next asked whether the global disruption of SMRT could regulate circulating TH levels by controlling the set point of the hypothalamic-pituitary-thyroid (HPT) axis. Importantly, we have shown previously that the global expression of NCoRΔID beginning either during embryogenesis or postnatally resets the HPT axis and leads to a reduction in circulating T4 levels (11). To disrupt SMRT globally, we chose a postnatal strategy, given that the deletion of SMRT during embryogenesis is lethal. We thus bred SMRTloxP/loxP mice with mice expressing a tamoxifen-activated Cre recombinase under the control the ubiquitin C promoter which effectively targets Cre to all cell types and tissues (35). We then treated both UBC-Cre SMRTloxP/loxP and SMRTloxP/loxP mice (control) at 6 weeks of age with tamoxifen for 5 days. As shown in Fig. 7A, hepatic expression of Smrt is nearly abolished in tamoxifen-treated UBC-Cre SMRTloxP/loxP (UBC-SKO) mice both at the mRNA and protein levels. Furthermore, recombination was also seen in genomic DNA from the tail, confirming the widespread deletion of SMRT in these animals (data not shown). Despite the apparent global deletion of SMRT, there was no effect on mortality in these animals in the time period viewed, and body weight remained similar to that of the controls. Interestingly, there was an increase in liver weight in UBC-SKO mice (Fig. 7A), and gene expression changes paralleled those in L-SMRT KO mice with an increase in Cyp26a1 expression but no increase in Thrsp (Fig. 7B).
FIG 7.

Global deletion of SMRT does not effect the hypothalamic-pituitary-thyroid axis. (A) SMRT mRNA and protein levels were analyzed to assess the recombination efficiency in the liver of UBC-SKO and control mice 4 weeks after tamoxifen treatment. The qPCR assay used is against exon 11 of SMRT. Body weights were measured in control and UBC-SKO mice at the indicated time points. Livers were weighed at the end of the experiment. (B) The expression levels of cyp26a1 and thrsp were determined by qPCR in hepatic mRNA from the indicated groups. (C) Gene expression of smrt, tshα, and tshβ subunits in the pituitary were quantified by qPCR from both UBC-SKO and control mice. Serum total T4 levels were measured in control and UBC-SKO mice at the indicated time points after administration of tamoxifen. All data are shown as the means ± SEM (****, P < 0.0001; **, P < 0.01; *, P < 0.05). An unpaired t test was used for all data except for total T4 levels and body weights, which were compared statistically by two-way repeated-measures ANOVA (n = 8 male mice per group).
To evaluate the role of SMRT in the regulation of the HPT axis, we first examined the expression of SMRT in the pituitary of UBC-SKO mice, and, as shown in Fig. 7C, it was consistent with what was seen in the liver of these animals. We then looked at plasma total T4 levels both before and then weekly after tamoxifen administration (Fig. 7C). While there was an unexpected difference between T4 levels in untreated UBC-Cre SMRTloxP/loxP mice and SMRTloxP/loxP mice at 6 weeks of age, further differences were not seen, including immediately after receiving tamoxifen and for the ensuing 4 weeks. Furthermore, there was no correlation between pituitary smrt mRNA expression and serum T4 levels in UBC-SKO mice (Fig. 7C). Finally, we examined expression of the Tshα and Tshβ subunit genes and found no difference in their expression levels in the pituitary, consistent with a lack of effect on the thyroid axis (Fig. 7C).
DISCUSSION
The nuclear corepressors NCoR1 and SMRT play a critical role in both nuclear receptor signaling and signaling by other transcription factors. Developmental studies suggest that NCoR1 and SMRT play nonredundant roles, and genetic studies demonstrate a role for both in serving as an important checkpoint for ligand sensitivity in nuclear receptor signaling (4, 36). In the context of thyroid hormone action, NCoR1 is necessary for limiting T3 positive gene regulation such that in all thyroid states T3 action is enhanced in the absence of functional NCoR1 (5, 6, 11). SMRT has also been described to play a role in T3 action in vivo where it is necessary to activate a lung development program in the absence of T3 and to regulate hepatic T3 targets in an analogous fashion to NCoR1 (37). However, prior to the data presented here, the cell-specific actions of the two principal nuclear receptor corepressors had not been addressed in a simultaneous fashion.
By disrupting the function of both NCoR1 and SMRT in the liver, we clearly demonstrate that NCoR1 is the principal corepressor for TH targets as SMRT had little to no affect on their regulation in either the euthyroid state or the hypothyroid state. Interestingly, the actions of NCoR1 were limited to positively regulated TH target genes, and the disruption of both corepressors did not affect negatively regulated TH targets, making the role of corepressors in negative regulation unclear. While NCoR1 clearly mediates T3 sensitivity on hepatic T3 targets, the disruption of both corepressors did have an effect on TH metabolism as T4 and T3 levels were slightly lower in L-DKO mice. Review of our microarray data suggests that this is mediated by a dramatic increase in phase II metabolizing enzymes in the liver, including Sult2a1, which can potentiate the metabolism of T4 and T3 by deiodinases (data not shown) (38). Thus, corepressor function can control nuclear receptor signaling in the context of not only receptor function but also ligand availability.
While NCoR1 had the predominant effect on TH targets, we were also surprised by the limited primary role of SMRT in the liver in the context of not only TH action but also lipogenesis. This was not an abundance issue as protein levels of SMRT in the liver are close to those of NCoR1, based on Western analysis. Indeed, the role of SMRT in the liver appears to be primarily directed at the regulation of retinoid metabolism via the control of Cyp26a1. This action would be consistent with the known preference of the SMRT S2 RID for RAR isoforms (16, 19). Further analysis of retinoid metabolism in L-SMRT KO mice will be interesting to discern and to understand why the disruption did not augment the expression of other well-known RAR targets in the liver.
While SMRT played little role in TH action in the liver, we also wanted to assess its role systemically in establishing the set point of the thyroid axis. Indeed, expression of NCoRΔID postnatally using a tamoxifen-activated Cre lowers T4 levels and confirms the key role of NCoR1 in TH action (11). Using an identical strategy, we could effectively delete SMRT globally without detrimental effects on survival. Furthermore, while the global deletion of SMRT had similar effects on the liver as in liver-specific SMRT KO mice, there were no changes seen in circulating T4 levels, thus further supporting the limited role of SMRT in TH action either in the liver or systemically.
Though SMRT plays a limited role in isolation on hepatic metabolism, it clearly functions as an important mediator in conjunction with NCoR1 in regulating lipogenesis. Indeed, while NCoR1 is sufficient for the regulation of lipogenic targets, disruption of both NCoR1 and SMRT is necessary for steatosis and activation of lipid droplet synthesis. Further studies are required to understand why NCoR1 and SMRT recruitment is varied by target NRs to each target. Clearly, there is profound activation in the lipogenic pathway and lipid storage in the L-DKO mice compared to the levels in L-NCoRΔID or L-SMRT KO mice with accumulation of triglycerides and lipid droplets. Interestingly, the phenotype closely resembles that seen in liver-specific HDAC3 KO mice with similar amounts of stored lipid and no evidence of glucose intolerance despite the presence of hepatic steatosis (30, 39). In contrast, mice that contain mutations in the HDAC3-activating domain of both SMRT and NCoR1 have a milder phenotype than present in the L-DKO mice described here (40). While the backgrounds of the studied mice are different, taken together, the data suggest that HDAC3 recruitment to lipogenic targets is completely dependent upon NCoR1 and SMRT and that HDAC3 may have functions separate from its ability to acetylate as its recruitment appears to be far more important than its activation. This is consistent with the recent work of Sun et al. and suggests that HDAC3 has other key functions that mediate transcriptional repression separate from its ability to function as a deacetylase (41).
To try to understand how the lipogenic process was being activated in the absence of corepressor function, we examined the expression of ChREBP, which is a known TR target and whose hepatic overexpression leads to a phenotype that is very similar to that present in L-DKO mice (31). Indeed, in L-DKO mice both isoforms of ChREBP are upregulated, and this upregulation is independent of LXR, suggesting that the enhanced function of the TR in the absence of corepressor function mediates the activation of ChREBP, which is able to induce and play a significant role in the cascade of lipogenesis and increased lipid deposition seen in this model.
Taking these observation together, the work presented demonstrates that the individual nuclear corepressors NCoR1 and SMRT play specific cellular roles in thyroid hormone action. Indeed, despite similar levels, SMRT appears to play a marginal role in mediating TH sensitivity in vivo and may be specifically targeted to regulate RAR action (Fig. 8). While NCoR1 is the principal corepressor involved in regulating TH action, it also plays a primary role in regulating lipogenesis, which is also likely regulated by a number of other nuclear receptors, including the Rev-Erb isoforms and LXRα. However, SMRT can to some extent compensate for NCoR1 in its absence, and thus the deletion of both corepressors accentuates the hepatic steatosis seen. Indeed, other nuclear receptors may be involved in this process, and the specificity of the corepressors here remains to be determined. Clearly, the similarities of L-DKO mice to liver-specific HDAC3 KO mice establish the sufficiency of NCoR1 and SMRT for mediating all of the actions of HDAC3. However, to specifically target hormone action, the inhibition of HDAC3 function will be inadequate, and unique strategies for targeting individual corepressors will be required.
FIG 8.
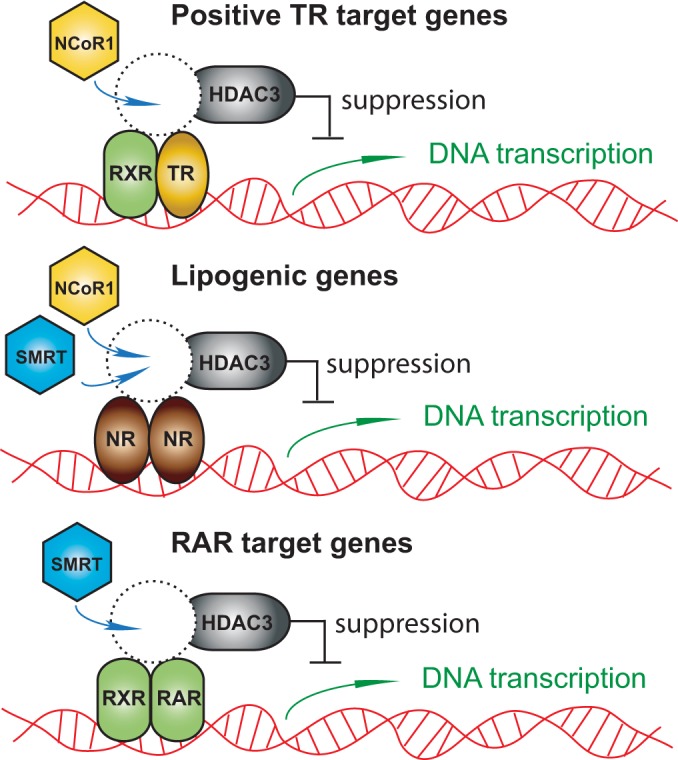
A model for hepatic corepressor function. NCoR1 is the principal corepressor that regulates thyroid hormone action in the liver through the recruitment of HDAC3. In contrast, with respect to lipogenic genes and those involved in lipid storage, both NCoR1 and SMRT play a role either through their involvement with separate NRs or through the regulation of ChREBP. Finally, SMRT may be the principal corepressor for RAR isoform signaling.
ACKNOWLEDGMENTS
This work was supported by NIH grants DK078125 (R.N.C.) and DK056123 (A.N.H.) and ADA grant 7-13-BS-033 (R.N.C.).
We thank David Mangelsdorf for the LXRα knockout mice.
REFERENCES
- 1.Bianco AC, Kim BW. 2006. Deiodinases: implications of the local control of thyroid hormone action. J Clin Invest 116:2571–2579. doi: 10.1172/JCI29812. [DOI] [PMC free article] [PubMed] [Google Scholar]
- 2.Yen PM. 2001. Physiological and molecular basis of thyroid hormone action. Physiol Rev 81:1097–1142. [DOI] [PubMed] [Google Scholar]
- 3.Cheng SY, Leonard JL, Davis PJ. 2010. Molecular aspects of thyroid hormone actions. Endocr Rev 31:139–170. doi: 10.1210/er.2009-0007. [DOI] [PMC free article] [PubMed] [Google Scholar]
- 4.Astapova I, Hollenberg AN. 2013. The in vivo role of nuclear receptor corepressors in thyroid hormone action. Biochim Biophys Acta 1830:3876–3881. doi: 10.1016/j.bbagen.2012.07.001. [DOI] [PMC free article] [PubMed] [Google Scholar]
- 5.Astapova I, Lee LJ, Morales C, Tauber S, Bilban M, Hollenberg AN. 2008. The nuclear corepressor, NCoR, regulates thyroid hormone action in vivo. Proc Natl Acad Sci U S A 105:19544–19549. doi: 10.1073/pnas.0804604105. [DOI] [PMC free article] [PubMed] [Google Scholar]
- 6.Astapova I, Vella KR, Ramadoss P, Holtz KA, Rodwin BA, Liao XH, Weiss RE, Rosenberg MA, Rosenzweig A, Hollenberg AN. 2011. The nuclear receptor corepressor (NCoR) controls thyroid hormone sensitivity and the set point of the hypothalamic-pituitary-thyroid axis. Mol Endocrinol 25:212–224. doi: 10.1210/me.2010-0462. [DOI] [PMC free article] [PubMed] [Google Scholar]
- 7.Vella KR, Ramadoss P, Costa ESRH, Astapova I, Ye FD, Holtz KA, Harris JC, Hollenberg AN. 2014. Thyroid hormone signaling in vivo requires a balance between coactivators and corepressors. Mol Cell Biol 34:1564–1575. doi: 10.1128/MCB.00129-14. [DOI] [PMC free article] [PubMed] [Google Scholar]
- 8.Hu X, Lazar MA. 1999. The CoRNR motif controls the recruitment of corepressors by nuclear hormone receptors. Nature 402:93–96. doi: 10.1038/47069. [DOI] [PubMed] [Google Scholar]
- 9.Jepsen K, Gleiberman AS, Shi C, Simon DI, Rosenfeld MG. 2008. Cooperative regulation in development by SMRT and FOXP1. Genes Dev 22:740–745. doi: 10.1101/gad.1637108. [DOI] [PMC free article] [PubMed] [Google Scholar]
- 10.Jepsen K, Hermanson O, Onami TM, Gleiberman AS, Lunyak V, McEvilly RJ, Kurokawa R, Kumar V, Liu F, Seto E, Hedrick SM, Mandel G, Glass CK, Rose DW, Rosenfeld MG. 2000. Combinatorial roles of the nuclear receptor corepressor in transcription and development. Cell 102:753–763. doi: 10.1016/S0092-8674(00)00064-7. [DOI] [PubMed] [Google Scholar]
- 11.Costa-e-Sousa RH, Astapova I, Ye F, Wondisford FE, Hollenberg AN. 2012. The thyroid axis is regulated by NCoR1 via its actions in the pituitary. Endocrinology 153:5049–5057. doi: 10.1210/en.2012-1504. [DOI] [PMC free article] [PubMed] [Google Scholar]
- 12.Nofsinger RR, Li P, Hong SH, Jonker JW, Barish GD, Ying H, Cheng SY, Leblanc M, Xu W, Pei L, Kang YJ, Nelson M, Downes M, Yu RT, Olefsky JM, Lee CH, Evans RM. 2008. SMRT repression of nuclear receptors controls the adipogenic set point and metabolic homeostasis. Proc Natl Acad Sci U S A 105:20021–20026. doi: 10.1073/pnas.0811012105. [DOI] [PMC free article] [PubMed] [Google Scholar]
- 13.Li P, Fan W, Xu J, Lu M, Yamamoto H, Auwerx J, Sears DD, Talukdar S, Oh D, Chen A, Bandyopadhyay G, Scadeng M, Ofrecio JM, Nalbandian S, Olefsky JM. 2011. Adipocyte NCoR knockout decreases PPARγ phosphorylation and enhances PPARγ activity and insulin sensitivity. Cell 147:815–826. doi: 10.1016/j.cell.2011.09.050. [DOI] [PMC free article] [PubMed] [Google Scholar]
- 14.Yamamoto H, Williams EG, Mouchiroud L, Canto C, Fan W, Downes M, Heligon C, Barish GD, Desvergne B, Evans RM, Schoonjans K, Auwerx J. 2011. NCoR1 is a conserved physiological modulator of muscle mass and oxidative function. Cell 147:827–839. doi: 10.1016/j.cell.2011.10.017. [DOI] [PMC free article] [PubMed] [Google Scholar]
- 15.Cohen RN, Brzostek S, Kim B, Chorev M, Wondisford FE, Hollenberg AN. 2001. The specificity of interactions between nuclear hormone receptors and corepressors is mediated by distinct amino acid sequences within the interacting domains. Mol Endocrinol 15:1049–1061. doi: 10.1210/mend.15.7.0669. [DOI] [PubMed] [Google Scholar]
- 16.Cohen RN, Putney A, Wondisford FE, Hollenberg AN. 2000. The nuclear corepressors recognize distinct nuclear receptor complexes. Mol Endocrinol 14:900–914. doi: 10.1210/mend.14.6.0474. [DOI] [PubMed] [Google Scholar]
- 17.Reilly SM, Bhargava P, Liu S, Gangl MR, Gorgun C, Nofsinger RR, Evans RM, Qi L, Hu FB, Lee CH. 2010. Nuclear receptor corepressor SMRT regulates mitochondrial oxidative metabolism and mediates aging-related metabolic deterioration. Cell Metab 12:643–653. doi: 10.1016/j.cmet.2010.11.007. [DOI] [PMC free article] [PubMed] [Google Scholar]
- 18.Sutanto MM, Ferguson KK, Sakuma H, Ye H, Brady MJ, Cohen RN. 2010. The silencing mediator of retinoid and thyroid hormone receptors (SMRT) regulates adipose tissue accumulation and adipocyte insulin sensitivity in vivo. J Biol Chem 285:18485–18495. doi: 10.1074/jbc.M110.107680. [DOI] [PMC free article] [PubMed] [Google Scholar]
- 19.Hong SH, Dvorak-Ewell M, Stevens HY, Barish GD, Castro GL, Nofsinger R, Frangos JA, Shoback D, Evans RM. 2013. Rescue of a primary myelofibrosis model by retinoid-antagonist therapy. Proc Natl Acad Sci U S A 110:18820–18825. doi: 10.1073/pnas.1318974110. [DOI] [PMC free article] [PubMed] [Google Scholar]
- 20.Postic C, Shiota M, Niswender KD, Jetton TL, Chen Y, Moates JM, Shelton KD, Lindner J, Cherrington AD, Magnuson MA. 1999. Dual roles for glucokinase in glucose homeostasis as determined by liver and pancreatic beta cell-specific gene knock-outs using Cre recombinase. J Biol Chem 274:305–315. doi: 10.1074/jbc.274.1.305. [DOI] [PubMed] [Google Scholar]
- 21.Astapova I, Ramadoss P, Costa-e Sousa RH, Ye F, Holtz KA, Li Y, Niepel MW, Cohen DE, Hollenberg AN. 2014. Hepatic nuclear corepressor 1 regulates cholesterol absorption through a TRβ1-governed pathway. J Clin Invest 124:1976–1986. doi: 10.1172/JCI73419. [DOI] [PMC free article] [PubMed] [Google Scholar]
- 22.Herman MA, Peroni OD, Villoria J, Schon MR, Abumrad NA, Bluher M, Klein S, Kahn BB. 2012. A novel ChREBP isoform in adipose tissue regulates systemic glucose metabolism. Nature 484:333–338. doi: 10.1038/nature10986. [DOI] [PMC free article] [PubMed] [Google Scholar]
- 23.Folch J, Lees M, Sloane Stanley GH. 1957. A simple method for the isolation and purification of total lipides from animal tissues. J Biol Chem 226:497–509. [PubMed] [Google Scholar]
- 24.Rainer J, Sanchez-Cabo F, Stocker G, Sturn A, Trajanoski Z. 2006. CARMAweb: comprehensive R- and bioconductor-based web service for microarray data analysis. Nucleic Acids Res 34:W498–W503. doi: 10.1093/nar/gkl038. [DOI] [PMC free article] [PubMed] [Google Scholar]
- 25.Ramadoss P, Abraham BJ, Tsai L, Zhou Y, Costa ESRH, Ye F, Bilban M, Zhao K, Hollenberg AN. 2014. Novel mechanism of positive versus negative regulation by thyroid hormone receptor beta 1 (TRβ1) identified by genome-wide profiling of binding sites in mouse liver. J Biol Chem 289:1313–1328. doi: 10.1074/jbc.M113.521450. [DOI] [PMC free article] [PubMed] [Google Scholar]
- 26.Smyth GK. 2004. Linear models and empirical Bayes methods for assessing differential expression in microarray experiments. Stat Appl Genet Mol Biol 3:1–25. doi: 10.2202/1544-6115.1027. [DOI] [PubMed] [Google Scholar]
- 27.Guo C, Gow CH, Li Y, Gardner A, Khan S, Zhang J. 2012. Regulated clearance of histone deacetylase 3 protects independent formation of nuclear receptor corepressor complexes. J Biol Chem 287:12111–12120. doi: 10.1074/jbc.M111.327023. [DOI] [PMC free article] [PubMed] [Google Scholar]
- 28.Gullberg H, Rudling M, Salto C, Forrest D, Angelin B, Vennstrom B. 2002. Requirement for thyroid hormone receptor beta in T3 regulation of cholesterol metabolism in mice. Mol Endocrinol 16:1767–1777. doi: 10.1210/me.2002-0009. [DOI] [PubMed] [Google Scholar]
- 29.Ross AC, Zolfaghari R. 2011. Cytochrome P450s in the regulation of cellular retinoic acid metabolism. Annu Rev Nutr 31:65–87. doi: 10.1146/annurev-nutr-072610-145127. [DOI] [PMC free article] [PubMed] [Google Scholar]
- 30.Sun Z, Miller RA, Patel RT, Chen J, Dhir R, Wang H, Zhang D, Graham MJ, Unterman TG, Shulman GI, Sztalryd C, Bennett MJ, Ahima RS, Birnbaum MJ, Lazar MA. 2012. Hepatic Hdac3 promotes gluconeogenesis by repressing lipid synthesis and sequestration. Nat Med 18:934–942. doi: 10.1038/nm.2744. [DOI] [PMC free article] [PubMed] [Google Scholar]
- 31.Benhamed F, Denechaud PD, Lemoine M, Robichon C, Moldes M, Bertrand-Michel J, Ratziu V, Serfaty L, Housset C, Capeau J, Girard J, Guillou H, Postic C. 2012. The lipogenic transcription factor ChREBP dissociates hepatic steatosis from insulin resistance in mice and humans. J Clin Invest 122:2176–2194. doi: 10.1172/JCI41636. [DOI] [PMC free article] [PubMed] [Google Scholar]
- 32.Gauthier K, Billon C, Bissler M, Beylot M, Lobaccaro JM, Vanacker JM, Samarut J. 2010. Thyroid hormone receptor beta (TRβ) and liver X receptor (LXR) regulate carbohydrate-response element-binding protein (ChREBP) expression in a tissue-selective manner. J Biol Chem 285:28156–28163. doi: 10.1074/jbc.M110.146241. [DOI] [PMC free article] [PubMed] [Google Scholar]
- 33.Cha JY, Repa JJ. 2007. The liver X receptor (LXR) and hepatic lipogenesis. The carbohydrate-response element-binding protein is a target gene of LXR J Biol Chem 282:743–751. doi: 10.1074/jbc.M605023200. [DOI] [PubMed] [Google Scholar]
- 34.Wagner BL, Valledor AF, Shao G, Daige CL, Bischoff ED, Petrowski M, Jepsen K, Baek SH, Heyman RA, Rosenfeld MG, Schulman IG, Glass CK. 2003. Promoter-specific roles for liver X receptor/corepressor complexes in the regulation of ABCA1 and SREBP1 gene expression. Mol Cell Biol 23:5780–5789. doi: 10.1128/MCB.23.16.5780-5789.2003. [DOI] [PMC free article] [PubMed] [Google Scholar]
- 35.Ruzankina Y, Pinzon-Guzman C, Asare A, Ong T, Pontano L, Cotsarelis G, Zediak VP, Velez M, Bhandoola A, Brown EJ. 2007. Deletion of the developmentally essential gene ATR in adult mice leads to age-related phenotypes and stem cell loss. Cell Stem Cell 1:113–126. doi: 10.1016/j.stem.2007.03.002. [DOI] [PMC free article] [PubMed] [Google Scholar]
- 36.Hollenberg AN. 2012. Metabolic health and nuclear-receptor sensitivity. N Engl J Med 366:1345–1347. doi: 10.1056/NEJMcibr1114529. [DOI] [PubMed] [Google Scholar]
- 37.Pei L, Leblanc M, Barish G, Atkins A, Nofsinger R, Whyte J, Gold D, He M, Kawamura K, Li HR, Downes M, Yu RT, Powell HC, Lingrel JB, Evans RM. 2011. Thyroid hormone receptor repression is linked to type I pneumocyte-associated respiratory distress syndrome. Nat Med 17:1466–1472. doi: 10.1038/nm.2450. [DOI] [PMC free article] [PubMed] [Google Scholar]
- 38.Vella KR, Ramadoss P, Lam FS, Harris JC, Ye FD, Same PD, O'Neill NF, Maratos-Flier E, Hollenberg AN. 2011. NPY and MC4R signaling regulate thyroid hormone levels during fasting through both central and peripheral pathways. Cell Metab 14:780–790. doi: 10.1016/j.cmet.2011.10.009. [DOI] [PMC free article] [PubMed] [Google Scholar]
- 39.Knutson SK, Chyla BJ, Amann JM, Bhaskara S, Huppert SS, Hiebert SW. 2008. Liver-specific deletion of histone deacetylase 3 disrupts metabolic transcriptional networks. EMBO J 27:1017–1028. doi: 10.1038/emboj.2008.51. [DOI] [PMC free article] [PubMed] [Google Scholar]
- 40.You SH, Lim HW, Sun Z, Broache M, Won KJ, Lazar MA. 2013. Nuclear receptor co-repressors are required for the histone-deacetylase activity of HDAC3 in vivo. Nat Struct Mol Biol 20:182–187. doi: 10.1038/nsmb.2476. [DOI] [PMC free article] [PubMed] [Google Scholar]
- 41.Sun Z, Feng D, Fang B, Mullican SE, You SH, Lim HW, Everett LJ, Nabel CS, Li Y, Selvakumaran V, Won KJ, Lazar MA. 2013. Deacetylase-independent function of HDAC3 in transcription and metabolism requires nuclear receptor corepressor. Mol Cell 52:769–782. doi: 10.1016/j.molcel.2013.10.022. [DOI] [PMC free article] [PubMed] [Google Scholar]